1999
Volume 64 215 Number 6, 2016
http://dx.doi.org/10.11118/actaun201664061999
LIQUIDITY FORMS AND BANK SIZE
Jana Laštůvková
11 Department of Finance, Faculty of Business and Economics, Mendel University in Brno, Zemědělská 1, 613 00 Brno, Czech Republic
Abstract
LAŠTŮVKOVÁ JANA. 2016. Liquidity Forms and Bank Size. Acta Universitatis Agriculturae et Silviculturae Mendelianae Brunensis, 64(6): 1999–2006.
The article deals with relationship between bank liquidity and variables representing the size of banks – such a total assets, gross volume of loans and clients deposits. For higher complexity, multiple dependent variables are used. The values are calculated based on a specific method of liquidity risk measurement – gross liquidity flows. To determine the possible relations the robust panel regression analysis together with the time series analysis are performed. The differences have been showed not just among different size groups but also among the same size groups in the different banking sectors. Keywords: liquidity forms, size of banks, size groups, banking sectors
INTRODUCTION
Liquidity of banks has been recently a much discussed issue, mainly after the last global crisis, when many banks or systems faced shortages of liquidity. The studies of the authors focus on the determinants affecting banks’ liquidity, the impact of the crisis on liquidity, as well as on liquidity in the context of financial stability.
All these studies in some way take into account bank size during analyses. Whether it is about including size as one of the determinants of liquidity, application of data on groups of different size, investigation of an impact of size on the level of risk during a crisis or determining the role of size in measuring systematically important institutions. In spite of relatively often inclusion of a size variable, a number of questions and topics is unclear – e.g. optimal bank size, which would not lead to disrupting of stability (moral hazard from the position “too big to fail”), how large is the role of size in evaluating systematic risk or also a relatively basic question related to management of liquid assets considering size of banks. However, it is clear that size as an internal characteristic of banks is accepted as a possible factor, which is necessary to be taken into consideration.
The aim of the paper is to identify possible relationship between bank liquidity and variables representing the size of banks – such a total assets, gross volume of loans and clients deposits, using
the panel regression analyses together with time series analysis. The regressions operate with a larger number of dependent variables to represent different views on the liquidity risk. Panel is made from size groups of Czech, Slovak and Slovenian banks.
Liquidity and Size of Banks
The studies, which include bank size as one of possible variables, work especially with the total value of assets (see Bunda and Desguilbet, 2008; Berger and Bouwman, 2009; Pana et al., 2010; Fungáčová et al., 2010; Ahmed et al., 2011; Vodová, 2011a, 2011b, 2012, 2013; Horvath et al., 2012; Trenca et al., 2012; Bonfim and Kim, 2012; Cucinelli, 2013; Lei and Song, 2013; Laštůvková, 2015). But there also appear another studies, which use different variables representing bank size. These are for example the total number of clients (see the studies of Lakštutiene and Krušinskas, 2010; Hackethal et al., 2010), volume of loans (Aspachs et al., 2005; Hackethal et al., 2010; Lakštutiene and Krušinskas, 2010), size of deposits (Lakštutiene and Krušinskas, 2010). To determine bank size, it is possible to use also another alternative variables, e.g. a number of branches or ATMs, naturally, availability of data about these measures could be a significant problem. From the above it is clear that the authors always consider a certain form of bank size as a possible factor.
There is expectation that size groups manage liquidity differently; they have different strategies (see e.g. Laštůvková, 2014). This diverse behaviour can then cause, that liquidity of size groups are sensitive to different factors. Generally is expected that the bigger the bank is, the less liquidity it holds and more relies and obtains it from the financial markets. It is connected with concept “too big to fail”, where big banks know, that they are big enough to be supported by state or central bank. This concept is highly connected with systemic risk, the reason why central banks and government are willing to support these banks, is the fact, that they can threaten the whole financial sector or real economy. Here must be pointed out, that it is not always just about the size of banks, but there are other aspects creating systemic risk – like interconnection of banks or their complexity (see Tarashev et al., 2010; Komárková et al., 2011/2012; BIS, 2013; Lu and Hu, 2014). Whether is the institution too big or it is counted from other reason as a systemic important institution, it operates with higher (liquidity) risk, resulting from moral hazard (see e.g. Cucinelli, 2013; Laeven et al., 2014).
Laeven et al. (2014) state, as an explanation of this more risky profile, that large banks have better possibility of diversification, which subsequently decreases riskiness of a portfolio, what enables banks to keep a lower quantity of capital and to use less stable funding. These consequences, however, lead to higher tendencies to accept higher risk and during mutual acting at the interbank markets they, in the end, rather lead to higher risks for large banks than small ones, which do not have these possibilities of diversification and which do not have such an access to the market. As said by Leaven et al. (2014), by higher risk, large banks contribute more to the systemic risk.
In spite of the prevailing assumption that increasing bank size leads to decreasing of
the value of liquid assets, i.e. existence of a negative relationship (related exactly to e.g. the concept of “too big to fail”), results of individual studies offer all possible alternatives. Bank size was showed with a negative relationship (e.g. studies of Aspachs et al., 2005; Bunda and Desquilbet, 2008; Hackethal et al., 2010; Vodová, 2011b, 2012, 2013; Horvath et al., 2012; Cucinelli, 2013; Lei and Song, 2013), when the negative relationship is explained exactly by e.g. the reliance of larger banks on authorities in case of their problems. Another studies identified a positive relationship (see Lakštutiene and Krušinskas, 2010; Pana et al., 2010; Vodová, 2011a; Bonfim and Kim, 2012), where a possible explanation can again be banks’ strategy for managing liquidity risk – banks, or a sector on which data have been applied – are considered as small and with growth of the total size they increase the value of liquid assets adequately. The last group of studies including bank size did not determine the variable as statistically significant (see e.g. Bunda and Desquilbet, 2008; Hackethal et al., 2010; Ahmed et al., 2011; Vodová, 2011b, 2012, 2013; Trenca et al., 2012).
Differences in the results can be given not only by the research sample of banks, sectors (generally large banks, e.g. American versus banks of small sectors e.g. the Slovak sector), but also by using different methods for the liquidity value acting in the role of the dependent variable. Generally, there exist two methods for determining the liquidity value acting in models – using ratio indicators (see e.g. Aspachs et al., 2005; Bunda and Desguilbet, 2008; Ahmed et al., 2011; Vodová, 2011a, 2011b, 2012, 2013; Bonfim and Kim, 2012; Trenca et al., 2012; Cucinelli, 2013) or the method of creation of liquidity according to Berger and Bouwman (2009) (see e.g. Pana et al., 2010; Fungáčová et al., 2010; Hackethal et al., 2010; Horvath et al., 2012; Lei and Song, 2013). The fact, that choosing a specific method may play a role is documented, for example, in the study of Vodová (2011a, 2011b, 2012, 2013) or Bunda and Desguilbet (2008), who, by work with several ratio indicators in the same sample, document several relationships.
MATERIALS AND METHODS
To determine the possible relation between size factors and chosen liquidity forms, panel robust regression analyses are performed. The general equation of the model is as follows:
Liquidity
itcons
size
n N n it n g it=
+
+ +
=∑
1β
ε
On the side of the variable being explained appear the individual calculated liquidity flows, different forms of liquidity. These are the positive flow (POS) representing the creation of liquidity, the negative flow (NEG) representing the outflow of liquidity, the net change (NET) as the difference between the above mentioned flows, and the total reallocation (TOT), which represents the activity in the system. The studied sample is the particular size groups of chosen banking sectors (Czech, Slovak and Slovenian). Banks are divided into 3 size groups according to the total value of their assets per period. It means, there are 3 × 4 models, for each size groups and each form of liquidity. From the sample are excluded the branches of foreign banks and saving banks.
As independent variables are used different factors representing size of banks, i.e. total assets (TA), gross volume of loans to costumer (LOAN) and deposits to costumers (DEP). It could have been possible to use other variables (see literature review), like total number of clients, number of branches, or number of ATMs. However, too many values would have been missed, so it was impossible to add these variables into models. To see specific characteristics of chosen sectors for each size group, dummy variables are added, as well.
Beside panel regression analysis, the time series analysis is performed to analyses particular size group in each sector for possible different sensitivity on involved size variables. The equation of the model is very similar to the first one, only without dummy variables.
Liquidity cons
tsize
p P p t p t=
+
+
=∑
1β
ε
The individual flows and reallocation were calculated on the basis of the method created by
Valla et al. (2006). To obtain these flows, the following method of processing the value of liquid assets is used:
1. Determining the year‑on‑year changes in liquid assets
∆
I
it=
I
it−
I
it−1 (1)where:
Iit – the liquidity value of bank i in time t, Iit − 1 – the liquidity value of bank i in time t − 1.
2. Determining the adjusted growth rate
Relation (2) is used to determine the adjusted growth rate of liquidity in time t for each bank:
g
I
I
I
it it it it=
+
(
−)
∆
1
/
2
(2)3. Determining the liquidity flows
By aggregating the values obtained from relation (2), either positive (3) (where git ≥ 0) or negative (4)
(where git ≤ 0) nominal flows are obtained.
POS
g
I
I
I
nomt it
i git
N it it
it i N
= ∑
(
+
)
∑
≥ − − = 0 1 1 12
/
(3)NEG
g
I
I
I
nomt it
i git
N it it
it i N
= ∑
(
+
)
∑
≤ − − = 0 1 1 12
/
(4)For positive flows, only positive (or zero) values of adjusted growth rate of individual banks are considered, weighted by the average share of total liquidity; for negative flows, only negative (zero) values of git are considered.
4. Calculation of the net changes
Whether a drop or a growth in liquidity of the given system occurred is determined via net liquidity flows.
NET
nomPOS
NEG
t
=
nomt−
nomt (5)5. Determining the total reallocation
Determining the total activity in the sector in the given time period.
TOTnom POS NEG NET
t= nomt+ nomt− nomt (6)
The value of liquid assets in the time period was obtained from the Bankscope database on an annual basis. The database defines liquid assets as follows:
Liquid assets
= Trading securities at FV through income + Loans and advances to banks
+ Reverse repos and cash collateral + Cash and due from banks − Mandatory minimum reserves
RESULTS AND DISCUSSION
The following Tab. I presents results for large groups of banks of chosen sectors (Czech, Slovak and Slovenian). The researched factors influenced all the dimensions (forms) of liquidity. The value of loans had multiple representation, when in case of increase of the item there was decrease of creation of liquidity (identical with the studies of Hackethal et al. (2010), who works with liquidity creation and loans as a variable expressing size) and increasing its outflow, which was reflected to a negative relationship with net change. In case of liquidity creation, the value of total assets was also significant and it was with positive influence. The positive relationship complies with the studies of Lakštutiene and Krušinskas (2010), Pana et al. (2010), Vodová (2011a), and Bonfim and Kim (2012). The positive relationship was enforced in
spite of the fact, that large groups of banks are in the sectors the key groups and their behaviour gives the development of the whole sector. In addition, they are often the institutions, which may, within their sector, rely on help of a central bank or a state in case of problems.
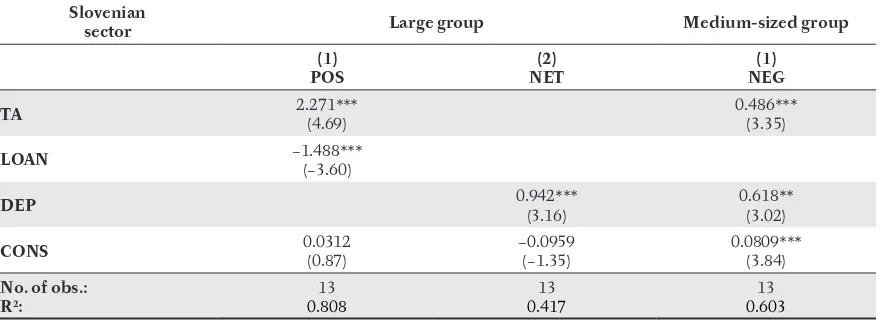
Looking at the individual sectors (see the Tab. IV, V and VI) and their large groups it is evident that mostly Slovenian large banks stand behind the statistically significant coefficient for total assets, for others large groups the relationship was not statistically significant. Here, it has to be remarked that the group of Slovenian large banks contains the smallest banks within the studied large groups and, as the only large group, it did not have a majority market share. These facts can play a role in existence of a positive relationship between liquidity creation and the total assets for this group. Regarding the total reallocation, it is positively influenced by
I: Results for large groups of banks Large
groups
(1) POS
(2) NEG
(3) NET
(4) TOT
TA 1.320***
(6.95)
−0.251*** (−4.10)
LOAN −0.711***
(−5.36)
0.164*** (3.22)
−0.729*** (−6.46)
0.166*** (15.89)
DEP −0.461***(−5.38) 1.713***(31.65)
DUMMY_CZ 0.0101**(1.96) −0.0148***(−8.09) 0.000298(0.12) 0.0305***(13.22)
DUMMY_SK 0.0793***
(19.87)
0.0669*** (13.20)
−0.00577*** (−10.45)
0.0908*** (84.21)
CONS 0.0453***
(3.04)
0.138*** (10.88)
−0.0770*** (−4.07)
0.0255*** (2.96)
No. of obs.: R2:
39
0.652 0.17739 0.46739 0.33139
Source: Author’s calculation
Note: * p < 0.1, ** p < 0.05, *** p < 0.01
II: Results for medium‑sized groups of banks Medium‑sized
groups POS(1) NEG(2) NET(3) TOT(4)
TA −0.127***
(−6.13)
LOAN
DEP 0.0802***(4.62)
DUMMY_CZ 0.0400***
(1.57)
0.00797*** (26.76)
0.0361*** (1.60)
0.0347*** (3.19)
DUMMY_SK −0.0108***
(−3.16)
0.00997*** (43.13)
−0.0209*** (−7.74)
0.0527*** (4.82)
CONS 0.144***(5.98) 0.129***(39.93) 0.0195***(2.23) 0.0854***(7.85) No. of obs.:
R2:
39
0.0235 0.024439 0.011739 0.045539
Source: Author’s calculation
growth of loans and negatively by growth of the total assets (see Tab. I (4)).
In spite of the Slovak large group created the most liquidity (see dummy variables for large groups, the Tab. I), it also recorded the highest outflow, which, in the end, led to the lowest (negative) net change within the researched groups. The Czech large group, thanks to the lowest outflow, recorded the highest net changes. Results in the Tab. IV, V and VI also indicate different sensitivity of large groups on the researched factors. As it was mentioned, the relationship of liquidity creation and the total assets was reflected only in case of the Slovenian group of large banks. The variable, which played a role in every group, was only the value of loans. In case of the large Czech group, variables were not reflected in liquidity creation at all, but they had great influence on its outflow, including the value of total assets, which was not reflected in outflow of all other large groups. Similarly, the value of deposits was reflected only in the Slovak and
Slovenian sector. The reason can be the influence of the introduction of Euro in these two countries connected with the massive inputs and withdraw of deposits from the side of households.
The results for two other groups (Tab. II and III) offer significance only for some of the chosen liquidity forms.
In the medium‑sized groups (Tab. II), the factors had influence only on liquidity outflow, and it was negative for the total assets and positive for deposits, which indicates lower outflows in increasing of the total assets and decreasing of deposits. It is interesting that this negative relationship in the total assets for all the groups is not reflected by the negative relationship also for the Slovenian middle‑sized group (Tab. VI), however, the positive relationship was reflected, which indicates higher outflow of liquidity in higher value of assets. Unlike the large Slovak banks, the middle‑sized group of Slovak banks was the group with the lowest creation
III: Results for small groups of banks Small
groups
(1) POS
(2) NEG
(3) NET
(4) TOT
TA 0.252***
(3.84)
0.0642*** (3.17)
LOAN −0.138***
(−3.56)
DEP
DUMMY_CZ 0.0554***(3.90) −0.0345***(−10.57) 0.133***(1.14) 0.0320***(6.31)
DUMMY_SK −0.0489***
(−7.12)
0.00636*** (2.76)
−0.0744*** (−6.41)
−0.0110*** (−3.66)
CONS 0.177***
(69.58)
0.116*** (29.08)
0.0588*** (5.09)
0.121*** (4.52)
No. of obs.: R2:
39
0.405 0.066039 0.12739 0.017839
Source: Author’s calculation
Note: * p < 0.1, ** p < 0.05, *** p < 0.01
IV: Results for the Czech banking sector – all size groups Czech
sector Large group Medium−sized group Small group
(1) NEG
(2) NET
(1) NEG
(1) POS
(2) NEG
(3) TOT
TA −1.291***
(−3.97)
2.396** (2.55)
−1.011** (−2.65)
0.208** (2.28)
LOAN 0.803**(2.74) −1.826*(−2.03) 0.513*(1.98) 0.152**(2.32) 0.350**(2.39)
DEP 0.471*(2.12)
CONS 0.123***
(5.09)
−0.00967 (−0.13)
0.110*** (4.25)
0.222*** (4.94)
0.0761** (2.31)
0.0869* (2.01)
No. of obs.: R2:
13 0.396
13 0.366
13 0.338
13 0.316
13 0.260
13 0.551 Source: Author’s calculation
and moreover with the highest outflow, and thus it reflected the highest negative net change.
In the last researched group of small banks (Tab. III), two forms were reflected – creation and outflow. The value of total assets had positive influence on creation as well as on outflow, indicating that in case of higher value, the liquidity is created as well as used. It seems, based on the higher coefficient for liquidity creation, that the final result should indicate creation of liquidity; however, positive net change for the value of total assets was not statistically significant. Similarly for the other groups, the value of loans was reflected with negative influence on liquidity creation. The group with the lowest creation and the highest outflow was again the group of the Slovak sector. Vice‑versa, the Czech small group was the group with the highest creation and the lowest outflow.
It is apparent from the Tab. IV, V and VI that the research factors had influence only on some of the groups.
In case of the Slovenian sector, the insignificance of factors can be partially explained by the substantial representation of the state ownership, when liquidity of a bank can be, in many cases, influenced by political decisions. However, the significant fact is that state‑owned banks are represented not only in the group of small banks, where the factors were not reflected, but through the whole sector. Another explanation, which may figure also in the Slovak sector, are regulatory set limits and liquidity indicators (see the Regulation No. 38/14, and No. 18/2008), which suppress individual characteristics, strategies and sensitivity to the given factors. In the Czech sector, there are no liquidity indicators given by a national authority. From the results in the Tab. IV, V and VI it is also seen that the large groups of banks, which are the main feature in influencing the development of the whole sector, were always significant.
V: Results for the Slovak banking sector – all size groups Slovak
sector Large group (1)
POS
(2) NEG
(3) NET TA
LOAN −0.492***
(−5.13)
−0.506** (−2.83)
DEP 1.272***
(8.32)
−0.709** (−2.55)
1.978*** (5.33)
CONS 0.109***(3.22) 0.254***(3.58) −0.142(−1.52)
No. of obs.: R2:
13
0.778 0.20813 0.57813
Source: Author’s calculation
Note: * p < 0.1, ** p < 0.05, *** p < 0.01
VI: Results for the Slovenian banking sector – all size groups Slovenian
sector Large group Medium‑sized group (1)
POS
(2) NET
(1) NEG
TA 2.271***(4.69) 0.486***(3.35)
LOAN −1.488***
(−3.60)
DEP 0.942***(3.16) 0.618**(3.02)
CONS 0.0312(0.87) −0.0959(−1.35) 0.0809***(3.84)
No. of obs.: R2:
13
0.808 0.41713 0.60313
Source: Author’s calculation
CONCLUSION
The objective of the article was to determine possible relationships between variables representing size (the total assets, loans and deposits) and various forms of liquidity (creation, outflow, net changes and the total reallocation). The researched factors had alternating representation in all the forms and for all the studied groups. The value of loans had the multiple representation, which was reflected almost in every studied unit with negative influence on creation and positive influence on outflow. Some of the factors were reflected only in some group sizes or forms. The factors had either contradictory direction of influence on creation and outflow, or the same direction (see the Tab. III, for TA), where higher influence on one of the forms was deciding about net change. The inclusion of more forms of liquidity offered the more complex view on influence of the chosen factors. In case of work only with liquidity creation, influence of the factors would not be uncovered at all. For example, the significant influence on liquidity outflow in the large Czech group (Tab. IV) or representation of factors in other groups for other forms than liquidity creation.
The results also indicated diverse influence of factors on different size groups of banks, similarly as on the same size of groups in different sectors. These differences reflect specific characteristics of researched groups and sectors, which support the need of higher flexibility and individuality in setting up regulatory measures. National and supranational regulatory measures (e.g. Basel) should take into account such specific characteristics. Indicators and other regulatory measures could be adapted according to the size and type of the units to increase the effectiveness of the regulation and to reduce the possible disruption of stability.
REFERENCES
AHMED, N., AHMED, Z. and NAQVI, I. H. 2011. Liquidity Risk and Islamic Banks: Evidence from Pakistan. Interdisciplinary Journal of Research in Business, 1(9):99–102.
ASPACHS, O., NIER, E., and TIESSET, M. 2005.
Liquidity, Banking Regulation and the Macroeconomy. Evidence on bank liquidity holdings from a panel of UK‑resident banks. Bank of England Working Paper. BERGER, A. N. and BOUWMAN, C. H. S. 2009. Bank
Liquidity Creation. The review of financial studies, 22(9): 3780–3837.
BANK FOR INTERNATIONAL SETTLEMENTS (BIS). 2013. Global systematically important banks: updated assessment methodology and the higher loss absorbing requirement. Available at: http://www.bis. org/publ/bcbs255.pdf. [Accessed 2016, January 28].
BONFIM, D. and KIM, M. 2012. Liquidity risk
banking: Is there herding? European Banking Center Discussion Paper, No. 2012–024, 1–31.
BUNDA, I. and DESQUILBET, J. B. 2008. The bank liquidity smile across exchange rate regimes. International Economic Journal, 22(3): 361–386. CUCINELLI, D. 2013. The Determinants of Bank
Liquidity Risk within the Context of Euro Area. Interdisciplinary Journal of Research in Business, 2(10): 51–64.
FUNGÁČOVÁ, Z. WEILL, L and ZHOU, M. 2010. Bank Capital, Liquidity Creation and Deposit Insurance. In: BOFIT Discussion Paper, no. 17. Bank of Finland.
HACKETHAL, A., RAUCH, C., STEFFEN, S., et al. 2010. Determinants of Bank Liquidity Creation. Social Science Research Network.
HORVATH, R., SEIDLER, J. and WEILL, L. 2012. Bank capital and liquidity creation. Granger‑ Causality evidence. In: Working paper series – European Central Bank, no. 1947.
KOMÁRKOVÁ, Z., HAUSENBLAT, V. and FRAIT, J. 2011/2012. How to identify systematically important financial institutions. Financial Stability Report, Czech National Bank.
LAEVEN, L., RATNOVSKI, L. and TONG, H. 2014. Bank Size and Systemic Risk. IMF Staff discussion note, May 2014.
LAKŠTUTIENE, A. and KRUŠINSKAS, R. 2010. Lithuanian banks liquidity creation in 2000–2008. Economics & Management (Ekonomika ir Vadyba), 2010(15): 986–991.
LAŠTŮVKOVÁ, J. 2014. Liquidity management strategies in the Czech banking sector. In: MENDELU Working Papers in Business and Economics 47/2014. Brno: Mendel University in Brno.
LAŠTŮVKOVÁ, J. 2015. Determinants of the Slovak bank liquidity flows. In: MENDELU Working Papers in Business and Economics 51/2015. Brno: Mendel University in Brno.
LEI, A. C. H. and SONG, Z. 2013. Liquidity creation and bank capital structure in China. Global Financial Journal, 24: 188–202.
LU, J. and HU, X. 2014. Novel three‑bank model for measuring the systemic importance of commercial banks. Economic Modelling, 43: 238–246.
PANA, E., PARK, J. and QUERY, T. 2010. The impact of bank mergers on liquidity creation. Journal of Risk Management in Financial Institutions, 4(1): 74–96. NÁRODNÁ BANKA SLOVENSKA. 2008. Regulation
NBS no. 18 of 28 October 2008, on the liquidity of banks and branches of foreign banks and procedures for the management of liquidity risk of banks and branches of foreign banks‘ liquidity [in Slovak: Opatrenie NBS č. 18 z 28. októbra 2008 o likvidite bánk a pobočiek zahraničných bánk a postupe riadenia rizika likvidity bánk a likvidity pobočiek zahraničných bánk].
adequate liquidity position of banks and savings banks. Official Gazette of the Republic of Slovenia, No. 38/14 of 30 May 2014.
TARASHEV, N., BORIO, C. and TSATSARONIS, K. 2010. Attributing systemic risk to individual institutions. BIS WP no. 308.
TRENCA, L., PETRIA, N. and MUTU, et al. 2012. Evaluating the liquidity determinants in the central and eastern European banking system. Finance Challenges of the Future, 12(14).
VALLA, N., SAES‑ESCORBIAC, B. and TIESSET, M. 2006. Bank liquidity and financial stability. Financial Stability Review, 9: 89–104.
VODOVÁ, P. 2011a. Liquidity of Czech Commercial Banks and its Determinants. International Journal of mathematical models and methods in applied sciences, 5(6): 1060–1067.
VODOVÁ, P. 2011b. Determinants of commercial banks’ liquidity in Slovakia. In: Lessons Learned from the Financial Crisis. Proceedings of 13th International Conference on Finance and Banking. Silesian
University, 12‑13 October. Karviná: Silesian University, School of Business Administration, 740–748.
VODOVÁ, P. 2012. Determinants of commercial banks’ liquidity in Poland. In: RAMÍK, J. and STAVÁREK, D. (eds.). Proceedings of 30th International Conference Mathematical Methods in Economics. Silesian University, 11‑13 September. Karviná: Silesian University, School of Business Administration, 962–968.
VODOVÁ, P. 2013. Determinants of commercial banks’ liquidity in Hungary. [Online]. Available at: http:// www.slu.cz/opf/cz/informace/acta‑academica‑ karviniensia/casopisy‑aak/aak‑rocnik‑2013/docs‑ 1‑2013/Vodova.pdf. [Accessed 2016, January 28].