ANALYSIS Of THE DEVELOpMENT Of SELECTED
INDICATORS Of THE DEMOGRApHIC STATICS AND
DYNAMICS OF THE CZECH REPUBLIC IN 1993–2003
M. Palát, E. Maca
Received: June 30, 2005
Abstract
PALáT, M., MACA, E.: Analysis of the development of selected indicators of the demographic statics
and dynamics of the Czech Republic in 1993–2003. Acta univ. agric. et silvic. Mendel. Brun., 2005,
LIII, No. 6, pp. 129–144
The paper is aimed at the presentation of findings obtained in the study of the average level, variabili- ty, dynamics, developmental trends and a short-time point extrapolation prediction of the population in the Czech Republic and their structure according to gender and scale of the economic generation. In addition to the exact evaluation of the selected indicators, the analysis is also aimed to general rates of natural reproduction of population and their movement in the defined territorial unit and time interval 1993–2003. There are also presented relative rates of marriages, divorces, live births and deaths to mid--year population.
population, sex and economic generation, movement, dynamics, trend, short-time prediction, Czech Republic
Ročník LIII 13 Číslo 6, 2005
129 The period that started in the Czech Republic at the turn of the 80’s and 90’s is the period of transforma-tion from the central planned economy to the market economy and is very complicated from both social and economic aspects. The conception of the presen-ted study orienpresen-ted to the quantification of changes in the development of natality, mortality, marriages and divorces in the Czech Republic in the period 1993 to 2003. Within the reference period, time series were also analysed of the population number structure ac-cording to main age groups, live births and indicator of the death rate (mortality). The changes in the na-tality rate, morna-tality and age structure of the popu-lations as quantitative and qualitative changes of the characteristics of the population reproduction beco-mes more and more a social process and not only bio- logical process.
Theoretical aspects and interpretation of the results of analytical activities in the sphere of the study of
de-mographic statics and dynamics have been dealt with by the number of authors. The following papers can be considered to be fundamental from the aspect of the conception of examination proper: ROUBÍČEK (1996, 1997), Dufek (1999), KOBZÍKOVá (2000), SRB (2002), PALáT and MACA (2004, 2005).
MATERIAL A METHODS
and trends of assessed phenomena including their short-term extrapolation prediction. Basic indices (ib) are calculated by the expression
qk q1 q2 qk–1 qk
— = — · —, …, · —— ·——
q0 q0 q0 qk–2 qk–1
the chain indices (ich) by the expression
qk
—
qk q0
—— = ——–.
qk–1 qk–1
——
q0
For the calculation of mean growth and following characteristics of selected indicators was used for-mula
qk
k = n–1 —.
q0
Analysis of the trend of assessed time series is based on the application of models of developmental tendencies of the following type:
y' = ayt + byt·t (1)
y' = ayt + byt·t + cyt·t2 (2)
y' = ayt·ebyt·t (3)
y' = ayt + byt·lnt (4)
y' = ayt·tbyt (5)
1
y' = ayt + byt· — (6)
t
Informative abilities and accuracy of applied analy-tical functions were tested by means of correlation in-dices Iyt. The statistical significance of correlation in-dices was tested on the significance level P = 0.05 and P = 0.01. Determination indices Iyt2 were used for
veri-fication of the indicators developmental trend models and their short-term point extrapolation prediction.
Methodical procedures of processing the factual data of analysed time series are based on the methods of descriptive statistics presented in papers of CY -HELSKý, KAŇOKOVá and NOVáK (1979), BA-KYTOVá, HáTLE, NOVáK and URGON (1986), KOVAČKA and KONTŠEKOVá (1962), SEGER, HINDLS and HRONOVá (1998) and MINAřÍK (2000).
RESULTS AND DISCUSSION
The population development which occurred in the assessed territorial unit and defined time interval con-firmed and intensified marked qualitative changes in the demographic behaviour of population appearing after the transition of centrally directed economy to market economy after 1989. The findings obtained in the study of the average level, variability, dynamics, developmental trends and a short-time point extrapo-lation prediction of the popuextrapo-lation in the Czech Re-public and their structure according to gender and scale of the economic generation. Characteristics of selected indicators of population and its movement of the Czech Republic in the period 1993–2003 are presented in Tab. I and in graphical form in Figs. 1 and 2.
I: Characteristics of selected indicators of population and its movement in the Czech Republic in the period
1993–2003
Indicator Measured unit Variation domain 1993–2003 Mean in
y
Variation coefficient
Vy (%)
ymin ymax
Mid-year population
thousands of person
10 201
2002 10 336 1994 10 281.2 0.49
of this
males 4 965 2002 5 021 1994 5 000.5 0.41
females 5 233 2003 5 315 1994 5 280.7 0.58
Mid-year population at an age
0–14 1 605 2002 2 037 1993 1 784.4 8.66
15–64 6 957 1993 7 211 2003 7 103.4 1.11
Marriages
number
48 943
2003 66 033 1993 55 368 7.92 Divorces 23 657 1999 33 113 1996 30 888 8.49
Live births 89 471 1999 121 025 1993 95 719 10.12
Deaths 107 775 2001 118 185 1993 112 234 3.51
Live expectancy
males
years
69.2
1993 2001 72.1 2002
70.9 1.48
females 199376.4 2002 78.5 2003
77.1 3.00
Live firths per 1000 population
‰
8.7
1999 199311.7 9.31 9.80
Deaths per 1000 population
10.5
2001 1993 11.4 1994 1995
10.92 3.20
Marriages per 1000
population 20034.8 19936.4 5.38 7.70
Divorces per 1000
population 19992.30 20033.22 3.00 8.56
Divorces per 100
marriages % 199944.2 200367.1 55.79 12.01
Values of percentage proportions of variation ranges and arithmetic means (—R
y ·100) arranged in ascending
order as simple rates of variability and characteristics of the informative potential of indicators of the ave-rage level of analysed events reached 1.20% in the mid-year population of males; 1.31% in the mid-year population in total; 1.55% in females of the mid-year population; 2.72% in the live expectancy of females; 3.57% in the mid-year number of population at an age of 15–64 years; 4.09 % in the live expectancy of ma-les; 6.10% in the mid-year number of population at an age 65 and over; 8.24 % in the number of marriages per 1000 inhabitants; 9.27% in the number of dead; 24.21% in the number of the mid-year population at an age under 15; 29.79% in the number of marriages per 1000 inhabitants; 30.61% in the number of divor-ces; 30.67% in the number of divorces per 1000 inha-bitants; 30.87% in the number of marriages; 32.22% in the number of life-born children per 1000 inhabi-tants; 32.96% in the number of life-born children and 41.04% in the number of divorces per 100 marriages.
Variation coefficients (Vy) as values of percentage
proportions of standard deviations (sy) and
arithme-tic means (y) arranged in ascending order as suitable
rates of variability of indicators of analysed events reached 0.41% in the mid-year population of males; 0.49% in the year population; 0.58% in the mid--year population of females; 1.11% in the midmid--year population at an age of 15–64 years; 1.48% in the live expectancy of males; 2.15% in the mid-year popula-tion at an age over 65 and over; 3.00 % in the live ex-pectancy of females; 3.51 % in the number of dead; 3.20% in the number of dead per 1000 population; 7.70 % in the number of marriages per 1000 popu-lation; 7.92% in the number of marriages; 8.49% in the number of divorces; 8.56% in the number of di-vorces per 1000 population; 8.66% in the number of the mid-year population at an age under 15; 9.80% in the number of life-born children per 1000 inhabi-tants; 10.12 % in the number of life-born children and 12,01% in the number of divorces per 100 marriages.
of indicators under consideration in the assessed refe-rence period.
At the mutual comparison of the ascending order of variability of studied events by means of applied me-thodical procedures a congruence was demonstrated in 47.06% of assessed demographic indicators: mid--year population of the male gender; total midmid--year population; mid-year population of the female
gen-der, number of divorces, number of divorces per 1000 inhabitants, number of life-born children per 1000 in-habitants, number of life-born children and number of divorces per 100 marriages.
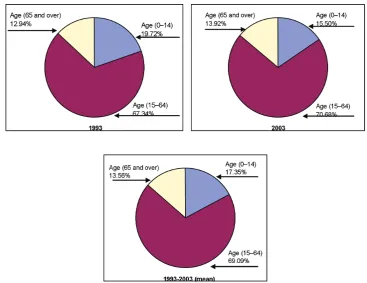
Figure 1 depicts the structure of a mid-year popula-tion according to a gender in selected reference peri-ods of the assessed territorial unit.
1: Demographic structure of mid-year population of the Czech Republic in the period 1993–2003
Demonstrated indistinctive changes in the percen-tage proportion of genders in the total number of mid--year population in the assessed reference period on the one hand document a prevailing female popula-tion over males on the other hand.
An objective evaluation of the demographic structure of population according to the pre-produc-tive, productive and post-productive age enables its numerical and graphic expression in Fig. 2.
Evaluating relative and absolute changes in the de-velopment of a population with differentiation
accor-ding to economic generations it is possible to note an enormous decrease (by 4.22 percent points; 466 thou-sand persons) in a population under 15 years in 2003 as against 1993 and a marked increase (by 3.34 per-cent points; 254 thousand persons) in a population at an age of 15 to 64 years and (by 0.98 percent points; 83 thousand persons) in a population over 65 ears.
A more detailed view of the dynamics of the mid--year population according to the scale of economic generations and selected years of the examined refe-rence period is presented in Tab. II.
II: Dynamics of the mid-year population according to the scale of
economic generations and selected years of the examined reference period (in thousands of persons)
Indicator Year
Mid-year population 1990 1993 1997 2003
at an age
pre-productive 2 223 2 037 1 818 1 571 productive 6 844 6 967 7 089 7 211 post-productive 1 296 1 337 1 397 1 420
Empirical data make possible the description of
dy-namics of time series of indicators of the population movement in selected years of the transformation pe-riod of Czech economy (Tab. III).
III: Dynamics of time series of indicators of the population movement in selected years of the transformation period of Czech economy
Indicator Year
1990 1993 1997 2003 Marriages 90 953 66 033 57 804 48 943 Divorces 32 055 30 227 32 465 32 824 Live births 130 564 121 025 90 657 93 685 Deaths 129 166 118 185 112 744 111 288 Natural increase/decrease 1 398 2 840 –22 087 –17 603 Migration increase/decrease 624 5 476 12 075 25 789
Thus, it is possible to observe a decrease in the number of marriages in 2003 as against 1990 by 46.2%, in the number of life-born children by 28.3% and in the number of dead by 13.9%.
On the other hand, an increase by 2.4% occurred in the number of divorces as against the basic period in the final year. At the mutual comparison of the natural
IV: Population dynamics of the Czech Republic and its movement in the period 1993– 2003
Year Mid-year population
of this
males females thousands of person
1993 10 331 5 017 5 314
Index (%) ib ich ib ich ib ich
1994 100.04 100.08 100.02
1995 100.00 99.95 100.06 99.98 99.94 99.92 1996 99.84 99.84 99.94 99.88 99.75 99.81 1997 99.74 99.89 99.88 99.94 99.60 99.85 1998 99.65 99.91 99.82 99.94 99.49 99.89 1999 99.53 99.88 99.72 99.90 99.36 99.87 2000 99.43 99.89 99.64 99.92 99.23 99.87 2001 98.96 99.53 99.24 99.60 98.70 99.47 2002 98.74 99.77 98.96 99.72 98.53 99.83 2003 98.75 100.00 99.04 100.08 98.47 99.94
Year
Mid-year population at an age
0–14 15–65 65 and over
thousands of person
1993 2 037 6 957 1 337
Index (%) ib ich ib ich ib ich
1994 97.15 100.70 101.05
1995 94.30 97.07 101.25 100.54 102.17 101.11 1996 91.65 97.19 101.57 100.31 103.36 101.17 1997 89.25 97.37 101.90 100.32 104.49 101.08 1998 87.17 97.52 102.26 100.35 105.31 100.78 1999 84.88 97.52 102.60 100.34 105.91 100.57 2000 82.72 97.45 102.99 100.38 106.36 100.42 2001 80.66 97.51 103.03 100.04 105.68 99.36 2002 78.79 98.69 103.20 100.17 105.91 100.21 2003 77.12 97.88 103.65 100.43 106.21 100.28 Findings obtained in the statistical examination of
the dynamics of index series of assessed events can be considered to be significant from the viewpoint of main intentions of the study of selected demogra-phic indicators of population, its structure according
Year Marriages Divorces Live births
1993 66 033 30 227 121 025
Index (%) ib ich ib ich ib ich
1994 88.50 102.35 88.06
1995 83.22 94.04 103.00 100.63 79.40 90.16 1996 81.62 98.07 109.54 106.35 74.73 94.12 1997 87.54 107.25 107.40 98.04 74.91 100.23 1998 83.33 95.20 107.07 99.68 74.81 99.86 1999 81.05 97.27 78.26 73.10 73.93 98.82 2000 83.78 103.36 98.27 125.56 75.12 101.61 2001 79.31 94.67 104.49 106.33 74.95 99.78 2002 79.86 100.68 105.06 100.54 76.66 102.28 2003 74.12 92.81 108.59 103.36 77.41 100.97
Year Deaths Live expectancy (years) males females
1993 118 185 69.2 76.4
Index (%) ib ich ib ich ib ich
1994 99.31 100.43 100.26
1995 99.77 100.46 101.16 100.72 100.65 100.39 1996 95.43 95.65 101.73 100.57 101.18 100.52 1997 95.40 99.97 101.88 100.14 101.44 100.26 1998 92.67 97.15 102.74 100.85 102.22 100.77 1999 92.88 100.22 103.18 100.42 102.22 100.00 2000 92.23 99.30 103.61 100.42 102.62 100.38 2001 91.17 98.86 104.19 100.55 102.62 100.00 2002 91.59 100.45 104.19 100.00 102.75 100.13 2003 94.16 102.81 104.05 99.86 102.75 100.00
Year Marriages Divorces Divorces per 100 mar-riages (%) per 1000 population (‰)
1993 6.4 2.93 45.8
Index (%) ib ich ib ich ib ich
1994 89.06 102.04 115.50
Year Live births Deaths per 1000 population (‰)
1993 11.7 11.4
Index (%) ib ich ib ich
1994 88.03 100.00
1995 79.49 90.29 100.00 100.00 1996 75.21 94.62 95.61 95.61 1997 75.21 100.00 95.61 100.00 1998 75.21 100.00 92.98 97.25 1999 74.36 98.86 93.86 100.94 2000 75.21 101.15 92.98 99.06 2001 76.07 101.14 92.10 99.06 2002 77.78 102.24 92.98 100.95 2003 78.63 101.09 95.61 102.83 ib – basic indices, ich – chain indices
In the interpretation of series of indices with a con-stant basis (series of basic indices) of studied events according to the ascending order, their relative incre-ase reached 2.75% in the mid-year life span of fema-les until 2003 as against 1993, in a productive popula-tion 3.65%, in the mid-year life span of males 4.05%, in a post-productive population 6.21%, in the number of divorces 8.59%, in the number of divorces per 100 inhabitants 9.90%, in the number of divorces per 100 marriages 46.51%.
A descending order in the decrease of studied in-dices in the final year 2003 as against 1993 is quan-tified by the following values: 25.68% in the number of marriages, –25.00% in the number of marriages per 100 inhabitants of mid-year population, –22.88% in a pre-productive population, –22.59% in the number of born children, –21.37% in the number of life--born children per 1000 inhabitants of mid-year popu-lation, –5.84% in the number of dead, –4.39% in the number of dead per 1000 inhabitants of mid-year po-pulation, –1.53% in the mid-year population of fema-les, –1.25% in the mid-year population and –0.96% in the mid-year population of males.
The highest decrease between particular years amounting to –11.97% occurred in the number of life--born children per 1000 inhabitants in 1994, – 11.94% in the number of life-born children, –11.50% in the number of marriages and –10.94% in the number of marriages per 1000 inhabitants. In the subsequent year 1995, a decrease between particular years of the mid-year population of the pre-productive age per-sons reached –2.93%. A decrease in the number of dead persons per 1000 inhabitants between particular
years amounted to –4.39 % and –4.35% in the number of dead persons. The decrease occurred also in 2001, viz by –0.40% in males of the mid-year population, by –0.47% in the total number of inhabitants of mid--year population and by –0.53% in the number of fe-males of mid-year population.
The highest increase between particular years by 9.70% occurred in the productive population in 1994, in the post-productive population by 1.17% in 1996, in the number of divorces by 25.56% in 1997, in the mid-year population of males and females by 0.85 and 0.77%, respectively, in 1998. In the number of di-vorces per 1000 inhabitants and didi-vorces correspon-ding to 100 marriages, the highest increase between particular years was reached in 2000 (25.65% or 21.49%).
de-ath –0.60%, in the number of live-born –2.38%, in the number of life-born –2.53%, in the pre-productive po-pulation –2.57%, in the number of marriages –2.95% and in the number of marriages per 1000 inhabitants –8.28%.
Analytical functions where time “t” serves as an explanatory (exogenous) variable are a tool of the description of developmental tendencies of analysed time series. Results of this stage of analysis are
pre-sented in Tab. V. In addition to parameters of applied models of a linear, quadratic, exponential, logarith-mic, power and inverse type they also present the de-gree of dependence of assessed endogenous variables on a time variable and the informative potential of ap-plied models including their statistical significance on selected levels. Results of this stage of processing and evaluating factual data are documented in Tab. VI.
V: Parameters of models of developmental trends of selected population indicators and its movement in the
Czech Republic in the period 1993–2003
Indicator f Model parameters Correlation index I yt
ayt byt cyt
Mid-year population (thousands of person)
1 10 369.2545 –14.6636 - 0.9559++
2 10 336.1333 0.6231 –1.2739 0.9569++
3 10 369.6050 –0.0014 - 0.9556++
4 10 371.8896 –54.9516 - 0.8341++
5 10 372.2270 0.0055 - 0.8334++
6 10 248.7258 118.5531 - 0.6291+
of this
males
1 5 034.6364 –5.68182 - 0.9256++
2 5 017.1515 2.38811 –0.6725 0.9751++
3 5 034.7222 –0.00114 - 0.9253++
4 5 034.6156 –21.41270 - 0.7837++
5 5 034.7222 –0.00428 - 0.7832++
6 4 988.7935 42.80664 - 0.5677
females
1 5 349.1636 –9.89090 - 0.7165+
2 5 318.9819 1.76500 –0.60140 0.9749++
3 5 334.8620 –0.00170 - 0.9705++
4 5 337.2739 –35.53890 - 0.8630++
5 5 337.5166 –0.00670 - 0.8622++
6 5 259.9322 75.74650 - 0.6665+
Mid-year population at
an age: 1 2 063.2545 –46.48180 - 0.9970
++
2 2 096.4364 –61.79650 –1.27620 0.9973 ++
3 2 078.6536 –0.02600 - 0.9991++
0–14 4 2 104.2643 –201.0539 - 0.9688++
5 2 122.5936 –0.11200 - 0.9599++
6 1 653.4473 476,8669 - 0. 8327++
15–64
1 6 962.4545 23.5000 - 0.9837++
2 6 927.7575 39.5140 –1.33450 0.9862++
3 6 963.2272 0.0033 - 0.9829++
4 6 936.6593 104.8289 - 0. 9858++
5 6 937.6751 0.01480 - 0.9866++
65 and over
1 1 343.5454 8.3181 - 0.9187++
2 1 311.9394 22.9056 –1.2156 0. 9983++
3 1 343.8100 0.0060 - 0.9173++
4 1 330.9660 39.2733 - 0.9745++
5 1 331.5209 0.0284 - 0.9751++
6 1 420.9222 –100.0521 - 0. 8996++
Marriages number
1 61 774.9454 –1 067.81 - 0.8079++
2 64 103.0364 –2 142.31 89.5419 0. 8297++
3 61 844.2739 –0.018884 - 0.8200++
4 63 621.4388 –5 187.13 - 0.8817++
5 77 118.2342 –0.341510 - 0.3555 6 51 347.4773 14 645.2 - 0.9020++
Divorces number
1 30 779.84 18.072727 - 0.0228
2 32 403.96 –731.52168 62.466200 0.2218
3 30 729.79 0.0002362 - 0.0084
4 30 827.15 38.3578449 - 0.0109
5 30 829.17 –0.0011385 - 0.0091
6 30 992.57 –379.92032 - 0.0391
Live births number
1 107 079.24 –1 893.42 - 0.6481+
2 125 727.42 10 500.271 717.237762 0.9635++
3 106 367.05 –0.018277 - 0.6492+
4 110 661.40 –14 019.3 - 0.3754
5 112 989.09 –0.1068800 - 0.8529++
6 86 250.79 34 487.276 - 0.9610++
Deaths number
1 118 344.47 –1 018.34 - 0.8568++
2 122 633.77 –2 298.01 164.973193 0.9404++
3 111 239.40 –0.0245825 - 0.1552 4 111 079.24 –5 071.480 - 0.1232 5 122 116.74 –0.1513324 - 0.2147 6 109 048.08 11 606.454 - 0.7950++
Live expectancy (years)
males
1 69.0564 0.3073 - 0.9779++
2 68.5830 0.5235 –0.0177 0.9915++
3 69.0577 0.0044 - 0.9787++
4 68.7375 1.3648 - 0.9656++
5 68.7561 0.0193 - 0.9668++
6 71.8033 0.2571 - 0.8351++
females
1 76.3145 0.2309 - 0.9633++
2 75.8054 0.4659 –0.0196 0.9900++
3 76.3206 0.0030 - 0.9628++
4 76.0574 1.0323 - 0.9676++
5 76.0664 0.0133 - 0.9681++
Live births per 1000 population
‰
1 10.3236 –0.1691 - 0.6144+
2 12.1536 –1.0196 0.0712 0.9386++
3 10.2518 –0.0167 - 0.6120
4 7.0433 5.9491 - 0.1868
5 10.8844 –0.1007 - 0.8277++
6 8.4269 3.2134 - 0.9506++
Deaths per 1000 population
1 11.4018 –0.0836 - 0.7941++
2 11.8624 –0.2962 0.0177 0.9227++
3 11.4035 –0.0076 - 0.7930++
4 11.5375 –0.4006 - 0.8547++
5 11.5444 –0.0364 - 0.8528++
6 10.6265 0.9961 - 0.7700++
Marriages per 1000 population
‰
1 5.9600 –0.0964 - 0.7714++
2 6.2388 –0.2250 0.0107 0.8078++
3 6.0721 –0.0194 - 0.8479++
4 6.1458 –0.4802 - 0.8636++
5 6.1508 –0.0855 - 0.8607++
6 5.0020 1.3834 - 0.9016++
Divorces per 1000 population
1 2.9665454 0.0061818 - 0.0797
2 3.1392727 –0.0735384 –0.006643 0.2521
3 2.9625017 0.0016678 - 0.0587
4 2.9716845 0.0200814 - 0.0582
5 2.9724396 0.0041884 - 0.0331
6 3.0223026 –0.0679926 - 0.0713
Divorces per 100
Marriages %
1 49.6218182 1.0827273 - 0.5324
2 51.8309090 0.0631468 0.084965 0.5451
3 49.6926079 0.0191187 - 0.5083
4 48.2748555 4.9294407 - 0.5446
5 48.3797352 0.0889234 - 0.5311
6 59.9155764 –13.8321313 - 0.5037 Type of the function: (1) – linear, (2) – quadratic, (3) – exponential, (4) – logarithmic, (5) – power, (6) – in-verse
The short-term prediction of studied events is also based on trend functions as a tool of the description of the development of analysed time series. Results of the extrapolation point projection for a defined time
period together with the quantification of a relative growth of the assessed demographic indicators of po-pulation and its movement are given in Tab. VII and Fig. 3.
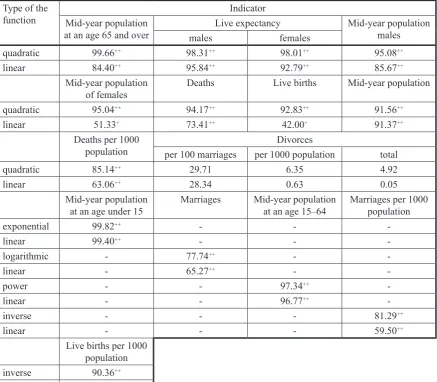
VI: Selected indicators of demographic statics and dynamics with used types of functions
Type of the
function Mid-year population Indicator
at an age 65 and over malesLive expectancyfemales Mid-year population males quadratic 99.66++ 98.31++ 98.01++ 95.08++
linear 84.40++ 95.84++ 92.79++ 85.67++
Mid-year population
of females Deaths Live births Mid-year population quadratic 95.04++ 94.17++ 92.83++ 91.56++
linear 51.33+ 73.41++ 42.00+ 91.37++
Deaths per 1000
population per 100 marriages per 1000 populationDivorces total
quadratic 85.14++ 29.71 6.35 4.92
linear 63.06++ 28.34 0.63 0.05
Mid-year population
at an age under 15 Marriages Mid-year population at an age 15–64 Marriages per 1000 population
exponential 99.82++ - -
-linear 99.40++ - -
-logarithmic - 77.74++ -
-linear - 65.27++ -
-power - - 97.34++
-linear - - 96.77++
-inverse - - - 81.29++
linear - - - 59.50++
Live births per 1000 population inverse 90.36++
VII: Mean year increment/decrement of population indicators of the Czech Republic in the period 1993–2003 and their short-time point extrapolation prediction
Indicator Relative growth (%) Prediction for year 2005 Reality in the year 1990 2000 Mid-year population (thousands of person) –0.14 10 161 10 363 10 272
of this males –0.00 4 934 5 037 4 999
females –0.19 5 227 5 326 5 273
Mid-year population at an age
0–14 –2.99 1 509 2 223 1 685
15–64 0.32 7 248 6 844 7 165
65 and more 0.52 1 404 1 296 1 422 Marriages
number
–2.13 52 474 90 953 55 321
Divorces 0.06 33 451 32 055 29 704
Live births –2.20 110 437 130 564 90 910
Deaths –0.95 111 540 129 166 112 234
Live expectancy males years 0.42 73.05 67.6 71.7
females 0.29 79.32 75.4 78.4
Live births per 1000 population
‰
–1.99 8.67 12.6 8.8
Deaths per 1000 population –0.79 10.51 12.5 10.6 Marriages per 1000 population –1.97 5.10 8.8 5.4 Divorces per 1000 population 0.20 3.31 3.09 2.89 Divorces per 100 marriages % 1.76 67.01 35.2 53.77
Based on the results of a short-term extrapolation point prediction of the level of evaluated demogra-phic indicators of population and its structure accor-ding to sex, international scale of economic generati-ons including the movement of population for 2005 included in Tab. IV and its comparison with an ave-rage level achieved in the interval 1993 to 2003, it is possible to expect an increase in the mid-year number of the post-productive population by 0.76%, mid-year life span of females by 2.88% and males by 3.03%, divorces by 8.30%, relative rate of divorces (a ratio of the annual number of divorces to mid-year popula-tion in per mille, ie per 1000 inhabitants) by 10.33%,
SUMMARY
The developing transformation process aimed at market economy and started in the Czech Republic since 1990 through fundamental political changes is a complicated period not only from the economic point of view but also from social viewpoints which affect the rate of population reproduction through their economic and social aspects. In evaluating the demographic statics dealing with problems of population from the viewpoint of its number in the reference period 1993– 2003, its marked stability has been demonstrated (Vy = 0.49%) at the average level of 10 281.2 thousand inhabitants with the average yearly decrease of –0.14% for the given time interval.
Comparing presented characteristics with the previous decade it is not possible to omit their differences in both reference periods. In addition to the decrease in the average number of population by 57.5 thousand in-habitants as against the basic period (–0.56%) it is possible to observe decrease in its variability by 0.31%. A demonstrated one-percent proportion in the population increase by migration in the period 1993–2003 (78 950 persons) is also significant. Based on the extrapolation point prediction of the mid-year population in 2005 amounting to 10 161 thousand persons and its comparison with an average level achieved in the period 1993– 2003 it is possible to conclude a decrease of the given indicator by 1.17%.
Studying the demographic structure based on classification by age and gender as the result of demographic processes occurring in the population for a number of years and at the same time to a certain extent predeter-mining the population development in future years, the proportion of pre-productive population amounting to 17.35% with an average annual decrease by –2.99%, productive population amounting to 69.09% with an ave-rage increase by 0.32% and post-productive population amounting to 13.56% with an aveave-rage annual increase by 0.58% appeared to be a total reference interval. According to the point extrapolation prediction, the expec-ted proportion of pre-productive population reached 14.85% (of –2.5% point), that of productive population 71.33% (of +2.24% point) and that of post-productive population 13.82% (of +0.26% point). In the differenti-ation of mid-year populdifferenti-ation according to gender the proportion of males reached 48.64% and that of females 51.36 % in the period under study. Predicted differences amounting to +0.04% in the same order can be con-sidered to be negligible.
In basic indices of investigated indicators, their relative increase reached a value of 2.75% in the mid-year life span of females until 2003 as against 1993, in the productive population 3.65%, in the life expectancy of
3: Relative growth of selected demographic indicators of population in
males 4.05 %, in the post-productive population 6.21%, in the number of divorces 8.59%, in the number of di-vorces per 1000 inhabitants 9.90% and in the number of didi-vorces per 100 marriages 46.51%. The descending order of decrease is presented by the following values: –25.68% in the number of marriages, –25.00% in the number of marriages per 100 inhabitants of mid-year population, –22.88% in the pre-productive population, – 22.59% in the number of life-born children, –21.37% in the number of life-born children per 1000 inhabitants, –5.84% in the number of dead, –4.39% in the number of dead per 100 inhabitants, –1.53% in the mid-year po-pulation of females, –1.25% in the mid-year popo-pulation and –0.96% in the mid-year popo-pulation of males.
Based on the short-term point extrapolation prediction of the level of investigated demographic indicators of the population and its structure according to gender and the scale of economic generations including the mo-vement of population for 2005, it is possible to expect an increase in the mid-year post-productive population by 0.76% as against the average of 1993 to 2003, mid-year of females by 2.88% and males by 3.03%, number of divorces by 8.30%, number of divorces per 1000 inhabitants by 10.33% and number of divorces per 100 marriages by 20.11%. On the other hand, a decrease in the predicted year should occur in the number of dead by –0.62%, in the mid-year population of males by –1.33% and that in females by –1.02%, in the mid-year po-pulation by –1.17%, in the productive popo-pulation by –3.65%, in the number of dead per 1000 inhabitants and marriages per 1000 inhabitants by –5.21%, in the number of marriages by –5.23%, in the number of life-born per 1000 inhabitants by –6.88% and in the pre-productive population by –15.43%.
Applied methodical procedures of the treatment, analysis and interpretation of findings obtained in the study of the level, dynamics, trends and prediction of the selected indicators of demographic statics and dynamics in the examined territorial unit and reference period can be considered to be an efficient motivation element for changes in the approach of competent authorities to the population policy of the state downgraded so far.
SOUHRN
Analýza vývoje vybraných ukazatelů demografické statiky a dynamiky České republiky v le
-tech 1993–2003
Probíhající transformační proces, cílený na tržní ekonomiku, zahájený v České republice od roku 1990 zásadními politickými změnami, je obdobím složitým nejen z hlediska ekonomického, ale i sociálního, které svými hospodářskými a sociálními aspekty ovlivňují míru reprodukce obyvatelstva. Při hodnocení demografické statiky, zabývající se problematikou obyvatelstva z hlediska jeho početního stavu v refe-renčním období let 1993–2003 byla prokázána jeho výrazná stabilita (Vy = 0,49 %) při průměrné úrovni
10 281,2 tis. obyvatel s průměrným ročním poklesem za daný časový interval –0,14 %. Při komparaci prezentovaných charakteristik s předcházejícím desetiletím nelze opomenout jejich diference v obou referenčních obdobích. Konstatovat lze vedle poklesu průměrného počtu obyvatel proti bazickému ob-dobí o 57,5 tis. obyvatel (–0,56 %) při poklesu jeho variability o 0,31 % bodu. Zanedbatelný není pro-kázaný jednoprocentní podíl přírůstku obyvatelstva stěhováním při formování jeho úrovně v období let 1993 až 2003 (78 950 osob). Z extrapolační bodové predikce středního stavu obyvatelstva na rok 2005 ve výši 10 161 tis. osob a její komparace s průměrnou úrovní dosaženou v období let 1993 až 2003 lze usuzovat na pokles daného indikátoru o 1,17 %.
Při zkoumání demografické struktury, která se opírá o třídění podle věku a pohlaví jako výsledku demo-grafických procesů probíhajících v populaci po řadu let a zároveň do určité míry předurčuje populační vývoj v budoucích letech, byl za totální referenční interval prokázán podíl předproduktivní populace ve výši 17,35 % s průměrným ročním poklesem –2,99 %, produktivní populace ve výši 69,09 % s průměr-ným ročním zvýšením 0,32 % a poproduktivní populace ve výši 13,56 % s průměrprůměr-ným ročním zvýše-ní o 0,58 %. Podle bodové extrapolačzvýše-ní predikce by očekávaný podíl předproduktivzvýše-ní populace dosáhl 14,85 % (–2,5 % bodu), u populace produktivní 71,33 % (+2,24 % bodu) a u populace poproduktivní 13,82 % (+0,26 % bodu). Při diferenciaci středního stavu obyvatelstva podle pohlaví dosáhl podíl mužů v hodnoceném období 48,64 %, žen 51,36 %. Predikované diference +0,04 % ve shodném pořadí lze považovat za zanedbatelné.
Address
Prof. Ing. Milan Palát, CSc., Ústav statistiky a operačního výzkumu, Mendelova zemědělská a lesnická univer-zita v Brně, Zemědělská 1, 613 00 Brno, Česká republika, e-mail: [email protected], Doc. Ing. Erich Maca, CSc., Kotlářská 44, 602 00 Brno, Česká republika
sňatků, –25,00 % u počtu sňatků na 100 obyvatel středního stavu, –22,88 % u předproduktivní popula-ce, –22,59 % u počtu živé narozených, –21,37 % u počtu živě narozených na 1000 obyvatel, – 5,84 % u počtu zemřelých, –4,39 % u počtu zemřelých na 100 obyvatel, –1,53 % u středního stavu žen, – 1,25 % u středního stavu obyvatelstva a –0,96 % u středního stavu mužů.
Podle krátkodobé bodové extrapolační predikce úrovně zkoumaných demografických ukazatelů oby-vatelstva a jeho struktury podle pohlaví a škály ekonomických generací včetně pohybu obyoby-vatelstva na rok 2005 lze proti průměru let 1993 až 2003 očekávat zvýšení středního počtu obyvatelstva popro-dukční populace o 0,76 %, střední délky života žen o 2,88 % a mužů o 3,03 %, rozvodů o 8,30 %, po-čtu rozvodů na 1000 obyvatel o 10,33 % a rozvodů na 100 sňatků o 20,11 %. Ke snížení v predikova-ném roce by naproti tomu došlo u počtu zemřelých o –0,62 %, u středního stavu mužů o –1,33 % a žen o –1,02 %, u středního stavu obyvatelstva o –1,17 %, u produktivní populace o –3,65 %, u zemřelých na 1000 obyvatel a sňatků na 1000 obyvatel o –5,21 %, u počtu sňatků o –5,23 %, u živé narozených na 1000 obyvatel o –6,88 % a u předproduktivní populace o –15,43 %.
Aplikované metodické postupy zpracování, analýzy a interpretace poznatků, získaných při studiu úrov-ně, dynamiky, trendu a predikce vybraných ukazatelů demografické statiky a dynamiky v posuzova-ném územním celku a referenčním období lze považovat za účinný motivační prvek pro změny přístupu kompetentních vládních orgánů k až dosud podceňované populační politice státu.
obyvatelstvo, diferenciace podle pohlaví a ekonomických generací, pohyb, dynamika, trend, krátkodo-bá predikce, Česká republika
ACKNOWLEDGEMENT The paper was prepared thanks to the support of the MSM 6215648904.
REfERENCES
BAKYTOVá, H., HáTLE, J., NOVáK, I., URGON, M.: Statistická indukce pro ekonomy. Praha: 1986, SNTL/ALFA, 344 s.
CYHELSKý, L., KAŇOKOVá, J., NOVáK, I.: Zá-klady teorie statistiky pro ekonomy. Praha: l979, SNTL/ALFA. 356 p.
DUFEK, J.: The reproduction and the migration of he popultion in the South Moravian region of the Czech Republic in 1993–1997. Acta univ. agric. et silvic. Mendel. Brun., 1999, XLVII, No. 2, pp. 103– 112. ISSN 1211-8516.
KOBZÍKOVá, L.: Koncentrace obyvatelstva v Jiho-moravském kraji. Acta univ. agric. et silvic. Men-del. Brun., 2000, XLVII, No. 2, pp. 11–15. ISSN 1211-8516.
KOVAČKA, M., KONTŠEKOVá, O.: Štatistické metódy. SVTL Bratislava, 1962. 255 s.
MINAřÍK, B.: Statistika I. Brno: MZLU, 2000, 107 p. ISBN 80-7157-427-9.
PALáT, M., MACA, E.: Analysis of the development
and prediction of the population movement indica-tors in the Czech Republic. Acta univ. Agric. et Sil-vic. Mendel. Brun., 2004, vol. LII, no 3, pp. 17–34. ISSN 1211-8516.
PALáT, M., MACA, E.: Development and prediction of the selected population movement indicators in the Czech Republic. AGRIC. ECON. - Czech, 51, 2005(6): 235–239. ISSN 0139-570X.
ROUBÍČEK, V.: Základní problémy obecné a soci-ální demografie.VŠE Praha. 1996. 271 p. ISBN 80-7079-188-8.
ROUBÍČEK, V.: Úvod do demografie. CODEX Bo-hemia Praha. 1997. 352 p. ISBN 80-85963-43-4. Seger, J., Hindls, R., Hronová, S.: Statistika v
hospo-dářství., ECT Publishing Praha. 1998, 636 s. ISBN 80-86006-56-5
SRB, V.: Populační vývoj a populační politika České republiky. Demografie 2002, 3: 198–201 p. ISSN 0011-8265.