Cancer Management and Research
Dove
press
O R i g i n a l R e s e a R C h open access to scientific and medical research
Open Access Full Text Article
nomogram application to predict overall and
cancer-specific survival in osteosarcoma
Weipeng Zheng1,*
Yuanping Huang1,* haoyi Chen2 ning Wang1
Wende Xiao3
YingJie liang3 Xin Jiang1
Wenzhou Su4
shifeng Wen4
1Department of Orthopedics, Guangzhou First People’s Hospital, Guangzhou Medical University, Guangzhou, Guangdong 510180, People’s Republic of China; 2Department of Orthopedics, Guangzhou Chest Hospital, Guangzhou, Guangdong 510180, People’s Republic of China; 3Department of Orthopedics, Guangzhou First People’s Hospital, School of Medicine, South China University of Technology, Guangzhou, Guangdong 510180, People’s Republic of China; 4Department of Orthopedics, Guangzhou First People’s Hospital, Guangzhou Medical University, School of Medicine, South China University of Technology, Guangzhou, Guangdong 510180, People’s Republic of China
*These authors contributed equally to this work
Purpose:A prognostic nomogram was applied to predict survival in osteosarcoma patients.
Patients and methods:Data collected from 2,195 osteosarcoma patients in the Surveillance, Epidemiology, and End Results (SEER) database between 1983 and 2014 were analyzed. Inde-pendent prognostic factors were identified via univariate and multivariate Cox analyses. These were incorporated into a nomogram to predict 3- and 5-year overall survival (OS) and cancer-specific survival (CSS) rates. Internal and external data were used for validation. Concordance indices (C-indices) were used to estimate nomogram accuracy.
Results:Patients were randomly assigned into a training cohort (n=1,098) or validation cohort (n=1,097). Age at diagnosis, tumor site, histology, tumor size, tumor stage, use of surgery, and tumor grade were identified as independent prognostic factors via univariate and multivariate Cox analyses (all P<0.05) and then included in the prognostic nomogram. C-indices for OS and CSS prediction in the training cohort were 0.763 (95% CI 0.761–0.764) and 0.764 (95% CI 0.762–0.765), respectively. C-indices for OS and CSS prediction in the external validation cohort were 0.739 (95% CI 0.737–0.740) and 0.740 (95% CI, 0.738–0.741), respectively. Cali-bration plots revealed excellent consistency between actual survival and nomogram prediction.
Conclusion:Nomograms were constructed to predict OS and CSS for osteosarcoma patients in the SEER database. They provide accurate and individualized survival prediction.
Keywords:cancer-specific survival, nomogram, osteosarcoma, overall survival, prognosis, SEER database
Introduction
Osteosarcoma, mainly originated from primitive malignant mesenchymal cells in bone,1
is the most common primary malignant bone tumor, typically affecting adolescents under 24 years of age with an estimated incidence of 0.34/100,000 per year.2 The metaphyses
of long bones are the primary sites of most osteosarcomas, including distal femur, proxi-mal humerus, and proxiproxi-mal tibia, with approximately 10% of osteosarcomas derived from the axial skeleton.3 Local swelling, pain, and restricted joint movement are the
most common symptoms. Before the 1970s, amputation was still the main therapeutic measure for high-grade osteosarcoma because of the lack of adjuvant chemotherapy,4
which seriously affected patient quality of life and reduced the probability of survival. With the introduction of the adjuvant chemotherapy and limb salvage surgery, the sur-vival rate rose from less than 20% to approximately 70%.5 Currently, wide resection
together with adjuvant chemotherapy and limb reconstruction have been widely applied to treat high-grade osteosarcoma.6,7 Nevertheless, these options are often insufficient
for patients with metastatic and recurrent osteosarcoma.1,8 Better comprehension of
Correspondence: shifeng Wen
Department of Orthopedics, Guangzhou First People’s Hospital, Guangzhou Medical University, School of Medicine, South China University of Technology, First Pan Fu Road, Guangzhou, Guangdong 510180, People’s Republic of China
Tel +86 138 2504 9160 email [email protected]
Journal name: Cancer Management and Research Article Designation: Original Research Year: 2018
Volume: 10
Running head verso: Zheng et al
Running head recto: Prognostic nomogram to predict osteosarcoma survival DOI: http://dx.doi.org/10.2147/CMAR.S177945
Cancer Management and Research downloaded from https://www.dovepress.com/ by 118.70.13.36 on 20-Aug-2020
For personal use only.
Dovepress
Zheng et al
the prognostic variables of osteosarcoma can provide more assistance to guide therapeutic intervention, which contributes to prolonging survival and enhancing quality of life.
Although previous studies focused on prognostic factors for osteosarcoma patients, including tumor size, response to chemotherapy, recurrence, and metastasis,9–11 these variables
only served as a single index to evaluate prognosis, which limited their impact on a precise individualized survival pre-diction of osteosarcoma patients. Considering the limitation of the single factor, we sought to develop a novel prognostic model. In the present study, we constructed a nomogram, an efficient prognostic tool, to more precisely estimate an individual patient’s survival more precisely by integrating all prognostic factors for osteosarcoma patients. A prognostic nomogram is an ocular and effective tool based on statistical regression models.12 It can provide a graphic calculating scales
method that can be used to estimate the probability of patient survival.13 A nomogram can improve the predictive accuracy
of individual prognosis because of its strong robustness and better predictive accuracy.12–14 The Surveillance,
Epidemiol-ogy, and End Results (SEER) dataset between 1983 and 2014 provided clinical information of osteosarcoma patients that allowed detailed analyses of survival of osteosarcoma. This cancer database covers approximately 30% of the overall US population.12 It is composed of 18 registries that contain
clinical information on patients with tumors in the US.12 The
purpose of current study was to construct effective prognostic nomograms to predict 3- and 5-year overall survival (OS) and cancer-specific survival (CSS) rates for osteosarcoma patients.
Patients and methods
Patient eligibility and variables
We identified all osteosarcoma patients listed in the SEER database, which collects anonymized clinical data from population-based cancer registries. Use of these clinical data does not require patients’ informed consent since no case-identifying information is provided.15 No ethics approval was
sought for this study as the data used were from the publicly available, de-identified SEER database.16 All procedures
were performed in accordance with the Helsinki Declaration (1964) and its later amendments or comparable ethical stan-dards.16 SEER*Stat software (version 8.3.5; NCI, Bethesda,
MD, USA) was used to acquire patient information. The inclusion criteria for osteosarcoma patients in the present study were as follows:
1. Diagnosed with osteosarcoma (International Classifica-tion of Diseases for Oncology [ICD-O]: 9180, 9181,
9182, 9183, 9184, 9185, 9186, 9187, 9192, 9193, 9194, or 9200) as a primary malignancy between 1983 and 2014. 2. Positive histological confirmation of osteosarcoma. 3. Site limited to extremity (long or short bones of the upper
or lower extremities) or axial location (skull, pelvis, spine, or ribs).
4. Confirmation of histologic type of osteosarcoma. 5. Known cause of death and survival months after
diagnosis.
The exclusion criteria for osteosarcoma patients in this study were:
1. Unknown use of surgery. 2. Unknown surgical stage. 3. Unknown tumor size.
Clinicopathological features including patient age, gen-der, histology, surgical stage, tumor size, tumor site, grade, marital status, race, use of surgery, and survival time were collected. The anatomic location of osteosarcoma was cat-egorized as extremity (long or short bones of the upper or lower extremities) or axial (skull, pelvis, spine, or ribs). Low-grade tumors contained well- and moderately differentiated grades (ICD-O-3 Grades 1 and 2), and high-grade tumors contained poorly or undifferentiated grades (ICD-O-3 Grades 3 and 4). Cutoff values of age of diagnosis and tumor size were determined via X-tile software (Yale University, New Haven, CT, USA), which was previously shown to determine best cut-points of tumor variables.17 The optimal cutoff
values of tumor size were categorized as small (<2.9 cm), intermediate (2.9–10.0 cm), and large (>10.0 cm) (Figure 1). The optimal age cutoffs were 25 and 51 years (Figure 1), so patients were categorized into three age groups (0–24 years, 25–51 years, or >51 years). According to American Joint Committee on Cancer (AJCC) staging system for bone sarcomas, surgical stage was categorized as localized, regional, or distant.18 Patients coded with “localized” disease
were classified as disease confined to the periosteum, while those with “regional” disease had tumor extending beyond the periosteum but without distant metastasis. Patients with missing surgical stage data were excluded. Surgical resection was categorized as yes or no; data on the type of resection (eg, wide, marginal, or intralesional) could not be obtained from the SEER database. Race was categorized as white, black, or other (American Indian/Alaskan Native, Asian/ Pacific Islander). In terms of chemotherapy and radiation, “No/Unknown” was used in the updated SEER dataset as a single option, impacting data completeness. These patients
Cancer Management and Research downloaded from https://www.dovepress.com/ by 118.70.13.36 on 20-Aug-2020
Dovepress Prognostic nomogram to predict osteosarcoma survival
had no codes for radiation or chemotherapy in their medical records. Adding this information to the nomogram might have introduced relevant bias,12 so use of chemotherapy and
radiation was not included as a variable.
statistical analysis
Based on the abovementioned inclusion and exclusion criteria, osteosarcoma patients were randomly divided into a training cohort (n=1,098) or validation cohort (n=1,097) to construct and validate nomograms. Chi-squared tests were used to compare clinical characteristics between the cohorts.
Continuous and categorical variables are presented as the number of osteosarcoma patients with respective percent-ages. X-tile software was applied to calculate cutoff values for tumor size and age of diagnosis based on OS information (Figure 1). The prognostic factors (age at diagnosis, gender, primary site, tumor size, histology, surgical stage, grade, marital status, race, use of surgery, etc) were further evalu-ated via univariate and multivariate Cox proportional hazards regression analyses. Hazard ratios and corresponding 95% CI of variables were also calculated. OS and CSS were the two primary endpoints. Survival times were calculated from the date of disease diagnosis to the date of death from any disease cause (OS) or death from osteosarcoma (CSS). Prognostic
nomograms for 3- and 5-year OS and 3- and 5-year CSS were constructed according to the univariate and multivariate Cox analyses. Internal and external validations of the prognostic nomogram were performed. Harrell’s concordance-index (C-index) was applied to evaluate prognostic nomogram performance. This C-index was a useful evaluation value similar to calculating the area under the receiver operat-ing characteristic curve.19 C-indices range from 0.5 to 1.0,
indicating total chance and perfect matching, respectively.20
Calibration curves were constructed to compare consistency between predicted and observed survival. Chi-squared tests and univariate and multivariate Cox analyses were performed with SPSS 22.0 software (IBM Corp, Armonk, NY, USA). rms Package in R software (version 3.3.1) was used to con-struct and validate prognostic nomograms. Differences were considered significant at two-sided P<0.05.
Results
Patient baseline characteristics
The SEER database contained 2,195 osteosarcoma patients between 1983 and 2014, including 1,098 patients in the train-ing cohort and 1,097 patients in the validation cohort. The training cohort was used to construct and internally validate the nomogram, and the validation cohort was used for exter-nal validation. In the training cohort, 363 patients died from
Figure 1 Identification of optimal cutoff values of age of diagnosis (A–C) and tumor size (D–F) via X-tile analysis.
Notes: Optimal cutoff values of age were identified as 29 and 51 years based on overall survival. Optimal cutoff values of tumor size were identified as 8.9 and 13.9 cm based on overall survival. Histogram and Kaplan–Meier analysis were developed based on these cutoff values.
Larger low population
Larger high population
No. of patient
s
Survival
%
Age at diagnosis Survival time (years)
Larger low population
Larger high population
446 100
50
0
10
0 0
0.0 25.0 51.0 94.0 0.0 7.5 15.0
No. of patients Survival
%
Age at diagnosis Survival time (years)
573 100
50
0
10
0 0
0.0 8.913.9 95.0 0.0 7.5 15.0
A B C
D E F
Cancer Management and Research downloaded from https://www.dovepress.com/ by 118.70.13.36 on 20-Aug-2020
Dovepress
Zheng et al
osteosarcoma, and 32 patients died from other causes. In the validation cohort, 356 patients died from osteosarcoma, and 37 patients died from other causes.
The osteosarcoma patients’ characteristics are listed in Table 1. Of these patients, 981 (44.7%) patients were females
and 1,214 (55.3%) patients were males. The most common primary location of these osteosarcoma patients was an extremity (80.8%), and 19.2% had a primary axial site. With regard to tumor stage, regional disease (48.0%) was most frequent, followed by localized disease (32.8%) and distant
Table 1 Baseline demographic and clinical characteristics of patients with osteosarcoma
Variables Training cohort
(n=1,098)
Validation cohort (n=1,097)
Total (n=2,195)
P
Surgery, n, % 0.399
no 89 8.1% 100 9.1% 189 8.6%
Yes 1,009 91.9% 997 90.9% 2006 91.4%
Sex, n, % 0.507
Female 483 44.0% 498 45.4% 981 44.7%
Male 615 56.0% 599 54.6% 1,214 55.3%
Age (years), n, % 0.592
<25 693 63.1% 694 63.3% 1,387 63.2%
>51 127 11.6% 140 12.8% 267 12.2%
25–51 278 25.3% 263 24.0% 541 24.6%
Tumor site, n, % 0.118
axial 225 20.5% 196 17.9% 421 19.2%
extremity 873 79.5% 901 82.1% 1,774 80.8%
Histology, n, % 0.176
Conventional osteosarcoma 663 60.4% 692 63.1% 1,355 61.7%
Chondroblastic osteosarcoma 186 16.9% 143 13.0% 329 15.0%
Fibroblastic osteosarcoma 78 7.1% 65 5.9% 143 6.5%
Telangiectatic osteosarcoma 42 3.8% 39 3.6% 81 3.7%
Osteosarcoma in Paget disease of bone 8 0.7% 7 0.6% 15 0.7%
small cell osteosarcoma 8 0.7% 13 1.2% 21 1.0%
Central osteosarcoma 26 2.4% 37 3.4% 63 2.9%
Intraosseous well differentiated osteosarcoma 2 0.2% 2 0.2% 4 0.2%
Parosteal osteosarcoma 63 5.7% 80 7.3% 143 6.5%
Periosteal osteosarcoma 18 1.6% 13 1.2% 31 1.4%
High-grade surface osteosarcoma 4 0.4% 6 0.5% 10 0.5%
Tumor stage, n, % 0.273
localized 377 34.3% 344 31.4% 721 32.8%
Regional 521 47.4% 533 48.6% 1,054 48.0%
Distant 200 18.2% 220 20.1% 420 19.1%
Size, n, % 0.373
<8.9 578 52.6% 560 51.0% 1,138 51.8%
>13.9 184 16.8% 209 19.1% 393 17.9%
8.9–13.9 336 30.3% 328 29.9% 664 30.3%
Grade, n, % 0.584
high 938 85.4% 928 84.6% 1,866 85.0%
low 160 14.6% 169 15.4% 329 15.0%
Marital 0.950
Married 842 76.7% 840 76.6% 1,682 76.6%
Unmarried 256 23.3% 257 23.4% 513 23.4%
Year of diagnosis 0.810
1983–1992 51 4.6% 47 4.3% 98 4.5%
1993–2002 274 25.0% 285 26.0% 559 25.5%
2003–2014 773 70.4% 765 69.7% 1,538 70.1%
Race 0.341
Black 183 16.7% 167 15.2% 350 15.9%
Other 115 10.5% 101 9.2% 216 9.8%
White 800 72.9% 829 75.6% 1,629 74.2%
Cancer Management and Research downloaded from https://www.dovepress.com/ by 118.70.13.36 on 20-Aug-2020
Dovepress Prognostic nomogram to predict osteosarcoma survival disease (19.1%). In both cohorts, the majority of patients
were children or adolescents (<25 years; 63.2%). Most tumors were <8.9 cm (51.8%). Most of the patients in our study had received surgical treatment (91.4%). There were no significant differences between the training and validation cohorts.
Prognostic factors for OS and CSS
In the training cohort, data from 1,098 osteosarcoma patients were included in univariate and multivariate analyses to identify independent prognostic factors for OS and CSS. As is shown in Tables 2 and 3, gender, age at diagnosis, tumor site,
histol-Table 2 Univariate and multivariate analyses of overall survival in the training cohort
Characteristics Univariate analysis
P
Multivariate analysis
HR 95% CI P
Sex <0.001
Female Reference
Male 1.183 0.954–1.466 0.126
Age (years) <0.001
<25 Reference
>51 2.422 1.718–3.414 <0.001
25–51 1.378 1.009–1.883 0.044
Tumor site <0.001
axial Reference
extremity 0.572 0.442–0.740 <0.001
Histology <0.001
Conventional osteosarcoma Reference
Chondroblastic osteosarcoma 0.802 0.605–1.064 0.125
Fibroblastic osteosarcoma 0.803 0.537–1.200 0.285
Telangiectatic osteosarcoma 1.336 0.844–2.117 0.217
Osteosarcoma in Paget disease of bone 2.375 1.121–5.032 0.024
small cell osteosarcoma 0.337 0.047–2.409 0.278
Central osteosarcoma 0.634 0.281–1.430 0.272
Intraosseous well-differentiated osteosarcoma <0.001 0.000–7.603e+80 0.933
Parosteal osteosarcoma 1.001 0.487–2.058 0.998
Periosteal osteosarcoma 0.201 0.028–1.441 0.110
High grade surface osteosarcoma 1.040 0.145–7.459 0.969
Tumor stage <0.001
localized Reference
Regional 1.647 1.248–2.174 <0.001
Distant 4.886 3.580–6.666 <0.001
Surgery <0.001
no Reference
Yes 0.460 0.339–0.623 <0.001
Size <0.001
<8.9 Reference
>13.9 2.141 1.617–2.835 <0.001
8.9–13.9 1.391 1.094–1.768 0.008
Grade <0.001
high Reference
low 0.446 0.287–0.694 <0.001
Marital <0.001
Married Reference
Unmarried 1.250 0.930–1.681 0.139
Year of diagnosis 0.427
1983–1992 ni
1993–2002 2003–2014
Race 0.917
Black ni
Other White
Cancer Management and Research downloaded from https://www.dovepress.com/ by 118.70.13.36 on 20-Aug-2020
Dovepress
Zheng et al
ogy, tumor size, tumor stage, use of surgery, tumor grade, and marital status were significantly associated with OS and CSS in the univariate analysis. These nine factors were further selected to conduct the multivariate Cox analysis in order to control for
confounding variables. The multivariate Cox analysis revealed that seven factors including age at diagnosis, tumor site, histol-ogy, tumor size, tumor stage, use of surgery, and tumor grade were independent prognostic factors for OS and CSS. Table 3 Univariate and multivariate analyses of cancer-specific survival in the training cohort
Characteristics Univariate analysis
P
Multivariate analysis
HR 95% CI P
Sex <0.001
Female Reference
Male 1.164 0.931–1.456 0.183
Age (years) <0.001
<25 Reference
>51 2.175 1.514–3.124 <0.001
25–51 1.371 0.990–1.899 0.057
Tumor site <0.001
axial Reference
extremity 0.541 0.414–0.708 <0.001
Histology <0.001
Conventional osteosarcoma Reference
Chondroblastic osteosarcoma 0.782 0.581–1.052 0.104
Fibroblastic osteosarcoma 0.797 0.521–1.220 0.297
Telangiectatic osteosarcoma 1.469 0.925–2.331 0.103
Osteosarcoma in Paget disease of bone 2.791 1.308–5.957 0.008
small cell osteosarcoma 0.359 0.050–2.570 0.308
Central osteosarcoma 0.683 0.302–1.543 0.360
Intraosseous well-differentiated osteosarcoma <0.001 0.000–6.386e+85 0.935
Parosteal osteosarcoma 0.943 0.443–2.010 0.880
Periosteal osteosarcoma 0.214 0.030–1.532 0.125
High grade surface osteosarcoma 1.102 0.154–7.906 0.923
Tumor stage <0.001
localized Reference
Regional 1.782 1.326–2.397 <0.001
Distant 5.267 3.792–7.316 <0.001
Surgery <0.001
no Reference
Yes 0.461 0.336–0.633 <0.001
Size <0.001
<8.9 Reference
>13.9 2.232 1.667–2.987 <0.001
8.9–13.9 1.435 1.116–1.845 0.005
Grade <0.001
high Reference
low 0.502 0.320–0.787 0.03
Marital <0.001
Married Reference
Unmarried 1.253 0.918–1.709 0.155
Year of diagnosis 0.552
1983–1992 ni
1993–2002 2003–2014
Race 0.910
Black ni
Other White
Cancer Management and Research downloaded from https://www.dovepress.com/ by 118.70.13.36 on 20-Aug-2020
Dovepress Prognostic nomogram to predict osteosarcoma survival
Construction and validation of the OS
and Css nomograms
The significant independent factors of age at diagnosis, tumor site, histology, tumor size, tumor stage, use of surgery, and tumor grade were incorporated to create the prognostic nomograms for estimating the 3- and 5-year OS and CSS of osteosarcoma patients (Figure 2). The nomogram gives every prognostic variable a score on the point scale (Table 4). By adding up these scores to the total on the bottom scale, the
3- and 5-year OS and CSS of osteosarcoma patients can be predicted.
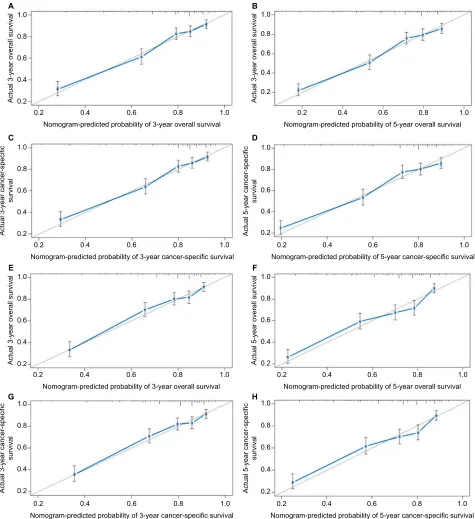
Prognostic nomogram validation was conducted both internally and externally (Figure 3). Internal validation in the training cohort showed that the C-index values for nomogram predictions of OS and CSS were 0.763 (95% CI 0.761–0.764) and 0.764 (95% CI 0.762–0.765), respectively. Similarly, the corresponding C-index values in the external validation cohort were 0.739 (95% CI 0.737–0.740) and 0.740 (95%
0 1
25–51 Points
A
B
Age
Grade
Histology
Stage
Surgery
Size
Site
Total points
3-year OS
5-year OS
Points
Age
Grade
Histology
Stage
Surgery
Size
Site
Total points
3-year CSS
5-year CSS
<25 >51
8.9–13.9 <8.9 >13.9
25–51
<25 >51
High Low
High Low
Localized
Yes
Extremity Axial
No
8.9–13.9 <8.9 >13.9 Yes
Extremity Axial
No
Distant Regional
Localized Distant
Regional
H F C I K E
D A B G J
H F B I K E
D A C G J
2 3 4 5 6 7 8 9 10
0 1 2 3 4 5 6 7 8 9 10
0 2 4 6 8
0.95 0.9 0.850.8 0.7 0.6 0.5 0.4 0.3 0.2 0.10.05
0.95 0.9 0.850.8 0.7 0.6 0.5 0.4 0.30.2 0.10.05
0.95 0.90.850.8 0.7 0.6 0.50.40.3 0.2 0.10.05
0.95 0.90.850.8 0.7 0.6 0.50.40.3 0.2 0.10.05
10 12 14 16 18 20
0 2 4 6 8 10 12 14 16 18 20
Figure 2 Nomograms to predict 3- and 5-year overall survival (A) and cancer-specific survival (B) for osteosarcoma patients.
Notes: Vertical line between each variable and points scale can be drawn to acquire points of each variable. Predicted survival rate was calculated according to the total points by drawing a vertical line from Total Points scale to overall survival or cancer-specific survival scale. A, conventional osteosarcoma; B, chondroblastic osteosarcoma; C, fibroblastic osteosarcoma; D, telangiectatic osteosarcoma; E, osteosarcoma in Paget disease of bone; F, small cell osteosarcoma; G, central osteosarcoma; H, intraosseous well-differentiated osteosarcoma; I, parosteal osteosarcoma; J, periosteal osteosarcoma; K, high-grade surface osteosarcoma.
Cancer Management and Research downloaded from https://www.dovepress.com/ by 118.70.13.36 on 20-Aug-2020
Dovepress
Zheng et al
CI 0.738–0.741). These results confirm that our prognostic nomograms were reasonably accurate. The calibration plots (Figure 3) demonstrated excellent agreement between actual survival and nomogram prediction.
In summary, we constructed and validated the nomogram to estimate 3- and 5-year OS and CSS for osteosarcoma patients. Based on an individual osteosarcoma patient’s prognostic factors, we can obtain a score associated with each prognostic factor on the nomogram point scale and calculate the total score. We can then evaluate 3- and 5-year survival probability by projecting the total points to the total score scale of the nomogram. As an example, an 18-year-old
patient was diagnosed with an axial chondroblastic osteosar-coma with a primary tumor size of 10.0 cm that was high grade. This patient was found to have regional disease and underwent surgery. According to our nomograms, the patient has 12.1 and 11.7 points in OS and CSS, respectively. The 3-year OS and CSS rates of this osteosarcoma were 0.72 and 0.69, respectively, while the corresponding 5-year rates were 0.62 and 0.62.
Discussion
Multiple prognostic factors can affect osteosarcoma patient survival, but previous studies did not integrate overall prognostic factors. A single prognostic index may impose limitations on estimating an individual patient’s survival prognosis. The nomogram is a common statistical tool that can provide satisfactory accuracy and robustness to precisely predict an individual patient’s survival probability.21 Kim et
al constructed a prognostic nomogram for nonmetastatic osteosarcoma patients that could estimate and predict metastasis risk better than the AJCC staging system or tumor necrosis rate alone.22 Xia et al also devised a nomogram to
further predict the survival of osteosarcoma patients after surgical resection.23 However, these studies were designed
without validation, so their results might not be relevant in other populations due to potential bias. Kim et al developed a high-performance nomogram to predict the probability of metastasis in Enneking stage IIB extremity osteosarcoma using the medical records of 91 patients who had undergone surgery.24 However, the small sample size was a significant
limiting factor, and the generalizability of this nomogram should be validated in larger populations. In the present study, we constructed convenient and comprehensive prognostic nomograms using data from 2,195 osteosarcoma cases in the SEER dataset, which allowed us to calculate 3- and 5-year OS and CSS rates for osteosarcoma patients.
To accurately select the prognostic factors, we performed univariate log-rank and multivariate Cox analysis to identify independent prognostic factors. The results showed that age at diagnosis, tumor site, histology, tumor size, tumor stage, use of surgery, and tumor grade are independent prognostic factors for the survival of patients with osteosarcoma. In the current study, within the period from 1984 to 2014, year of diagnosis was not found to be independently associated with OS or CSS. One possible explanation is that progress made in clinical information has not been as successful for osteosarcoma. Similar approach has been taken in previous investigations.25,26 In previous studies, increasing patient
Table 4 Detailed scores of prognostic factors in the overall and
cancer-specific survival nomograms
Characteristic OS nomogram CSS nomogram
Age (years)
<25 0 0
>51 2.0 1.6
25–51 0.9 0.8
Tumor site
axial 1.1 1.1
extremity 0 0
Histology
A (9180) 8.3 8.1
B (9181) 7.9 7.7
C (9182) 7.9 7.7
D (9183) 8.9 8.8
E (9184) 10.0 10.0
F (9185) 6.2 6.3
G (9186) 7.5 7.5
H (9187) 0 0
I (9192) 8.3 8.0
J (9193) 5.2 5.3
K (9194) 8.3 8.3
Tumor stage
localized 0 0
Regional 0.9 1.0
Distant 3.1 3.0
Surgery
no 1.5 1.4
Yes 0 0
Size
<8.9 0 0
>13.9 1.5 1.4
8.9–13.9 0.6 0.6
Grade
high 1.6 1.3
low 0 0
Notes: A, conventional osteosarcoma; B, chondroblastic osteosarcoma; C, fibroblastic osteosarcoma; D, telangiectatic osteosarcoma; E, osteosarcoma in Paget disease of bone; F, small cell osteosarcoma; G, central osteosarcoma; H, intraosseous well-differentiated osteosarcoma; I, parosteal osteosarcoma; J, periosteal osteosarcoma; K, high-grade surface osteosarcoma.
Cancer Management and Research downloaded from https://www.dovepress.com/ by 118.70.13.36 on 20-Aug-2020
Dovepress Prognostic nomogram to predict osteosarcoma survival
1.0
A B
C D
E F
G H
0.8
0.6
0.4
0.2
0.2 0.4 0.6
Nomogram-predicted probability of 3-year overall survival
Actual 3-year overall surviva
l 1.0
0.8
0.6
0.4
0.2
Actual 3-year overall surviva
l
0.8 1.0 0.2 0.4 0.6
Nomogram-predicted probability of 5-year overall survival
0.8 1.0
1.0
0.8
0.6
0.4
0.2
0.2 0.4 0.6
Nomogram-predicted probability of 3-year overall survival
Actual 3-year overall surviva
l 1.0
0.8
0.6
0.4
0.2
Actual 5-year overall surviva
l
0.8 1.0 0.2 0.4 0.6
Nomogram-predicted probability of 5-year overall survival
0.8 1.0
1.0
0.8
0.6
0.4
0.2
0.2 0.4 0.6
Nomogram-predicted probability of 3-year cancer-specific survival
Actual 3-year cancer-specific
surviva
l
1.0
0.8
0.6
0.4
0.2
Actual 5-year cancer-specific
surviva
l
0.8 1.0 0.2 0.4 0.6
Nomogram-predicted probability of 5-year cancer-specific survival
0.8 1.0
1.0
0.8
0.6
0.4
0.2
0.2 0.4 0.6
Nomogram-predicted probability of 3-year cancer-specific survival
Actual 3-year cancer-specific
surviva
l
1.0
0.8
0.6
0.4
0.2
Actual 5-year cancer-specific
surviva
l
0.8 1.0 0.2 0.4 0.6
Nomogram-predicted probability of 5-year cancer-specific survival
0.8 1.0
Figure 3 Internal calibration plots of 3-year (A) and 5-year (B) overall survival nomogram calibration curves; 3-year (C) and 5-year (D) cancer-specific survival nomogram calibration curves. External calibration plots of 3-year (E) and 5-year (F) overall survival nomogram calibration curves; 3-year (G) and 5-year (H) cancer-specific survival nomogram calibration curves.
Notes: The cohort was divided into five subgroups with the equal sample size for present internal validation. The dashed line represents an excellent match between actual survival outcome (Y-axis) and nomogram prediction (X-axis). Closer distances between dashed line and points indicated higher prediction accuracy.
age was associated with a statistically significant decrease in the survival prognosis of osteosarcoma patients.26–28 Ek
et al reported that osteosarcoma patients older than 40 had worse survival outcomes.29 Similarly, we identified
increas-ing patient age as an independent negative prognostic factor for osteosarcoma patients. Our analysis used X-tile software to stratify the data of age based on status and survival time. It identifies the best cut-points of variables and was initially
Cancer Management and Research downloaded from https://www.dovepress.com/ by 118.70.13.36 on 20-Aug-2020
Dovepress
Zheng et al
applied in breast malignancy. We determined that the opti-mal age cut-points of osteosarcoma patients were 25 and 51 years. Tumor size was also one of the key measures of survival prognosis of osteosarcoma patients. Several previ-ous studies reported that patients with larger tumors had a poorer prognosis and decreased survival rate.10,30,31 We also
identified larger tumor size as an independent prognostic factor of shorter survival. To obtain the best cut-points for tumor size, we again used X-tile software for data stratifi-cation. The results showed that 8.9 and 13.9 cm were the optimal cutoff values. We also observed that adequate use of limb salvage surgery had a significant effect on osteosar-coma patient survival outcomes. Previous studies reported similar results.9,28,32
In a previous study, the tumor site and stage were reported as the most significant prognostic factors for osteosarcoma patients.32 These tumors appear mostly in the metaphyses
of long bones, with approximately 10% of osteosarcomas occurring in the axial skeleton.33 Seker et al reported that
osteosarcoma patients with extremity primary tumors have better survival prognoses than those with non-extremity tumors.32 Other groups also found that an axial primary site of
osteosarcoma was associated with considerably worse survival outcomes.33–35 The present study also demonstrated that tumor
site influences the survival of osteosarcoma patients. With regard to the tumor stage at diagnosis, several groups reported that osteosarcoma patients with metastases have a significantly worse survival prognosis.1,10,36,37 Patients with metastases may
have better relative outcomes if they had only lung metastases and underwent curative metastasectomy.8 Consistent with
these findings, we showed that osteosarcoma patients with distant metastases had a higher risk of death. We also identi-fied tumor grade and histology as independent prognostic for osteosarcoma patients, which is in line with previous stud-ies.38,39 Jawad et al26 demonstrated that Paget’s osteosarcoma
had significantly worse prognosis compared with all other histological subtypes. Their analysis of different histological subtypes confirmed the results reported by Damron et al.40
Jawad et al26 also reported that fibroblastic osteosarcoma had
significantly better prognosis compared with conventional osteosarcoma, which was similar to our results.
By integrating the abovementioned independent prog-nostic factors, we created progprog-nostic nomograms that offer an effective and functional method to estimate 3- and 5-year OS and CSS for osteosarcoma patients. These nomograms can improve the accuracy of predicting individual survival outcomes of osteosarcoma patients at certain time points.
Although the prognostic nomograms in the present study showed good predictive ability, there are some limitations which should be taken into consideration. First, the data on radiotherapy and chemotherapy were limited in the SEER database, which might have led to incompleteness of several meaningful clinicopathological parameters and caused other relevant bias. For this reason, chemotherapy or radiation use was not incorporated in our study. Second, since our study was retrospective, it is inevitable that certain patient data were missing. This might have decreased the number of eligible cases. Third, our findings will be more reliable if the nomogram model is externally validated using another inde-pendent, large-scale dataset; this would verify whether our results are universally applicable. Despite these limitations, our prognostic nomogram is a significant and effective model for accurately predicting the individual survival outcomes of osteosarcoma patients.
Conclusion
The present study identified age at diagnosis, tumor site, histology, tumor size, tumor stage, use of surgery, and tumor grade as independent prognostic variables for both the OS and CSS rates of osteosarcoma patients. These independent prognostic variables were integrated to build a nomogram prognosis evaluation model for osteosarcoma patients. These offer a more reliable and accurate prediction of osteosarcoma patient survival. Utilizing our nomogram, the 3- and 5-year OS and CSS rates for osteosarcoma patients can be estimated, enabling surgeons to assess personalized survival probability and identify mortality risk.
Acknowledgments
This study was supported by Guangzhou Science and Technol-ogy Project of China (grant no. 201607010021) and Science and Technology Planning Project of Guangdong Province, People’s Republic of China (grant no. 2014A020212571).
Disclosure
The authors report no conflicts of interest in this work.
References
1. Ritter J, Bielack SS. Osteosarcoma. Ann Oncol. 2010;21 Suppl 7(Suppl 7): vii320–vii325.
2. Mirabello L, Troisi RJ, Savage SA. International osteosarcoma incidence patterns in children and adolescents, middle ages and elderly persons.
Int J Cancer. 2009;125(1):229–234.
3. Bielack SS, Kempf-Bielack B, Delling G, et al. Prognostic factors in high-grade osteosarcoma of the extremities or trunk: an analysis of 1,702 patients treated on neoadjuvant cooperative osteosarcoma study group protocols. J Clin Oncol. 2002;20(3):776–790.
Cancer Management and Research downloaded from https://www.dovepress.com/ by 118.70.13.36 on 20-Aug-2020
Dovepress Prognostic nomogram to predict osteosarcoma survival 4. Eilber F, Giuliano A, Eckardt J, Patterson K, Moseley S, Goodnight J.
Adjuvant chemotherapy for osteosarcoma: a randomized prospective trial. J Clin Oncol. 1987;5(1):21–26.
5. Bacci G, Ferrari S, Bertoni F, et al. Long-term outcome for patients with nonmetastatic osteosarcoma of the extremity treated at the istituto orto-pedico rizzoli according to the istituto ortoorto-pedico rizzoli/osteosarcoma-2 protocol: an updated report. J Clin Oncol. 2000;18(24):4016–4027. 6. Ayerza MA, Muscolo DL, Aponte-Tinao LA, Farfalli G. Effect of
erro-neous surgical procedures on recurrence and survival rates for patients with osteosarcoma. Clin Orthop Relat Res. 2006;452:231–235. 7. Hong AM, Millington S, Ahern V, et al. Limb preservation surgery
with extracorporeal irradiation in the management of malignant bone tumor: the oncological outcomes of 101 patients. Ann Oncol. 2013;24(10):2676–2680.
8. Kager L, Zoubek A, Pötschger U, et al. Primary metastatic osteosar-coma: presentation and outcome of patients treated on neoadjuvant Cooperative Osteosarcoma Study Group protocols. J Clin Oncol. 2003;21(10):2011–2018.
9. Berner K, Hall KS, Monge OR, Weedon-Fekjær H, Zaikova O, Bruland ØS. Prognostic factors and treatment results of high-grade osteosar-coma in Norway: a scope beyond the “classical” patient. Sarcoma. 2015;2015:516843–14.
10. Clark JC, Dass CR, Choong PF. A review of clinical and molecu-lar prognostic factors in osteosarcoma. J Cancer Res Clin Oncol. 2008;134(3):281–297.
11. Wang W, Yang J, Wang Y, et al. Survival and prognostic factors in Chi-nese patients with osteosarcoma: 13-year experience in 365 patients treated at a single institution. Pathol Res Pract. 2017;213(2):119–125. 12. Dong F, Shen Y, Gao F, et al. Nomograms to predict individual prognosis of patients with primary small cell carcinoma of the bladder. J Cancer. 2018;9(7):1152–1164.
13. Zhou H, Zhang Y, Qiu Z, et al. Nomogram to predict cause-specific mortality in patients with surgically resected stage I non-small-cell lung cancer: a competing risk analysis. Clin Lung Cancer. 2018;19(2):e195–e203.
14. Narita Y, Kadowaki S, Oze I, et al. Establishment and validation of prognostic nomograms in first-line metastatic gastric cancer patients.
J Gastrointest Oncol. 2018;9(1):52–63.
15. Lin Z, Yan S, Zhang J, Pan Q. A Nomogram for distinction and poten-tial prediction of liver metastasis in breast cancer patients. J Cancer. 2018;9(12):2098–2106.
16. Li D, Zhong C, Tang X, Yu L, Ding K, Yuan Y. Competing nomograms help in the selection of elderly patients with colon cancer for adjuvant chemotherapy. J Cancer Res Clin Oncol. 2018;144(5):909–923. 17. Camp RL, Dolled-Filhart M, Rimm DL. X-tile: a new bio-informatics
tool for biomarker assessment and outcome-based cut-point optimiza-tion. Clin Cancer Res. 2004;10(21):7252–7259.
18. Giuffrida AY, Burgueno JE, Koniaris LG, Gutierrez JC, Duncan R, Scully SP. Chondrosarcoma in the United States (1973 to 2003): an analysis of 2890 cases from the SEER database. J Bone Joint Surg Am. 2009;91(5):1063–1072.
19. Harrell FE, Lee KL, Mark DB. Multivariable prognostic models: issues in developing models, evaluating assumptions and adequacy, and mea-suring and reducing errors. Stat Med. 1996;15(4):361–387.
20. Valentini V, van Stiphout RG, Lammering G, et al. Nomograms for predicting local recurrence, distant metastases, and overall survival for patients with locally advanced rectal cancer on the basis of European randomized clinical trials. J Clin Oncol. 2011;29(23):3163–3172. 21. Balachandran VP, Gonen M, Smith JJ, Dematteo RP. Nomograms in
oncology: more than meets the eye. Lancet Oncol. 2015;16(4):e173–e180.
22. Kim MS, Lee SY, Lee TR, et al. Prognostic nomogram for predicting the 5-year probability of developing metastasis after neo-adjuvant chemotherapy and definitive surgery for AJCC stage II extremity osteosarcoma. Ann Oncol. 2009;20(5):955–960.
23. Xia WK, Liu ZL, Shen D, Lin QF, Su J, Mao WD. Prognostic per-formance of pre-treatment NLR and PLR in patients suffering from osteosarcoma. World J Surg Oncol. 2016;14:127.
24. Kim SH, Shin KH, Kim HY, et al. Postoperative nomogram to predict the probability of metastasis in Enneking stage IIB extremity osteosarcoma.
BMC Cancer. 2014;14:666.
25. Song K, Song J, Shi X, et al. Development and validation of nomograms predicting overall and cancer-specific survival of spinal chondrosarcoma patients. Spine. 2018:1.
26. Jawad MU, Cheung MC, Clarke J, Koniaris LG, Scully SP. Osteosar-coma: improvement in survival limited to high-grade patients only.
J Cancer Res Clin Oncol. 2011;137(4):597–607.
27. Song WS, Kong CB, Jeon DG, et al. Prognosis of extremity osteosar-coma in patients aged 40–60 years: a cohort/case controlled study at a single institute. Eur J Surg Oncol. 2010;36(5):483–488.
28. Faisham WI, Mat Saad AZ, Alsaigh LN, et al. Prognostic factors and survival rate of osteosarcoma: a single-institution study. Asia Pac J Clin
Oncol. 2017;13(2):e104–e110.
29. Ek ET, Ojaimi J, Kitagawa Y, Choong PF. Outcome of patients with osteosarcoma over 40 years of age: is angiogenesis a marker of survival?
Int Semin Surg Oncol. 2006;3:7.
30. Bieling P, Rehan N, Winkler P, et al. Tumor size and prognosis in aggres-sively treated osteosarcoma. J Clin Oncol. 1996;14(3):848–858. 31. Bacci G, Longhi A, Versari M, Mercuri M, Briccoli A, Picci P.
Prognos-tic factors for osteosarcoma of the extremity treated with neoadjuvant chemotherapy: 15-year experience in 789 patients treated at a single institution. Cancer. 2006;106(5):1154–1161.
32. Seker MM, Seker A, Aksoy S, Ozdemir N, Uncu D, Zengin N. Clini-copathologic features and prognosis of osteosarcoma in Turkish adults.
Asian Pac J Cancer Prev. 2014;15(8):3537–3540.
33. Wang ZX, Qiu MZ, Jiang YM, Zhou ZW, Li GX, Xu RH. Comparison of prognostic nomograms based on different nodal staging systems in patients with resected gastric cancer. J Cancer. 2017;8(6):950–958. 34. Ozaki T, Flege S, Kevric M, et al. Osteosarcoma of the pelvis:
experi-ence of the Cooperative Osteosarcoma Study Group. J Clin Oncol. 2003;21(2):334–341.
35. Ozaki T, Flege S, Liljenqvist U, et al. Osteosarcoma of the spine: experience of the Cooperative Osteosarcoma Study Group. Cancer. 2002;94(4):1069–1077.
36. Bielack SS, Kempf-Bielack B, Delling G, et al. Prognostic factors in high-grade osteosarcoma of the extremities or trunk: an analysis of 1,702 patients treated on neoadjuvant cooperative osteosarcoma study group protocols. J Clin Oncol. 2002;20(3):776–790.
37. Janeway KA, Barkauskas DA, Krailo MD, et al. Outcome for adolescent and young adult patients with osteosarcoma: a report from the Children’s Oncology Group. Cancer. 2012;118(18):4597–4605.
38. Wang Z, Li S, Li Y, et al. Prognostic factors for survival among patients with primary bone sarcomas of small bones. Cancer Manag Res. 2018;10:1191–1199.
39. Arshi A, Sharim J, Park DY, et al. Prognostic determinants and treatment outcomes analysis of osteosarcoma and Ewing sarcoma of the spine.
Spine J. 2017;17(5):645–655.
40. Damron TA, Ward WG, Stewart A. Osteosarcoma, chondrosarcoma, and Ewing’s sarcoma: National Cancer Data Base Report. Clin Orthop
Relat Res. 2007;459:40–47.
Cancer Management and Research downloaded from https://www.dovepress.com/ by 118.70.13.36 on 20-Aug-2020
Dovepress
Cancer Management and Research
Publish your work in this journal
Submit your manuscript here: https://www.dovepress.com/cancer-management-and-research-journal
Cancer Management and Research is an international, peer-reviewed open access journal focusing on cancer research and the optimal use of preventative and integrated treatment interventions to achieve improved outcomes, enhanced survival and quality of life for the cancer patient. The manuscript management system is completely online and includes
a very quick and fair peer-review system, which is all easy to use. Visit http://www.dovepress.com/testimonials.php to read real quotes from published authors.
Dove
press
Zheng et al
Cancer Management and Research downloaded from https://www.dovepress.com/ by 118.70.13.36 on 20-Aug-2020