Missing Value Imputation in Multi Attribute Data Set
Minakshi Dr. Rajan Vohra Gimpy
Department of computer science Head of Department of (CSE&I.T) Department of computer science PDMCE , Bahadurgarh , Haryana PDMCE , Bahadurgarh , Haryana PDMCE , Bahadurgarh , Haryana
Abstract: Data mining has made a great progress in recent year but the problem of missing data or value has remained great challenge for data mining. Missing data or value in a datasets can affect the performance of classifier which leads to difficulty of extracting useful information from datasets Dataset taken for this work is student dataset that contains some missing values. The missing value are present in tm_10and tm_12.To impute theses missing value we use three techniques are used that are lit wise deletion, mean imputation, KNN imputation. After applying these techniques we have three imputed dataset. On these imputed dataset we apply classification algorithm c4.5/j48. In this work analyzes the performance of imputation methods using C4.5 classifier on the basis of accuracy for handling missing data or value. After that decide which imputation method is best to handle missing value. On the basis of experimental results accuracy KNN is greater than other two techniques. So, KNN imputation is a better way of handling missing value. Weka data mining tool is used for this analysis.
Keywords: Data mining, missing value, imputation technique, C4.5, Weka.
I.INTRODUCTION
Data mining refers to extracting knowledge from large amounts of data. The data may be spatial data, multimedia data, time series data, text data and web data. Data mining is the process of extraction of interesting, nontrivial, implicit, previously unknown and potentially useful patterns or knowledge from huge amounts of data. It is the set of activities used to find new, hidden or unexpected patterns in data or unusual patterns in data [1].
A.MISSING VALUES
Missing data might occur because the value is not relevant to a particular case, could not be recorded when the data was collected, or is ignored by users because of privacy concerns. Missing values lead to the difficulty of extracting useful information from that data set [2]. Missing data are the absence of data items that hide some information that may be important [1].Most of the real world databases are characterized by an unavoidable problem of incompleteness, in terms of missing or erroneous values. [3].
Type of missing data:
There is different type of missing value: MCAR
The term “Missing Completely at Random” refers to data where the missingness mechanism does not depend on the variable of interest, or any other variable, which is observed in the dataset. [4].
MAR Sometimes data might not be missing at random but may be termed as “Missing at Random”. We can consider an entry Xi as missing at random if the data meets the
requirement that missingness should not depend on the value of Xi after controlling for another variable. [6]. NAMR
If the data is not missing at random or informatively missing then it is termed as “Not missing at Random”. Such a situation occurs when the missingness mechanism depends on the actual value of missing data. [4].
Missing data imputation techniques litwise Deletion :
This method omits those cases (instances) with missing data and does analysis on the remains. Though it is the most common method, it has two obvious disadvantages: a) A substantial decrease in the size of dataset available for the analysis. b) Data are not always missing completely at random. [5].
Mean/Mode Imputation (MMI)
Replace a missing data with the mean (numeric attribute) or mode (nominal attribute) of all cases observed. To reduce the influence of exceptional data, median can also be used. This is one of the most common used methods [5]. K-Nearest Neighbor Imputation (KNN)
This method uses k-nearest neighbor algorithms to estimate and replace missing data. The main advantages of this method are that: a) it can estimate both qualitative attributes and quantitative attributes; b) It is not necessary to build a predictive model for each attribute with missing data, even does not build visible models [5]
Classification algorithm
Classification is a supervised learning method. It means that learning of classifier is supervised in that it is told to which class each training tuples belongs. Data classification is a two step process. In the first step, a classifier is build describing a predetermined set of data classes or concepts [6]. The data classification process has two phases, these are:-
Learning- Classification algorithm analyzed the training data. Classifier is represented in the form of classification rules. This phase is also viewed as learning of a mapping or function, Y=f(X) which predict the associated class label y of a given tuple X. [6].
Fig1: learning stage Trainingdata set
Classification algorithm
B. Classification- To estimates the accuracy of classification algorithm test data is used. If the accuracy is considered acceptable, the rules can be applied to classification of new data tuples. Accuracy of a classifier on a given test set is percentage of test set that are correctly classified by classifier. The associated class labels of each test tuples is compared with learning classifier class prediction for that tuple [6].
Fig2: classification algorithm
Decision tree induction: A decision tree is a tree in which each branch node represents a choice between a number of alternatives, and each leaf node represents a decision [7]. Decision tree is a flow chart like tree structure, where each internal node is denoted by rectangles and the leaf nodes are denoted by ovals. At each split in the tree, all input attributes are evaluated for their impact on the predictable attribute. [8]. It is the most commonly used algorithms because of its ease of implementation and easier to understand compared to other classification algorithm [9].
II. RESEARCH BACKGROUND
Liu peng , lie lei, in their paper “A Review of Missing Data Treatment Methods” Missing data is a common problem for data quality.. Popular methods for dealing with missing data and four comparative experiments about the effect of the methods are introduced. KNN, C4.5 and MMI are most common used methods for dealing with missing data these days [5].
Ms. r. malarvizhi , in their paper “K-NN Classifier Performs Better Than K-Means Clustering in Missing Value Imputation” K-Means and KNN methods provide fast and accurate ways of estimating missing values.KNN – based imputations provides for a robust and sensitive approach to estimating missing data [7].
Edgar Acuna, Caroline Rodriguez, in their paper “The treatment of missing values and its effect in the classifier accuracy” The presence of missing values in a dataset can affect the performance of a classifier constructed using that dataset as a training sample [10]
B. Mehala, P. Ranjit Jeba Thangaiah, and K. Vivekananda, in their paper “Selecting Scalable Algorithms to Deal with Missing Values” This work analyses the behavior and efficiency for missing data treatment: C4.5 algorithm to treat missing data and K-means for missing data imputation. [11].
Xiaoyuan su “Using Imputation Techniques to Help Learn Accurate Classifiers” The accuracy of classifiers produced by machine learning algorithms generally deteriorates if the
training data is incomplete, and preprocessing this data using simple imputation methods, such as mean imputation (MEI), does not generally produce much better classifiers. [12].
Maytal Saar-Tsechansky “Handling Missing Values when Applying Classification Models” This paper first compares several different methods—predictive value imputation, the distribution- based imputation used by C4.5, and using reduced models—for applying classification trees to instances with missing values[13] Meghali A. KalyankarProf. S. J. Alaspurka “data Mining Technique to Analyse the Metrological Data” Meteorological data mining is a form of data mining concerned with finding hidden patterns inside largely available meteorological data, so that the information retrieved can be transformed into usable knowledge.. [14] Bhavik Doshi, “Handling Missing Values” in Data Mining Missing Values and its problems are very common in the data cleaning process. Several methods have been proposed so as to process missing data in datasets and avoid problems caused by it. [4].
III. CONCEPTUAL FRAME WORK
In this work, we are taking student dataset that contain number of attributes such as state of domicile family income, 10th and 12 marks, category. In these records, some of data values are missing.
A. To impute these missing values, missing data techniques are used. Techniques that are used for imputing missing values are:
1. Ignore the tuples containing missing data.
2. Imputing the missing values by using attribute mean value.
3. Imputing the missing values by using KNN (K Nearest Neighbor).
Dataset
Fig3: Missing Value Imputation
B. After applying all of these techniques we get a three complete / imputed dataset. These datasets are input to the classification algorithm. Classification algorithm used for this is J48 or c4.5 classifier. This algorithm is applied on imputed dataset to analyze which is the best technique for handling the missing values.
Classification rule
Test data New data
Fig4: Apply Decision Tree Algo on Imputed Datasets
Flow diagram of whole methodology is shown below: This diagram explain that how missing value are imputed in missing data set by using three different imputation method such as lit wise deletion, mean imputation, knn imputation. After applying imputation method there are three imputed datasets on these dataset apply classification decision tree algorithm after getting result of c4.5 classifier compare all the imputation technique or method to find out which is best imputation method. This is done by calculated accuracy of each imputed datasets,
Fig5: Flow Diagram for Handling Missing Data
Dataset with missingvalue
Complete dataset 2
KNN imputation Replace missing value with mean
imputation Apply litwise deletion
Complete dataset3 Complete dataset 1
Apply decision tree algo (c 4.5/j48)
Confusion matrix and correctly classified instance in dataset3 dataset 1 Confusion matrix and
correctly classified instance in dataset 2
Confusion matrix and correctly classified instance in dataset1
Compare
DECISION TREE ALGO
(C 4.5)
DATA SET1 Accuracy
Accuracy DATASET2
IV. RESULT AND ANALYSIS
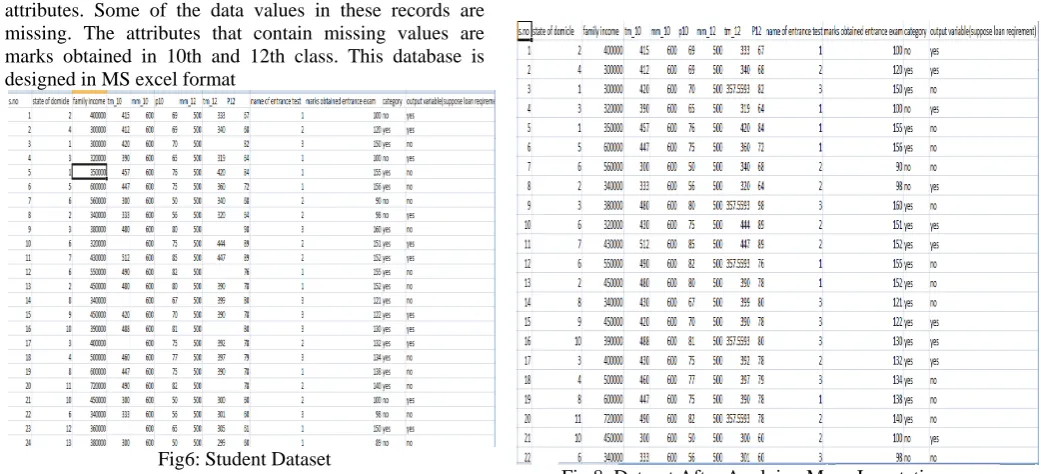
The database that is taken for this research work contains student records .These are 200 record of student having 13 attributes. Some of the data values in these records are missing. The attributes that contain missing values are marks obtained in 10th and 12th class. This database is designed in MS excel format
Fig6: Student Dataset
A. EXPERIMENTAL PROCEDURE
1. Missing Value Imputation
1.1) Lit wise deletion: This method consists of discarding all instances (cases) with missing values for at least one feature. A variation of this method consists of determining the extent of missing data on each instance and attribute, and deletes the instances and/or attributes with high levels of missing data.
Fig7: Dataset after Applying Lit Wise Deletion Technique
1.2) Mean imputation: This is one of the most frequently used methods. It consists of replacing the missing data for a given feature (attribute) by the mean of all known values of that attribute in the class where the instance with missing attribute belongs. In this we replace all the missing value with its mean.
Here Mean is calculated as:
Mean = sum of all the values/total number of values. Mean of tm_10 =430
Mean of tm_12=357.55
Fig 8: Dataset After Applying Mean Imputation
1.3) KNN imputation
In this method the missing values of an instance are imputed considering a given number of instances that are most similar to the instance of interest. The similarity of two instances is determined using a distance Function. The algorithm for k-nearest neighbor is as follows-
• Determine the value of K (Nearest neighbors). Here Value of K=5
• Calculate the distance between the missing value instance and other training instance. Here Euclidean distance is used for calculating the distance. Euclidean distance is given by the equation as:-
• After calculating the Euclidean distances choose the data values those having minimum distance. If the value of K is 5 then we have to choose 5 values that having minimum distance. Calculate the mean of these chosen values. The mean is given by the equation as:- • Calculate the mean of these chosen values. The mean
is given by the equation as:-
• Impute M as the output value for missing data.
KNN imputation (k=5)
Fig9: dataset after applying KNN imputation
1.2 After imputation datasets are converted into.csv format load these datasets into weka tool. The main weka explore interface with the data file loaded using preprocessing panel.
After applying lit wise deletion technique complete dataset is loaded into weka tool.
Fig10: Load litwise deletion dataset in weka tool
On imputed dataset apply classification algorithm. To perform classification ,select the “classification” tab in explore and click on the ”choose” button in this case we select “j48”classifier in the ”classification mode” panel, the” use cross validation” option is selected, and click on “start” button. This process and resulting window is shown below:
Fig11: Result of C4.5 Classifier for Lit wise Deletion
After applying mean imputation on missing data the complete data set is loaded into weka tool then perform classification , select “j48”classifier in the ”classification mode” panel, the” use 10 fold cross validation” option is selected, and click on “start” button.
Fig12: Result of C4.5 Classifier for Mean Imputation
Fig13: Result of C4.5 Classifier for KNN Imputation
B. EXPERIMENTAL RESULT
After applying this imputation technique we have three complete dataset in order to check which imputation technique is best we apply decision tree algorithm j48 in data mining tool weka. There many measure used for finding the which technique is best. Some of them are accuracy correctly classified instance, incorrectly classified instance, mean absolute error. Classification is evaluated by using confusion matrix.
Confusion matrix
A confusion matrix contains information about actual and predicted classifications done by a classification system. Performance of such systems is commonly evaluated using the data in the matrix. The following table shows the confusion matrix for a two class classifier [15].
Predicted classes
Actual classes
P N Table1: Confusion Matrix
• True positive (TP)- These are the positive tuples that were correctly labeled by the classifier [6].If the outcome from a prediction is p and the actual value is also p, then it is called a true positive (TP)[15]. • True Negative (TN)-These are the negative tuples that
were correctly labeled by the classifier [6].
• False Positive (FP)-These are the negative tuples that were incorrectly labeled as positive [6]. However if the actual value is n then it is said to be a false positive (FP) [15].
• False Negative (FN)-These are the positive tuples that were mislabeled as negative [6].
• Accuracy is calculated as = (TP+TN)/(P+N) where, P=TP+FN and N=FP+TN. Or TP+TN/(TOTAL).
Algorithm used C4.5 classifier Correctly classified instances Incorrectly classified instances Accura cy Mean absolute error
Litwise deletion 116 42 73% 0.3296
Mean
imputation 145 55 72.5 0.3162
KNN
imputation 149 51 74.5 0.3011
Table2: Comparison of Imputation Techniques using C4.5 Classification Algorithm
According to experimental results, correctly classified instances for Litwise deletion is 116 and for mean/mode imputation is 145.Correctly classified instances for KNN imputation is 149 which is greater than previous two algorithms. Accuracy of KNN is 74.5% which is also greater than other two techniques so KNN is best technique to handle missing value in data set.
V. CONCLUSION
Missing values in the dataset are big problem so missing value must be imputed before the dataset is used. In this work we have taken a student dataset in which some of the values are missing. To impute these missing values three techniques are used named as Litwise deletion, mean/mode imputation, KNN (k nearest neighbor). Apply these missing techniques individually on this dataset, which results as three complete/imputed datasets. Then imputed datasets are loaded into weka tool. Then C4.5/J48 classification algorithm is applied to these imputed datasets and their results are compared in order to evaluate accuracy of imputation techniques and KNN accuracy is greater than other two techniques. KNN imputation is a better technique to impute missing value.
FUTURE SCOPE:
New missing data imputation techniques can be used for further data analysis. Also estimate the missing value by using clustering and classification. Various new problems using missing data analysis can be designed and solved. Different classification algorithm can be used for comparative analysis missing data imputation techniques. Missing data Imputation technique can be implemented in matlab.
ACKNOWLEDGEMENTS
Author would like to thanks to her head Dr. Rajan Vohra, Head Of Department of CSE & I.T department, PDMCE, Bahadurgarh for their valuable support and help
REFERENCES
[1] Dinesh J. Prajapati ,Jagruti H. Prajapat, “Handling Missing Values: Application to University Data Set” .Issue 1, Vol.1 (August-2011), ISSN 2249-6149. .
[2] Luai Al Shalabi, Mohannad Najjar and Ahmad Al Kayed, A framework to Deal with Missing Data in Data Sets . Journal of Computer Science 2 (9): 740-745, 2006 ISSN 1549-363.
[3] Alireza Farhangfara , Lukasz Kurganb , Witold Pedrycz “Experimental analysis of methods for imputation of missing values in databases
[4] Bhavik Doshi, Handling Missing Values in Data Mining. Data TP FP
[5] Liu Peng, Lei Lei , A Review of Missing Data Treatment Methods [6] Jiawei Han, Micheline Kamber, Jian Pei, “Data Mining Concepts
and Techniques” Third edition .
[7] Ms.R.Malarvizhi, Dr.Antony Selvadoss Thanaman, “K-NN Classifier Performs Better Than K-Means Clustering in Missing Value Imputation”, IOSR Journal of Computer Engineering [8] Anjana Gosain, AmitKumar,” Analysis of Health Care Data Using
Different Data Mining Techniques”. lAMA 2009.
[9] Sharad Verma, Nikita Jain,” Implementation of ID3 – Decision Tree Algorithm”.
[10] Edgar Acuna, Caroline Rodriguez, “The treatment of missing values and its effect in the classifier accuracy”.
[11] B. Mehala1 P. Ranjit Jeba Thangaiah2, and K. Vivekanandan,” Selecting Scalable Algorithms to Deal With Missing Values”,
International Journal of Recent Trends in Engineering, Vol. 1, No. 2, May 2009
[12] Xiaoyuan Su,” Using Imputation Techniques to Help Learn Accurate Classifiers”
[13] Maytal Saar-Tsechansky, “Handling Missing Values when Applying Classification Models “, journal of Machine Learning Research 8 (2007) 1625-1657
[14] Meghali A. KalyankarProf. S. J. Alaspurka, “data Mining Technique to Analyse the Metrological Data”