A new method for measuring fabric drape
with a novel parameter for classifying fabrics
Ning Pan a,*, Chengwei Lin a and Jun Xu b
a Division and Textile and Clothing
Department of Biological and Agricultural Engineering, University of California at Davis, CA 95616, USA
b College of Clothing, Northwest Polytechnic University
Xian, Shanxi, 710048, China
*Corresponding author: [email protected]
Key Words: Fabric classification; Fabric drape; Cusick Drapemeter; PhabrOmeter; Directional and side effects.
Abstract
With huge varieties of fabrics, the first challenge for any performance evaluation is to categorize the vast types of the products into fewer, more homogeneous and thus akin groups. Classification or sorting is arguably the first step of any scientific investigation, and comparison of product quality is meaningful only when conducted within a group of comparable products. A new criterion termed fabric linear density λ is first proposed in this paper so that fabrics can in general be divided into 4 groups. The derivation and validation of this parameter are provided.
The importance of fabric drape is almost self-evident, but there is still no effective ways to measure this fabric attribute. The Cusick Drapemeter suffers from its low repeatability and low sensitivity, and is hence not widely or frequently used. The PhabrOmeter, along with the fabric linear density λ, is proposed and demonstrated in this study as a much more efficient alternative for fabric drape test. By actually testing 40 various fabrics, the principle, procedure and results of this method is presented in this paper.
Introduction
Visual attributes of textile fabrics represent a sub-group of sensory properties, perceived particularly by visual sense of consumers. Such visual qualities include fabric drape, surface state and luster, and, by logical extension, the fabric wrinkle recovery, fabric surface retention and stain resistance, i.e., all fabric appearance related esthetic characteristics. We call them fabric attributes to differentiate from the term fabric properties such as the fabric weight and fabric strength, for the latters are much easier to describe and with definitions widely accepted, and measurement methods well established.
Fabric drape refers to the fabric shape or profile when held at the edge, such as used for curtains, or the way a fabric covers an object when used as a tablecloth or a skirt, often refereed to in the latter cases as the fabric formability, and is resulted from fabric’s response towards gravity due to its own weight [2, 3].
The current approaches in evaluating such quality attributes including drape are still quite primitive, lagging far behind the need for fast product development by the industry and for short product turn over time in the apparel market. They still largely rely on human sensory judgment, which in many cases is not readily reproducible and repeatable. It is interesting to note that the major fabric sensory attributes, hand, drape and wrinkle recovery, are interconnected and determined by the same group of mechanical properties [1, 4], thus laying down a foundation for instrumental measurement. Because of this close interconnectivity, it is possible that the same instrument properly configured can measure all such fabric attributes. Although there have been many attempts to develop instrumental means to measure such fabric attributes, but the resulted methods are not effective enough to meet the industrial requirements.
Specifically, there has been a long history of research on measurement of fabric drape. Pierce[1] for instance proposed several simple methods including the “cantilever” and “loop” sample shapes to measure the bending resistance as “… strictly a measure of the draping quality of a fabric.” Such approaches have been reflected in several existing AATCC and ASTM standard tests. However Chu later pointed out that “two-dimensional distortion tests are incapable of differentiating between drape and paperiness- i.e., it is possible to select a piece of paper and a piece of fabric both of which have the same bending properties, yet it is doubtful that the paper will drape as well as the cloth.” [2]
A very thorough study of fabric drape was done by Cusick [3] and Hearle provided a comprehensive review of existing research on the subject [5]. Fabric drape was considered to be determined primarily not only by its bending but also shear resistance, and in that order [3, 5]. So now we know that it is the shear properties that differentiate between a piece of paper and a fabric. Then there is a review article in 1987 by Jacob and Subramaniam on the literature of fabric drape [6]. For instance, multiple regression analysis was used to determine whether certain deformation properties (stiffness, shear, extensibility) and structural characteristics (fabric weight, thickness, and density) can serve as reliable predictors of the drape of knitted fabrics [7]. Several studies focused on static and dynamic drape of fabrics[8-10]. There are also reported investigations on the draping behaviors of multi-layer textiles using digital image processing[11, 12]. As expected, the challenging question of theoretical modeling of fabric drape phenomena has attracted much interest [13-16] [17-27].
Searching and exploration for a better instrument for fabric drape test has been continuing up to this day, but only very few commercial products are available, notably the Fabric Drape Tester (better known as the Cusick Drapemeter [3] or Chu method [2] ), by tracing the shadow of a draped fabric on paper. However this test suffers from several shortcomings including low repeatability and low sensitivity [28-30] and thus has not been widely used by, for instance, the U.S. industry. It is a bit surprising that there is even not a U.S. standard for fabric drape test, a grave gap urgently required to fill. For anyone who has the experience of using the Cusick Drapemeter, several problems become immediately clear, including:
warp and filling, is a reasonable number.” [2]. Knowing fabrics are anisotropic, one may argue why not in other directions?
2. Low sensitivity - only significant difference in fabric drape can be detected; 3. Slow and cumbersome test process;
4. Many fabrics tend to curl and twist when cut into small specimens, and this further affects the reproducibility, and even the physical meaning of the test results;
5. Large amount of samples required: 30 cm in diameter. If 5 each in both warp and filling directions, that is too much fabric to ask for in many cases.
Although there have been variations [28, 29, 31, 32]of the Cusick Drapemeter, attempting to eliminate or alleviate some of the problems in the original design; however none of them seems to have improved to such degree that a commercial model has been widely accepted by the industrial users. Imaging analysis has been [11, 33-36] been applied to the test, but it can only improve the analysis of the results but can do little in dealing the problems intrinsic in the test principles.
On the other hand and as a result of research by Pan and his coworkers since 1983 [4, 37, 38], a new instrument called PhabrOmeter fabric test system [39]has been developed, as shown in Fig. 1, and commercialized to evaluate sensory attributes of various types of fibrous sheets. Unlike the Japanese KES system, no attempt is made to separately measure individual fabric properties (such as bending, compression, tensile and surface properties) deemed to be associated with fabric sensory attributes. Instead, this instrument is based on the previously proposed fabric extraction method [4]: a force-displacement curve, Fig. 1(b), is thus generated during the fabric extraction process, which has been shown to be related to the bending, biaxial extension, creasing and dynamic friction properties of fabrics [4, 37, 38]. Then a computer algorithm was developed based on the pattern recognition technique to derive a series of parameters defining fabric hand, including a Relative Hand Value, the fabric Softness, Smoothness, and Stiffness etc. The instrument has been adopted by various companies in major countries, and some successful applications have been reported [40, 41]. In addition, an AATCC standard test method for the PhabrOmeter, AATCC TM202, has been devised to guide the users[42].
It has long been established that fabric hand is closely related to its drape-ability [1, 43]. Given the fact that during an extraction process on the PhabrOmeter, the fabric sample is going through a forced drape with complex yet low stress state (Fig. 1(c)). It is only logical to examine the potential for PhabrOmeter to be applied to fabric drape measurement. An added feature of using PhabrOmeter for fabric drape test is that as the sample is cut into circular shape and extracted by a force exerted at the sample center, it thus “isotropicizes” the measurement process and eliminate the sample directional effect – a problem severely plagued the results from the Cusick Drapemeter.
A new criterion for fabric classification
There is no formally established fabric classification scheme, and some parameters including weave types, fabric weight and thickness have often been used expediently in categorizing fabrics. The Japanese Kawabata’s KES system approached this problem by first choosing fabrics for the same applications, and then grouping them based on the fabric weight. Table 1 shows the four groups officially established first for the Japanese system [44].
Table 1 the major fabric categories for the Japanese system [44]
Men’s Women’s
Winter suits Summer suits Medium-thickness dress Thin-dress
In comparison, there are a couple of general differences between the two systems of PhabrOmeter and KES. One of them is that PhabrOmeter has been applied to cover much wider range of products, including textile fabrics, nonwovens and paper tissues so that just using the product applications as a criterion for classification over such huge product range with innumerous and ever increasing applications is unrealistic. More general and representative criteria have to be established. Furthermore, product thickness is a critical parameter of broad range over various products, but was ignored in the KES system. Here are the rules we have developed on how to establish such general parameter(s), by which all the products can be classified into groups that make sense first and easy to use as well:
1. As the most fundamental parameters in determining fabric performance, both fabric weight and thickness should be included in the resultant parameter;
2. In developing PhabrOmeter, it is known that in such fabric extraction method, the fabric compaction density in the nozzle in Fig. 1(c) is the key factor [45, 46] in generating the test results. As increasing either fabric weight or thickness will lead to an increased fabric compaction density, both fabric weight and thickness affect the resultant parameter in the same trend;
3. Structural differences (weaves, fiber types etc.) can be specified afterwards within each resultant group, if necessary.
According to Rule 1, the actual fabric volumetric density ρ (weight/volume) becomes the first logical candidate:
ρ
=
W
T
(1)where W is the fabric weight (weight/area), and T is the fabric thickness (length). However, use of ρ will violate the second rule, i.e., both fabric weight and thickness have to influence the result in the same trend. Alternatively we can define a parameterλ:
λ
=
W
×
T
(2)
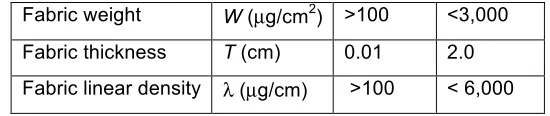
In this case, change either fabric weight or thickness will alter the λ value in the same trend, thus satisfying both rules. λ has the unit of (weight/length) and is hence termed the linear density. Table 2 provides the normal possible ranges for the three quantities specified in PhabrOmeter, covering most commercial fibrous sheet products.
Table 2. The possible ranges of fabric parameters*
Fabric weight W (µg/cm2) >100 <3,000 Fabric thickness T (cm) 0.01 2.0 Fabric linear density λ (µg/cm) >100 < 6,000 * Estimated data.
Although λvalue is a linear function of either W or T, we cannot classify all products by evenly dividing the λ value for there is no proof that λ value is evenly distributed over the entire scope. It is conceivable that over the possible fabric ranges, there are fewer extremes in both ends and more in the center; in other words, a normal distribution of λ would be a more acceptable assumption. The division shown in Table 3 is the grouping result based on this consideration, currently used in PhabrOmeter.
Table 3 Different major fabric groups based on possible λ values
Groups Super light (S) Light (L) Medium (M) Heavy (H)
λ (µg/cm) < 280 280 ~ 1,200 1,201 ~ 3,440 > 3,440
As it is less meaningful to compare samples from different groups, all data processing, calculations, transformations and comparisons should be conducted within each major group. Of course, fabric classification is a hugely complex issue and the groups shown in Table 3 are just general yet useful results. It may be practiced to further classify products in the same major group into subgroups if deemed necessary.
For this project, 40 fabrics of various types have been collected from Cotton Inc. Based on their λvalues, the 40 fabrics were found to span over all 4 major groups (S=2), (L=27), (M=10) and (H=1), as listed in Table 4:
Table 4. Groups for collected fabrics
Groups Super light (S) - 2 Light (L) - 27 Medium (M) - 10 Heavy (H) - 1 Fabrics #26, #38 #1~#14,#18~#20,#22~#25,
#29,#30, #34,#36, #39,#40
#15~#17,#21,#27,#28, #32,#33,#35,#37
#31
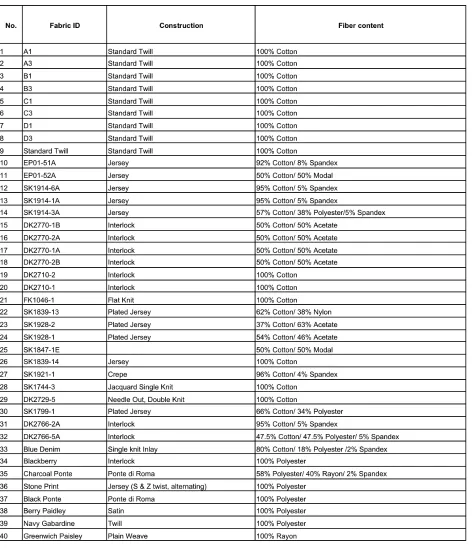
Samples and test methods
40 fabrics of various types have been provided along with the specifications by Cotton Inc., as shown in Table 5, 38 of them with the Cusick drape data using the imaging approach of Option B in ISO 9073-9:2008, and the drape data for Samples 9 and 10 are not available. UC Davis lab conducted/repeated the following experiments on all 40 fabrics including: fabric thickness (ASTM D1777), and fabric weight (ASTM D3776). We also tested all 40 fabrics using Cusick method in following steps:
• Option A in ISO 9073-9:2008 was followed, using 30 cm specimen diameter.
• Three specimens for each fabric were tested on each side (face and back), so a total of 6 data obtained for the fabric.
• For each of the six readings from a given fabric, a drape coefficient value D was calculated as
(3)
where mt is the original weight of the paper ring, and ms the weight of shadowed area only. Six D values were then averaged to yield the mean drape coefficient for the fabric.
€
D
(%)
=
m
s• Note that in Option A, the area equaling to the center-plate was not included in the calculation since what we weighted is only the paper ring without the center-circle part. Therefore, when the specimen is very limp (the shadow area is very small), the drape coefficient could be very small (theoretically down to 0%). So, to be consistent with Option B the Cotton Inc. used, we also rectified the UCD data by making mt equal to the weight of a paper of circular shape with the same diameter to the outer diameter of the paper ring (i.e., adding the weight of the center-part of the paper ring) in the calculation, so that all our Cusick data were increased, with a minimum for Sample #33 from 20.7% raised to 38.8%.
Also according to ISO 9073-9:2008 standard, different diameters should be adopted for certain types of fabric in order to make the test consistent with the real condition. However, the document also stated that “ Results obtained on test specimens of different diameters are not directly comparable, in all cases, tests also need to be carried out on a 30 cm diameter test specimen, regardless of the drape coefficient.” Thus all UCD Cusick data were obtained using 30 cm specimen diameter only.
Measurement by PhabrOmeter
The fabric extraction method used in PhabrOmeter simulates the related fabric behaviors and closely imitates the processes – during a test, the fabric sample is actually going through a forced drape under complex stresses. Also fabric hand and drape are interconnected by the same group of mechanical properties [5]. It is therefore proposed here to use the PhabrOmeter as a tool to measure the sample drape. To save space and avoid repetition, a more detailed theoretical background on the principle can be found in [4, 5]. The high repeatability, sensitivity and fast test speed of PhabrOmeter provides high potential to replace some of the existing but less effective test methods in evaluating the fabric drape in a much more consistent way.
Sample is cut into the circular shape of 100cm2 area using a standard cutter and mounted onto a secure sample holder in PhabrOmeter. Once ready to operate the instrument, the computer will prompt for both fabric weight and thickness so that the linear density λ value for this sample is calculated. Accordingly the sample is assign to the corresponding density group in Table 4 for subsequent testing and analysis. User has the option to input other specifications for the sample so that finer grouping, if needed, can be done easily in computer.
Among other outputs after the sample is tested, the fabric drape coefficient will be displayed or saved into a data file. The details on testing operation and data generation can refer to the PhabrOmeter User Manual [39].
Data analysis
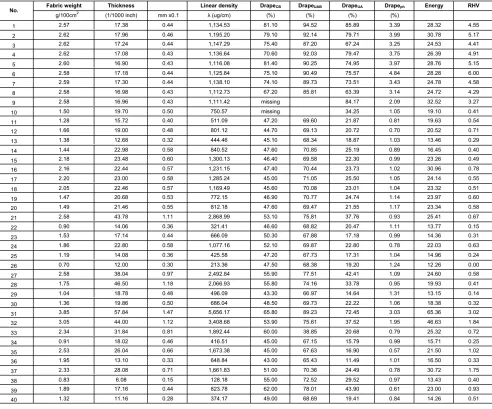
Once done with actual measurements, we have following kinds of data in Table 5b related to drape:
1. Fabric linear density λ values calculated from Eq. 2;
2. Cusick data DrapeCB based on Option B in ISO 9073-9:2008 by Cotton Inc;
3. Cusick data DrapeUA based on Option A in ISO 9073-9:2008 by UCD;
4. DrapeUAB UCD Cusick Option A data rectified to Option B;
5. PhabrOmeter drape data DrapePh by UCD;
A series of analysis listed below is conducted on them to reveal the important information, implication and relationships of the fabrics tested regarding the fabric drape behaviors.
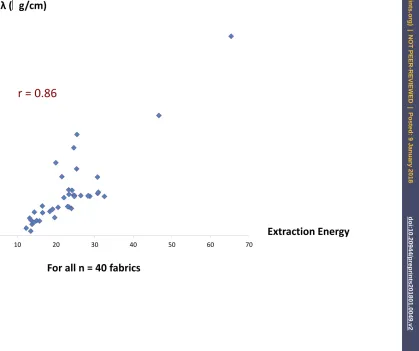
As shown above, λ is the fabric classifier currently adopted by PhabrOmeter, and is studied here to further confirm its usefulness. To validate the rationality of using value λ, we use the area under the extraction curve (Extraction energy) as a representation of the energy required to extract the sample through the testing ring and calculated by PhabrOmeter in Table 5b. Fig. 2 shows the connection between fabric weight W and the Extraction energy, and Fig. 3 between thickness T and Extraction energy, for all 40 fabrics. It is clear in both figures that increasing either fabric weight or thickness will increase the fabric compaction density during extraction, thus the Extraction energy: i.e., both have to be considered when classifying fabrics. Whereas the fabric linear density λ, which shows in Fig. 4 a correlation r = 0.86 with the Extraction energy, higher than either fabric weight or thickness yet incorporating both, is a more comprehensive fabric describer.
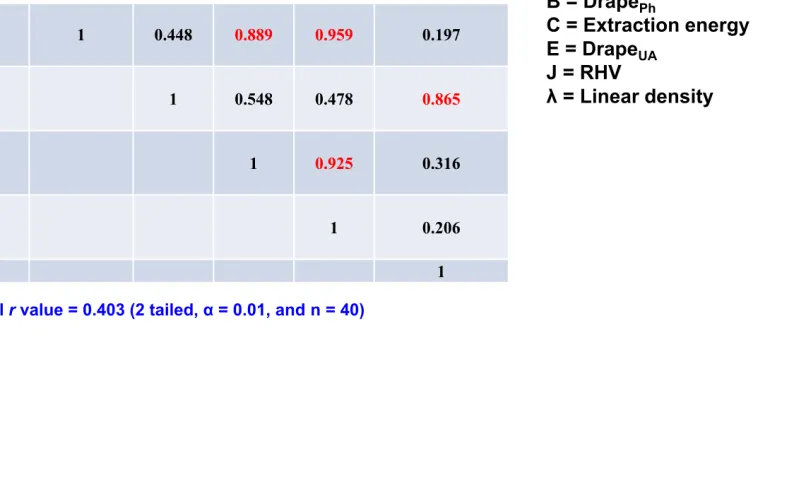
It may help further explore the validity of this linear density acting as the primary factor in representing fabric properties, by analyzing the connection between the linear density λ and other fabric parameters provided in Table 6, where DrapePh and DrapeUA are the UCD fabric
drape coefficients measured by PhabrOmeter and Cusick methods respectively; Energy is the fabric Extraction energy and RHV is the Relative fabric hand value when #26 (RHV=0) was chosen as the reference [39]. It is shown clearly in the table that:
• DrapePh , DrapeUA and RHV are correlated highly with each other;
• Extraction energy correlates more significantly only with the Linear density;
Here are some possible explanations. The Extraction energy and Linear density, both being more intrinsic material properties in describing the fabric extraction process, are thus well connected with each other, are much less related to other three; whereas DrapePh, DrapeUA and
RHV are more extrinsic properties, each highly correlated with the other two among themselves.
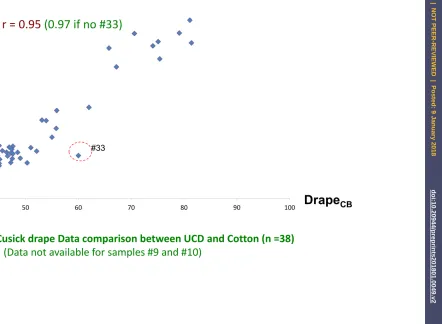
b) Comparison of drape data
When comparing with the Cusick drape data from Cotton Inc., where drape data are not available for Samples 9 and 10, only n = 38 samples are involved. Fig. 5 presents the results between the Cusick drape data from Cotton Inc. versus UCD. A very good agreement is exhibited with a correlation as high as r = 0.95. This suggests that data from both Options A and B, ISO 9073-9:2008, used by UCD and Cotton Inc., respectively, are consistent. The outlier #33 is a single knit Inlay that appeared to have yielded an irregular drape data either too high (from Cotton Inc.) or too low (from UCD).
Fig. 6 is the same plot as Fig. 5, except the rectified UCD drape data are used. A very decent linear relation between the two group data is shown if excluding #33. If fact, the existence of #33 led to a big drop of correlation from r = 0.97 to r = 0.77. Overall, these data suggest that both Cotton Inc. and UCD Cusick data are consistent, and data rectification doesn’t seem to yield noticeable improvement. So, despite the problems with the Cusick test method discussed before, the data can serve as a reference when in comparison with PhabrOmeter drape data for at least the 40 fabrics given.
Fig. 7 uses the drape data DrapePh by the PhabrOmeter method against the Cusick drape data
for the 38 fabrics from Cotton Inc. DrapeCB. Again a high correlation r = 0.88 (r = 0.91 if
excluding # 39) exists between the two groups of data, indicating that the PhabrOmeter drape data represent the fabric drape performance just as well as the Cusick drape data. Similar conclusion can be drawn from Fig. 8 where the PhabrOmeter data DrapePh are plotted against
the UCD Cusick drape data DrapeUA for all n = 40 fabrics with r = 0.89 (r = 0.91 if excluding #
In discussing the outliers, it is noted that from the figures, in addition to #33 and #39, Sample #9 in Fig. 8 may also be problematic. As from Table 5a, #9 is a 100% cotton, standard twill, but careful examination found that there seems some coating or special finish on the surface to rend it more rigid than Samples #1 ~ #8, otherwise identical fabrics of 100% cotton, standard twill. As there is no Cusick data for #9 from Cotton Inc., so #9 only appeared once in Fig. 8 where all 40 fabrics were involved, and so there is insufficient information to further examine #9. Whereas #33 is a single knit Inlay fabric and #39 100% polyester, very loose twill: both are highly stretchy fabrics. Note that fabric curl, a tough problem in Cusick method, is no longer a concern in conducting PhabrOmeter test.
c) Factors influencing fabric drape measurement
So far we have concluded that Cusick drape data following either Option A or Option B in ISO 9073-9:2008 are consistent. Also PhabrOmeter can be used to measure fabric drape properties effectively. As the samples are forced to drape, different sample diameters recommended in Cusick test are no longer necessary, and fabric curl, a tough problem in Cusick method, is no longer a concern for PhabrOmeter. There are still other factors that may cause errors in fabric drape determination, as investigated below.
i. The grouping effect
One of the remained issues is whether we should use all 40 fabrics as a single group to test/compare fabric drape behavior or divide them into subgroups for more thorough examination. As expected, if we divide all fabrics into more similar and thus smaller groups, there will be higher agreement between the test results, which on the other hand will increase the complicity of the entire test and analysis process – a compromise is therefore desirable. We use 3 groups classified by fabric linear density discussed above to study such grouping influence:
• All (40 fabrics), Group 2 (27 light fabrics only), Group 3 (11 Medium and heavy fabrics);
• Two fabrics #26 and #38 in the Super light Group, and #31 in Heavy Group are eliminated from comparison;
• We used PhabrOmeter to test the drape data to explore the grouping effect associated with linear density λ.
The comparison between drape data DrapePh and fabric linear density when all 40 fabrics
forming a single group is provided in Fig. 9a. A disappointing correlation of r = 0.197 suggests that it is not a good idea to put fabrics of different types into one group to compare their drape behaviors. Once divided into smaller groups however based on the fabric linear density λ, Group 2 (27 light fabrics only) shows an increased r value to 0.696 in Fig. 9b, and further to 0.901 in Group 3 (11 Medium and heavy fabrics) in Fig. 9c. That is, grouping fabrics based on linear density indeed improves performance comparability.
ii. Construction type effect
An often used grouping criterion is the fabric construction types, i.e., woven, knits or nonwoven. There are only two construction types out of the 40 fabrics, 13 wovens and 27 knits. We used again correlation analysis to examine if construction based grouping improves the results. Note that as this grouping based on construction mixed the different fabric linear density λvalues into the same group, we have to use the Cusick drape data DrapeUA in comparison.
and r = 0.785 for the knit group. That is, grouping fabrics based on construction type doesn’t seem to improve the consistence.
iii. Effect of fiber types
Another general grouping scheme is based on fiber types. This way the 40 fabrics can have 3 categories - 15 of pure cotton, 19 of cotton blend, the remaining 6 are of manufactured fibers (5 polyester and 1 rayon). Again comparing their drape data measured by Cusick and PhabrOmeter methods, the resulted correlations are: r = 0.838 within the pure cotton group, r = 0.554 for the cotton blend group, and r = 0.545 for the synthetic group. In other words, grouping based on fiber type doesn’t seem to be a very useful option here either.
iv. Side and direction effects
Next we conducted studies to look into some extremely loose, limp and stretchy fabrics for which test results often appear irregular. There are several factors that may contribute to such test errors and we tackled the problems of testing direction and sample side, which appeared to be more influential. There are fabrics that tend to exhibit different behaviors when tested at different directions, so called material anisotropy, although by cutting specimens into circular shape when using PhabrOmeter, we have more or less “isotropicized” the specimen and thus alleviated the problem. Here are the steps followed:
• Selected 18 most loose, limp and stretchy fabrics out of the 40 fabric set;
• Followed Option A in ISO 9073-9:2008 for Cusick drape test, as directionality is not a problem for PhabrOmeter;
• Tested by aligning a sample at 3 different directions, 0o, 45o, 90o, angles between warp
and the instrument width directions;
• Tested both face and back sides.
It is clear from the data that both testing direction and specimen side can impact testing results. For instance in Fig. 10a forSample #36, a 100% polyester jersey with alternating S and Z twist in yarns, where the tested average drape coefficient is 10.66 (0o) and 16. 26 (90o), differing by
more than 50%! Yet this same sample shows a moderate variation between face and back sides, with highest difference at 90o of 16.774 (face) and 15.754 (back). On the other hand, in
Fig. 10b for Sample #23, a 37% cotton/ 63% acetate, plated jersey, it produced negligible direction effect but significant side effect. Overall Sample #30 in Fig. 10c generated the highest direction related error, and Sample #29 in Fig. 10d the highest side error.
However throughout our testing, it is the Sample #33 that has constantly displayed a peculiar drape behavior. In the original data from our first around of Cusick test, it resulted in a value of 20.6. But in our second around of testing in examining the directional effect, the values for the 3 testing directions (0 o, 45 o, 90 o) are 35.4, 34.54 and 33.61 respectively, exhibiting large
discrepancy between two testing times. After carefully checking our test procedures, we affirmed that all the data are reliable. By examining the fabric itself, we found a few possible causes:
• Being a single knit Inlay, #33 is a highly unstable structure. If not handled or even stored with extra caution during the period of whole process, inadvertent alternation of the fabric structure will lead to testing variations;
• Sample #33 has an extremely high 1,852.4% fabric stretch. It is hard to predict if there is any residual deformation left in a sample from previous stressing, resulting in changes in properties;
Conclusions
The fabric linear density λ defined in this paper is an intrinsic fabric parameter by definition, that reflects the influence of both fabric weight and thickness on fabric extraction using PhabrOmeter, is related closely to a series of fabric properties, and is easy to calculate. Our results demonstrated that grouping fabrics based on this linear density indeed improves performance comparability. With the validation presented in this study, other major parameters including fabric weave and fiber type don’t show any conflicts with or supersedes over the fabric linear density λ . We hence recommend that it be used more widely as a primary fabric classifier.
Regarding fabric drape test using Cusick Drapemeter (ISO 9073-9:2008), our data confirm that both Option A, and Option B are consistent. This study further demonstrated that using PhabrOmeter to measure fabric drape properties is a more reliable and effective approach - it is quick, sensitive with high repeatability. In addition, it has the additional characteristics:
• cutting specimens into circular shape and being extracted during test by a force exerted at the sample center actually “isotropicize” the measurement process to reduce the variation caused by fabric directionality or anisotropies;
• as the samples are forced to drape, different sample diameters recommended in Cusick test are no longer necessary;
• fabric curl, a tough problem in Cusick method, is no longer a concern for PhabrOmeter when the sample is actively compressed during test.
On the other hand, this approach will not be sensitive if fabric directionality or curling is of interest to be studied, which unfortunately is not handled well using Cusick approach either.
Before conducting drape test, the test face should be identified and recorded to maintain consistence. Face/back sides can lead to significantly different results.
Comparing the drape behaviors of different fabric types is not appropriate, and dividing them into more homogeneous groups, e.g., using fabric linear density λ can make such comparison more meaniful. Logically once in the same group defined by fabric linear density λ, further grouping based on fabric structure and fiber types can be done, if necessary. Our results here show however, such further division doesn’t result in much improvement.
Acknowledgement:
References Cited:
1.
Peirce, F.T., The handle of cloth as a measurable quantity. , J. Text. Inst. , 1930.
21
: p.
T377-416
2.
Chu, C.C., C.L. Cummings, and N.A. Teixeira, Mechanics of elastic performance of
textile materials .5. A study of the factors affecting the drape of fabrics - the
development of a drape meter. Textile Research Journal, 1950.
20
(8): p. 539-548.
3.
Cusick, G.E., Measurement of fabric drape. Journal of the Textile Institute, 1968.
59
(6): p. 253.
4.
Pan, N., Quantification and evaluation of human tactile sense towards fabrics.
International Journal of Design and Nature 2006.
1
: p. 48–60.
5.
Hearle, J.W.S., P. Grosberg, and S. Backer, Structural Mechanics of Yarns and Fabrics.
1969, New York: Wiley-Interscience.
6.
Jacob, M. and V. Subramaniam, A review of the literature on drape and pilling
properties of textile fabrics. Colourage, 1987.
34
(1): p. 21-22.
7.
Gaucher, M.L., M.W. King, and B. Johnston, Predicting the drape coefficient of knitted
fabrics. Textile Research Journal, 1983.
53
(5): p. 297-303.
8.
Stylios, G.K. and R. Zhu, The characterisation of the static and dynamic drape of
fabrics. Journal of the Textile Institute, 1997.
88
(4): p. 465-475.
9.
Postle, J.R. and R. Postle, The dynamics of fabric drape. Textile Research Journal,
1999.
69
(9): p. 623-629.
10.
Matsudaira, M., Study on static and dynamic drape coefficients of fabrics. Sen-I
Gakkaishi, 2003.
59
(9): p. P306-P310.
11.
Taha, I., Y. Abdin, and S. Ebeid, Analysis of the Draping Behaviour of Multi-Layer
Textiles using Digital Image Processing. Polymers & Polymer Composites, 2012.
20
(9): p. 837-843.
12.
Dobrich, O., et al., Analysis and finite element simulation of the draping process of
multilayer knit structures and the effects of a localized fixation. Advanced Composite
Materials, 2013.
22
(3): p. 175-189.
13.
Dhande, S.G., et al., Geometric modeling of draped fabric surfaces, in Graphics, Design
and Visualization, S.P. Mudur and S.N. Pattanaik, Editors. 1993. p. 349-356.
14.
Chen, B.J. and M. Govindaraj, A physically-based model of fabric drape using flexible
shell theory. Textile Research Journal, 1995.
65
(6): p. 324-330.
15.
Stump, D.M. and W.B. Fraser, A simplified model of fabric drape based on ring theory.
Textile Research Journal, 1996.
66
(8): p. 506-514.
16.
Chen, M.X., Q.P. Sun, and M.F. Yuen, Simulation of fabric drape using a thin plate
element with finite rotation. Acta Mechanica Sinica, 1998.
14
(3): p. 239-247.
17.
Fischer, P., et al., Simulating the drape behavior of fabrics. Textile Research Journal,
1999.
69
(5): p. 331-334.
18.
Dias, J.M.S., M.N. Gamito, and J.M. Rebordao, A discretized linear elastic model for
cloth buckling and drape. Textile Research Journal, 2000.
70
(4): p. 285-297.
19.
Hu, J.L., S.F. Chen, and J.G. Teng, Numerical drape behavior of circular fabric sheets
over circular pedestals. Textile Research Journal, 2000.
70
(7): p. 593-603.
20.
Bruniaux, P. and C. Vasseur, Modeling and identifying the parameters of a fabric
21.
Fan, J.T., et al., Predicting garment drape with a fuzzy-neural network. Textile
Research Journal, 2001.
71
(7): p. 605-608.
22.
Fare, N. and E. Maitre, Existence of solutions for a woven fabric drape model. Comptes
Rendus De L Academie Des Sciences Serie I-Mathematique, 2001.
333
(10): p.
967-972.
23.
Hofstee, J. and F. van Keulen, 3-D geometric modeling of a draped woven fabric.
Composite Structures, 2001.
54
(2-3): p. 179-195.
24.
Lo, W.M., J.L. Hu, and L.K. Li, Modeling a fabric drape profile. Textile Research
Journal, 2002.
72
(5): p. 454-463.
25.
Bruniaux, P., A. Ghith, and C. Vasseur, Modeling and parametric study of a fabric
drape. Advances in Complex Systems, 2003.
6
(4): p. 457-476.
26.
Termonia, Y., Lattice model for the drape and bending properties of nonwoven fabrics.
Textile Research Journal, 2003.
73
(1): p. 74-78.
27.
Sirtautas, J., A.K. Pickett, and P. Lepicier, A mesoscopic model for coupled
drape-infusion simulation of biaxial Non-Crimp Fabric. Composites Part B-Engineering,
2013.
47
: p. 48-57.
28.
Al-Gaadi, B., F. Goktepe, and M. Halasz, A new method in fabric drape measurement
and analysis of the drape formation process. Textile Research Journal, 2012.
82
(5): p.
502-512.
29.
Mizutani, C., T. Amano, and Y. Sakaguchi, A new apparatus for the study of fabric
drape. Textile Research Journal, 2005.
75
(1): p. 81-87.
30.
Sun, M.N., A new tester and method for measuring fabric stiffness and drape. Textile
Research Journal, 2008.
78
(9): p. 761-770.
31.
Tamas, P., J. Gersak, and M. Halasz, Sylvie((R)) 3D drape tester - New system for
measuring fabric drape. Tekstil, 2006.
55
(10): p. 497-502.
32.
Farajikhah, S., et al., Shadow Moire Aided 3-D Reconstruction of Fabric Drape. Fibers
and Polymers, 2012.
13
(7): p. 928-935.
33.
Jeong, Y.J., A study of fabric-drape behaviour with image analysis part I: Measurement,
characterisation, and instability. Journal of the Textile Institute, 1998.
89
(1): p.
59-69.
34.
Kown, E.S., et al., A Quantitative Fabric Drape Evaluation System Using
Image-Processing Technology, Part 2: Effect of Fabric Properties on Drape Parameters.
Journal of Testing and Evaluation, 2010.
38
(3): p. 263-270.
35.
Park, C.K., S. Kim, and W.R. Yu, Quantitative fabric drape evaluation system using
image processing technology (Part 1: Measurement system and geometric model).
Journal of Testing and Evaluation, 2004.
32
(2): p. 131-137.
36.
Willems, A., et al., Drape-ability characterization of textile composite reinforcements
using digital image correlation. Optics and Lasers in Engineering, 2009.
47
(3-4): p.
343-351.
37.
Pan, N., et al., A new approach to the objective evaluation of fabric handle from
mechanical-properties. Textile Research Journal, 1988.
58
(8): p. 438-444.
38.
Pan, N. and K.C. Yen, Physical interpretations of curves obtained through the fabric
extraction process for handle measurement. Textile Research Journal, 1992.
62
(5): p.
279-290.
40.
Wang, H., et al., Objective handle evaluation of next-to-skin fabrics knitted from
merino wool. 86th Textile Institute World Conference, Vol 3, Conference
Proceedings. 2008.
41.
Mahar, T.J. and H. Wang, Measuring fabric handle to define luxury: an overview of
handle specification in next-to-skin knitted fabrics from Merino wool. Animal
Production Science, 2010.
50
: p. 1082-1088.
42.
AATCC, Test Method 202-2012, Relative Hand Value of Textiles: Instrumental Method,
2012.
43.
Kim, J.O. and B.L. Slaten, Objective evaluation of fabric hand - Part I: Relationships of
fabric hand by the extraction method and related physical and surface properties.
Textile Research Journal, 1999.
69
(1): p. 59-67.
44.
Kawabata, S., The Standardization and Analysis of Handle Evaluation. 2nd ed. 1980,
Osaka, Japan: The Textile Machinery Society of Japan.
45.
Alley, V.L., Jr., Revised Theory for the Quantitative Analysis of Fabric Hand. J. Eng. Ind. ,
1980.
102
: p. 25-31.
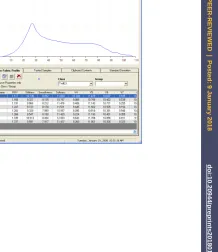
Fig. 1. PhabrOmeter Model 3 Fabric Evaluation System.
(a) Hardware of PhabrOmeter Model 3. (b)PhabrOmeter user interface and a load-displacement extraction curve
Fig. 1(c) The fabric sample extraction process
For all n = 40 fabrics
Extraction Energy
Fabric weight w (mg/cm
2)
r = 0.85
0 5 10 15 20 25 30 35 40 45
0 10 20 30 40 50 60 70
r = 0.85
For all n = 40 fabrics
Figure 3. Fabric thickness vs Extraction Energy
0.00000 0.00500 0.01000 0.01500 0.02000 0.02500
0 10 20 30 40 50 60 70
Fabric thickness
T
(cm)
Extraction Energy
r = 0.67
For all n = 40 fabrics
Linear Density λ (
g/cm)
Extraction Energy
0.00 1000.00 2000.00 3000.00 4000.00 5000.00 6000.00
0 10 20 30 40 50 60 70
r = 0.86
B
C
E
J
λ
B
1
0.448
0.889
0.959
0.197
C
1
0.548
0.478
0.865
E
1
0.925
0.316
J
1
0.206
λ
1
Table 6. Correlations between key parameters
Critical
r
value = 0.403 (2 tailed, α = 0.01, and n = 40)
B = Drape
PhC = Extraction energy
E = Drape
UAJ = RHV
λ = Linear density
Cusick drape Data comparison between UCD and Cotton (n =38)
(Data not available for samples #9 and #10)
Figure 5
Drape
UA
0.0 10.0 20.0 30.0 40.0 50.0 60.0 70.0 80.0 90.0 100.0
40 50 60 70 80 90 100
#33
r = 0.95 (0.97 if no #33)
Drape
CB
Cusick drape Data comparison between Rectified UCD and Cotton (n =38)
(Data not available for samples #9 and #10)
Figure 6
30.0 40.0 50.0 60.0 70.0 80.0 90.0 100.0
40 50 60 70 80 90 100
r = 0.77 (0.97 if no #33)
#33
Drape
UAB
Drape
CB
PhabrOmeter Drape and Cotton Cusick data (n =38)
(Data not available for samples #9 and #10)
0 1 2 3 4 5 6
40 50 60 70 80 90 100
r = 0.88 (0.91 if no #39)
#39
#33
Drape
CB
Drape
ph
PhabrOmeter Drape and UCD Cusick (n =40)
r = 0.89
Figure 8
0 1 2 3 4 5 6
0 10 20 30 40 50 60 70 80 90 100
#39
#09
#33
(0.91 if no #39)
Drape
ph
Drape
UA
PhabrOmeter Drape and UCD Linear Density (n =40)
Drape
Ph0 1 2 3 4 5 6
0.00 1000.00 2000.00 3000.00 4000.00 5000.00 6000.00
λ (
g/cm)
r = 0.197
Drape
PhFigure 9b
0 1 2 3 4 5 6
0.00 200.00 400.00 600.00 800.00 1000.00 1200.00 1400.00
r = 0.696
λ (
g/cm)
PhabrOmeter Drape data and Linear Density (Light weight only n =27)
PhabrOmeter Drape and UCD Linear Density (n =40)
0 0.5 1 1.5 2 2.5 3 3.5
0.00 1000.00 2000.00 3000.00 4000.00 5000.00 6000.00
Drape
PhPhabrOmeter Drape and Linear Density ( Medium weight only, n = 11)
r = 0.901
λ (
g/cm)
Figure 10a
Drape
UATesting direction (
o)
8 9 10 11 12 13 14 15 16 17
0 45 90
Drape
Testing angle
Face
Down
Everage
Directional and side effects for Sample #36
Drape
UATesting direction (
o)
8 10 12 14 16 18 20
0 45 90
Drape
Testing angle
Face
Down
Everage
Figure 10c
Drape
UATesting direction (
o)
8 13 18 23 28
0 45 90
Drape
Testing angle
Face
Down
Everage
Directional and side effects for Sample #30
Drape
UATesting direction (
o)
10 11 12 13 14
0 45 90
Drape
Testing angle
Face
Down
Everage