Analysis of the Effect of Carbon/Nitrogen (C/N) Ratio on the
Performance of Biogas Yields
For
Non-Uniform Multiple
Feed Stock Availability and Composition in Nigeria
Oghenero W. Orhorhoro1, Ejiroghene K. Orhorhoro2*, Patrick O. Ebunilo2
1 Department of Electrical/Electronic Engineering, Delta State Polytechnic, Otefe-Oghara.
2 Department of Mechanical Engineering, University of Benin, Benin City, Edo State, Nigeria
Corresponding author: Ejiroghene K. Orhorhroro Email: [email protected]
Abstracts: This research work is aim at the
analysis of the effect of carbon/nitrogen
(C/N) ratio on the performance of biogas
yields for non-uniform multiple feed stock
availability and composition in Nigeria.
Eight different samples of substrates with
different C/N ratio were charged differently
and together in this order: low C/N ratio,
high C/N ratio and combination of both low
and high C/N ratio. Analysis was carried out
on hydraulic retention time, biogas yields,
and rate of frequency of evacuation. The
results showed that C/N ratio of substrates
affect hydraulic retention time, biogas yields
and the rate of frequency of evacuation.
Therefore, for a better biogas yields
combination of low and high C/N ratio
substrates is necessary.
Keywords: C/N ratio, Substrates, Biogas
yields, Rate of frequency of evacuation,
Nigeria
INTRODUCTION
Anaerobic digestion (AD) has become an
increasingly important industrial process.
The production of biogas from AD process
is of growing interest to many developed
and developing countries, as fossil-fuel
resources decline (Igoni et al., 2008; Bruni
et al. 2010 and Ebunilo et al., 2015). The
available energy sources in Nigeria are
wood, fossil fuel, coal, petroleum, natural
gas, hydro etc and the cost of energy for
domestic, commercial and industrial uses in
Nigeria has risen astronomically in the past
few years (ECN, 1997; Ebunilo et al., 2016).
Biogas technology which has to do with AD
processes have for many years been used to
treat and sanitize sewage sludge waste from
aerobic waste water, agricultural wastes,
food wastes and animal manure, reduce its
odour and volume, and produce useful
biogas. Several researchers (Schomaker et
al., 2000; Adelekan and Bamgboye, 2009;
Ofoefule and Uzodinma, 2009; Adeyosoye
et al., 2010; Ebunilo et al., 2015; Ebunilo et
al., 2016) have reported production of
biogas from different substrates such as
cassava peels, rice wastes, yam wastes,
plantain wastes, sweet potato peel, wild
cocoyam peel, plantain peel, talinum
triangulare (water leaves), rice husks, rice
wastes and various bulk organic wastes in
Nigeria. Biogas in turn is a first generation,
renewable biofuel that offers the prospect of
replacing fossil fuels in the transportation
sector and limiting the net greenhouse gas
emissions implicated in climate change
(Ebunilo et al., 2016).
Carbon/Nitrogen ratio (C/N) ratio means the
ratio of carbon element amount in organic
matter to its content of nitrogen element
amount (FAO/CMS, 1996). The best C/N
ratio is 20-30 atoms of carbon for each atom
of nitrogen (20-30 carbon atoms: 1 nitrogen
atom) (Mattocks, 1984; FAO/CMS, 1996;
EREC, 2002). High or low C/N ratio will
effect negatively on the digestion of the
substrate. Organic wastes differ in their C/N
ratio, for example; C/N ratio for cow dung is
24, vegetable wastes (11-19), cassava peel
(55), yam peel (36), sweet potato peel
(40-46), Beans wastes (24-30), rice wastes
(90-130), fish wastes (2.5-5.5), plantain wastes
(30-37), fruit wastes (20-50) and for sheep
dung is 19 (Karki and Dixit, 1984,
FAO/CMS, 1996, Dioha et al., 2013). For
good biogas production the adjusting of C/N
ratio is desirable and this can be achieved by
mixing wastes of high ratio with those of
low ratio (FAO/CMS, 1996).
The ideal C/N ratio for anaerobic
bio-digestion is between 20:1 and 30:1
(Marchaim, 1992). If C/N ratio is higher
than that range, biogas production will be
low. This is because the nitrogen will be
consumed rapidly by methanogenic bacteria
for meeting their protein requirements and
will no longer react on the left over carbon
remaining in the material. In such case of
high C/N ratio, the gas production can be
improved by adding nitrogen in farm cattle
urine or by fitting latrine to the plant
(Fulford, 1988). Materials with high C/N
ratio typically are residues of agricultural
plants. Conversely if C/N ratio is very low,
that is outside the ideal range stated above,
nitrogen will be liberated and it will
accumulate in the form of ammonia.
Ammonia will raise the pH value of the
slurry in the digester. A pH value which is
higher than 8.5, will be toxic to the
methanogenic bacteria in the slurry. The
cumulative effect of this is also reduced
biogas production.
The important of biogas operating
parameters cannot be neglected if optimum
biogas yields must be achieved. Factors such
as carbon/ nitrogen ratio, temperature,
seeding, pH, hydraulic retention time etc.
must be considered. This research work is
aim at the effect of carbon/nitrogen (C/N)
ratio on the performance of biogas yields for
non-uniform multiple feed stock availability
and composition in Nigeria.
MATERIALS AND METHODS
The materials used in this research work are
as follows: vegetable wastes, cow dung,
cassava peel, yam peel, sweet potatoes peel,
beans wastes, rice wastes, plantain wastes,
biogas anaerobic digester (AD),
thermometer for temperature reading,
pressure gauge for pressure readings,
weighing scale for measurement of
substrates, manual compressor for
evacuating the gas from the AD digester, gas
bottle for biogas storage and rubber hose.
Different samples of substrates comprising
of vegetable wastes, cow dung, cassava peel,
yam peel, sweet potatoes peel, beans wastes,
rice wastes and plantain peel were collected
and measured with weighing balance. Each
of the substrates composition weighed 10kg
and this was mixed with water in ratio of 1:2
and finally charged into the AD digester
separately, composition with C/N ratio less
than 20, those with C/N ratio above 30 and
the combination of both low and high C/N
ratio. The digester content was stirred
several times per day with the aim of mixing
the substrates inside the digester for efficient
biogas generation. The continuous stirring
prevents the formation of swimming layers
and it can as well bring the micro-organisms
(MOs) in contact with the feedstock
particles. The pressure and temperature
readings were monitored with pressure
gauge and thermo meter respectively. The
test was subjected to a period of 37 days.
The initial and final masses of the gas bottle
were taken note of. The quantity of biogas
generated is calculated by subtracting the
initial mass of the gas bottle from the final
mass of the gas bottle.
RESULTS
The result obtained with different
compositions of substrates is shown in table
1 and table 2 respectively. Biogas yielding
rates and biogas evacuation rate is calculated
from equation 1 and equation 2 respectively.
1
2
Where;
HRT= Hydraulic retention time
BY = Biogas yield
R = Rate of Biogas yields
S= Sample
S1= Cow dung
S2 = Vegetable wastes
S3 = Beans wastes
S4 = Plantain peel
S5 = Potato peel
S6 = Yam peel
S7 = Cassava peel
S8 = Rice wastes
SA= Composition with low C/N ratio
SB = Composition with high C/N ratio
SC = Composition with low and high C/N
ratio
EVAR= Evacuation rate
NE= Numbers of evacuation
R = Rate of biogas yields
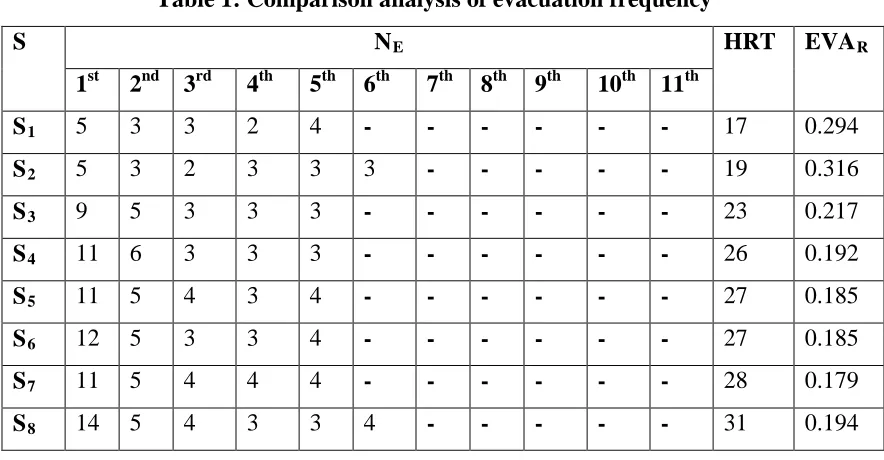
Table 1: Comparison analysis of evacuation frequency
S NE HRT EVAR
1st 2nd 3rd 4th 5th 6th 7th 8th 9th 10th 11th
S1 5 3 3 2 4 - - - - - - 17 0.294
S2 5 3 2 3 3 3 - - - - - 19 0.316
S3 9 5 3 3 3 - - - - - - 23 0.217
S4 11 6 3 3 3 - - - - - - 26 0.192
S5 11 5 4 3 4 - - - - - - 27 0.185
S6 12 5 3 3 4 - - - - - - 27 0.185
S7 11 5 4 4 4 - - - - - - 28 0.179
S8 14 5 4 3 3 4 - - - - - 31 0.194
SA 5 3 2 2 2 3 3 - - - - 20 0.350
SB 15 5 4 3 5 5 - - - - - 37 0.162
SC 12 3 2 2 3 3 3 4 - - - 32 0.250
Table 2: Comparative analysis of rate of
Biogas yield
S HRT
(DAYS) BY (Kg)
R
(Kg/day)
S1 17 0.77 0.045
S2 19 0.93 0.049
S3 23 2.16 0.094
S4 26 1.76 0.067
S5 27 1.73 0.064
S6 27 1.81 0.067
S7 28 1.87 0.067
S8 31 2.13 0.069
SA 20 1.15 0.058
SB 37 2.98 0.081
SC 32 3.45 0.108
DISCUSSION
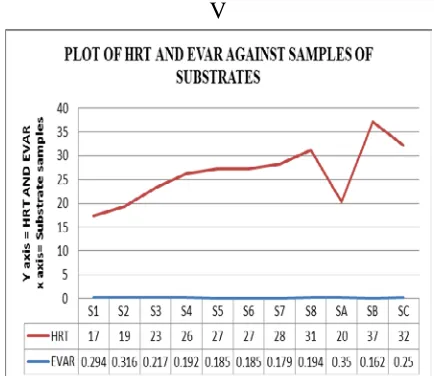
The hydraulic retention time show that
sample 1(S1) which is cow dung has the
lowest hydraulic retention time when
compared to the rest substrate samples
(Figure 1). The low hydraulic retention time
of sample 1 (S1) confirmed that digestion
was faster unlike sample B (SB) that took
longer time. Since sample B (SB) comprises
of substrates with high carbon/nitrogen
(C/N) ratio unlike the other samples. This
indicated that C/N ratio affect substrates
digestion rate. However, when both low and
high C/N ratio substrates (SC) where used
together, the digestion rate improved. This
implies that the higher the C/N ratio of
substrates composition, the longer the
digestion of the substrates. On the other
hand the lower the C/N ratio the faster the
digestion of substrates and the shorter the
hydraulic retention time.
V
Figure 1: Graph of HRT and EVAR against Substrates samples
Also, the rate of biogas evacuation shows
that the samples with low C/N ratio had
faster rate of evacuation frequency when
comparison to samples with high C/N ratio.
Figure 2 show that biogas yields were in this
order: SC > SB > S3 > S8 > S7 > S6 > S5 >
S4 > SA > S2 > S1. This confirms that
mixture of low and high C/N ratio will bring
about high biogas yields.
Figure 2: Graph of Biogas yields against Substrate samples
CONCLUSION
Several operating parameters such as
substrates composition, design of digester,
nature of substrate, pH, temperature, loading
rate, hydraulic retention time (HRT), C: N
ratio, volatile fatty acids (VFA), etc.
influence biogas yields. This research work
on the effect of C/N ratio on biogas yields
shows that biogas production is influence
with C/N ratio. The result show that the
higher the C/N ratio, the higher the
hydraulic retention time and the lower the
frequency of evacuation. Therefore, for a
better biogas yields combination of both low
and high C/N ratio substrates is necessary.
REFERENCES
1. Adelekan, B.A. and Bamgboye, A.I.
(2009): Comparison of Biogas Productivity
of Cassava Peels Mixed in Selected Ratios
with Major Livestock Waste Types. African
Journal of Agricultural Research Vol. 4 (7),
pp. 571 – 577.
2. Adeyosoye, O. I., Adesokan, I. A.,
Afolabi, K. D. and Ekeocha, A. H. (2010).
Estimation of Proximate Composition and
S1 S2 S3 S4 S5 S6 S7 S8 SA SB SC Biogas yields 0.77 0.93 2.16 1.76 1.73 1.81 1.87 2.13 1.15 2.98 3.45
0 0.5 1 1.5 2 2.5 3 3.5 4 Y -A xis = B io ga s yie ld s X =A xi s= S u b st ra te s sa m p le s
Plot of Biogas yields against
Substrate samples
Biogas Production from in Vitro Gas
Fermentation of Sweet Potato (Ipomea
batatas) and Wild Cocoyam (Colocasia
esculenta) Peels. African Journal of
Environmental Science and Technology
Vol. 4(6), pp. 388 – 391
3. Bruni, E., Jensen, A.P., Pedersen, E.S.
and Angelidaki, I. Anaerobic digestion of
maize focusing on variety, harvest time and
pretreatment. Appl. Energy 2010, 87, 2212–
2217.
4. Ebunilo P.O., Aliu S.A. and Orhorhoro
E.K. (2015). Performance Study of a Biogas
Pilot Plant using Domestic Wastes from
Benin Metropolis. International Journal of
Thermal & Environmental Engineering
volume 10, No 2 (2015), 135-141
5. Ebunilo P.O., Aliu S.A. and Orhorhoro
E.K. (2015).Comparative Analysis of
Biogas Yield from Different Composition of
Domestic Wastes from Benin City, Nigeria.
Journal of Advanced &Applied Science
(JAAS) Volume 04, Issue 05, Page 169-177,
2015.
6. Ebunilo P.O., Orhorhoro E. K., Oboh V.,
Onochie P. U.(2016). Effect of Temperature
on Biogas Yields Using South-South
Nigeria as a Case Study. International
Journal of Technology Enhancements and
Emerging Engineering Research, Volume 4,
Issue 3, pp.50-54, March, 2016
Edition-ISSN 2347-4489
7. Energy Commission of Nigeria (1997).
Potential for Renewable Energy Application
in Nigeria
8. (EREC): Methane (Biogas) from
Anaerobic Digesters. U.S Department of
Energy. Merrifield. Virginia. USA. 2002
9. FAO/CMS. A system Approach to Biogas
Technology. Biogas Technology: a training
manual for extension.1996. Available at
website:-http://www.fao.org
10. Fulford, D. (1988). Running of Biogas
Program Handbook, Intermediate
Technology Publications, London.
11. Igoni, A.H.; Ayotamuno, M.J.; Eze,
C.L.; Ogaji, S.O.T. and Probert, S.D.
Designs of anaerobic digesters for producing
biogas from municipal solid-waste. Appl.
Energy 2008, 85, 430–438.
12. I.J. Dioha, C.H. Ikeme, T.Nafi'u, N.I.
Soba and Yusuf M.B.S. Effect of Carbon to
Nitrogen ratio on Biogas Production.
International Research Journal of Natural
Sciences, Vol. 1 No.3, pp.1-10, September,
2013. Published by European Centre for
Research Training and Development UK.
13. Karki A.B., and Dixit K. (1984), Biogas fieldbook. Sahayogi press, Kathamandu, Nepal.
14. Marchaim, U. (1992). Biogas Processes
for Sustainable Development. FAO
Agricultural Services Bulletin 95. Food and
Agricultural Organization of the United
Nations.
15. Ofoefule A.U and Uzodinma E.O.
(2009) Biogas production for blends of
cassava (manihot utilissima) peels with
some animal wastes. International Journal of
Physical Sciences. Vol.4 (7), pp. 398- 402.
16. P.O. Ebunilo, E.K. Orhorhoro, O.A.
Adegbayi (2016). Investigation of the
Purification of Biogas from domestic
wastes using local materials in Nigeria.
International Journal of Scientific &
Engineering Research, Volume 7, Issue 2,
February-2016, 505 ISSN 2229-5518
17. Schomaker, A. H. H. M., Boerboom, A.
A. M., Visser, A., Pfeifer, A. E. (2000).
Anaerobic Digestion of Agro-Industrial
Wastes: Information Networks.Technical
Summary of Gas Treatment, DG12- SSMI
Ed., AD-NETT report, Netherlands