Generating Narrative Spaces from Events History
Ava Fatah gen. Schieck
Bartlett School of Graduate Studies, UCL, Gower Street, London, London W1CE 6BT,UK e-mail: ucftajf@ucl.ac.uk
Chiron Mottram
Bartlett School of Graduate Studies, UCL, Gower Street, London, London W1CE 6BT,UK e-mail: chiron.mottram@ucl.ac.uk
Alan Penn
Bartlett School of Graduate Studies, UCL, Gower Street, London, London W1CE 6BT,UK e-mail: alan.penn@ucl.ac.uk
Abstract
For a successful distributed teamwork it is vital to provide team-members with awareness on collaborative activities. One way of achieving this is through applying a narrative based approach to construct the events that have taken place on documents and folders in a project workspace, as various members make changes to its content. The research presented in this paper investigates the possibility of exploring the history of activities performed by team members. Past events are aggregated in the form of a three dimensional environment time tunnel, providing the team-members with a generative tool to visualize the project’s events history in various configurations, in order to reveal the usually hidden relationships between separate pieces of events. Furthermore we provide a tool for managing and inspecting the folder’s contents: the DocuDrama Timetunnel. Here we present preliminary findings showing how the visualisation of a sequence of connected actions and happenings using a temporal and spatial narrative based approach may lead to a better understanding of the project-related events history.
1. Introduction
Increased globalisation and teleworking have resulted in less of a need for everyone employed on a project to be at the same location. However a distributed team cannot provide the same level of collaboration as a co-located team [1]. For effective collaborative working it is essential for team-members to be able to access records of meeting minutes, document histories and decisions made. It is also essential that new members of teams are able to catch up with what has happened in order to get a clear picture of the state of a project. Although many systems are available for recording changes and amendments to documents, the information gathered from these sources can be very sketchy. It can also be very difficult for team members to fully understand the context in which decisions were made or documents changed [2].
generation from recorded events is difficult to achieve. In order to generate successful narratives of project event histories various issues need to be addressed including: collecting and selecting meaningful events, aggregating this data and deriving a meaning from the event sequences. Presenting the event data to the user in a meaningful way, and finally presenting the aggregated data in an entertaining way, which captures the user’s attention and conveys complex information fast and effectively [3].
This paper describes the DocuDrama: Timetunnel; a generative tool, which constructs stories from past events data recorded in a given event notification infrastructure. A set of tools is provided to capture activity events that have taken place in folders within a workspace; for example, create, read or delete document. The log of user interactivity with the workspace generates over time a map of the folder’s history. The DocuDrama prototype takes advantage of this to generate a time-space based configuration, in which past events are aggregated in the form of a three-dimensional environment. The three-dimensional environments could be built on various events and actions depending on user preferences, which would generate different results from the same data. Finally the prototype creates narratives based on events history captured in the collaborative virtual environment TOWER, a Theatre of Work Enabling Relationships[4].
In the following chapter we briefly describe TOWER, which allows project members to be aware of project-relevant activities as well as to establish social relationships that improve team coherence and social presence in virtual teams. We then introduce the DocuDrama prototype. The chapter on implementation specifies a range of interfaces available in the DocuDrama architecture. Finally, some early user experiences are outlined. This specification has been implemented as a full prototype, which forms one of the main components in the TOWER environment.
2. The Timetunnel as part of TOWER
TOWER, the Theatre of Work Enabling Relationships [5], is a European Commission-funded research project aimed at generating a shared environment to improve team coherence and social presence in distributed teams. The goal is to provide distributed teams with awareness environment of collaborative activities of team members and their shared working context, in addition to spontaneous communication capabilities for social encounters close to those of co-located teams through symbolic presentations in a from of three dimensional virtual model representing the Theatre of Work (Figure 1).
The system of the Theatre of Work is based on collaborative workspaces and ambient interfaces. Its architecture consists of six main components (Figure 2). Sensors detect the operations and activities performed by users. The activities are then processed as events by an event notification infrastructure ENI [6]. The events and actions are aggregated according to space syntax rules in a three-dimensional multi-user environment [7]. Users’ activities are embodied through avatars with symbolic action. Generating stories of past events forms an important part of TOWER. This is achieved through the Docudrama, which transforms sequences of event history information into a narrative of the past activities [8].
Internet-based Event & Notification
Infrastructure Symbolic acting module 3D multi-user environment
Theatre of Work
Docu Drama Work Environment Activity sensors Ambient interfaces Space module
Fig. 2: Overview of the TOWER architecture
3. DocuDrama and Narrative
We see our life as sequences of events and actions. Everything we see, learn, and do becomes part of a story. This is the way we perceive the world around us and this is the way information should be presented to us [9]. A narrative may thus be seen as a way of making sense of the captured events by integrating them into a meaningful whole that makes the events comprehensible in relation to the context of what had happened.
In this paper we present an approach on DocuDrama: The Timetunnel, which tells a story of the team's workspace life cycle. Digital narratives are created in the DocuDrama Timetunnel from the events history, which is generated by a project team in a collaborative work environment. Hence past events and activities that have taken place in folders within the workspace (e.g. create document, read document and delete document) are captured in the form of a history file, which contains the events information as abstract data sets. The strategy that has been adopted by the DocuDrama prototype is to take advantage of this to generate a configuration, in which past events are aggregated in the form of a three dimensional environment, which gives the user a quick overview of past activities in the chosen period of time (Figure 3).
[10]. Depending on user’s preferences, events are aggregated, providing team-members with a generative tool to visualize projects events history in various configurations. The three-dimensional models could be built on various events and actions, which would generate different results from the same data depending on user needs. Subjects of mapping in this case are events and their changes over a period of time.
Fig. 3: Narrative spaces generated by the DocuDrama
To illustrate the function of the prototype, the following scenario explains one possible use of the tool in the TOWER context: An asynchronous scenario of what happened in the past:
Mike is back in his office after a short holiday. He needs to check the history of the management folder in order to get a quick overview of the past activities that were generated during his absence, for instance if there has been an important event that might affect the progress of the project. He clicks on the DocuDrama symbol in the TOWER portal (Figure 8). In the configuration interface, he selects ‘10 days’ as the period to be examined, and defines a ‘daily’ level of detail. He then specifies that he wants to view the DocuDrama tunnel for the designated folder built on events producer and colouring the documents based on artefacts. Finally the DocuDrama three-dimensional model will be generated, visualising the selected folder including the activities and events with the project related deadline.
3.1 Components
The DocuDrama Timetunnel visualises the history of users’ interactions with folders and documents, in relation to deadlines, within a project’s lifetime. The aim of the DocuDrama Timetunnel is to offer an abstract view on project activities and to provide the project team-members with a functionality to manage the project’s data by enabling them to visualise a project’s events history in various configurations.
Fig. 4: Timetunnel components visualising, events, documents and milestones
The Timetunnel consists of different segments. Each segment represents a unit in the lifetime of the project. Depending on the required period of time for the DocuDrama visualisation, a time-segment might represent a year, a month, a day or even only an hour. In our example, a time-segment represents one day of the project’s lifetime. The user selects a time period of project’s lifetime for visualization, in our example, 10 days. In that case, the entry of the tunnel represents the start of the selected time period. Moving through the tunnel enables a virtual tour through the project's lifetime, from the furthest date to the most recent one. The closer the user gets to the end of the tunnel, the closer he gets to the end of the project’s lifetime. Events, actions and milestones in the Timetunnel are organized around the axis of movement forming the four surrounding walls. Activities that have taken place on the same day are located in the same time-segment. The Tunnel’s walls have different colours depending on the kind of actions they represent. These actions include read, create, modify and remove documents in a folder (Figure 5), which affect the state of that specific folder.
Small cubes placed on the wall of a time-segment represent the interaction of the user with project’s folders and documents. The location of the cube inside the time-segment indicates the form of interaction with the document. For instance, cubes piled up on the left side of the time-segment would represent documents that have been removed, whereas cubes on the ceiling show documents that have been opened for reading. Many cubes piled up on the walls indicate a time period with high activity whereas empty time segments represent a time period at which no action has been performed. The cubes could be coloured according to the document type. This would create a visual link between a document placed for instance on the “create event” wall and the same document placed on the “remove event” wall; for example, if they are placed in the same time-segment this indicates that the document was deleted shortly after it was created. Moving closer to the small boxes will reveal the producer of the action as an image mapped on the cube (Figure 6). The user is able to move back and forth in time along the time axis, and follow the project’s activities over a period of time. Navigation through the tunnel is facilitated through the use of viewpoints that transport the user to the desired location (Figure 7). In order to retrieve the document’s name and the date of the action, the user needs to click on the selected document [3,10].
Fig. 6: The image of an event producer appears, when moving closer to the cubes
Fig. 7: Navigation through the tunnel is facilitated through viewpoints
4. Implementation
Fig. 8: Combined interface of BSCW, TOWER world and the Timetunnel
Figure 8 illustrates the integration of the Timetunnel with a BSCW shared workspace [11] and the three-dimensional TOWER world. The combined presentation of the three components enables the user to follow project activity at the same time from different angles. While TOWER world gives a view on the current state of the workspace and BSCW offers direct interaction with the documents, the DocuDrama Timetunnel provides the user with a quick overview of past activities [8].
The Timetunnel architecture consists of three different components: the WorldDatabase, the WorldMapper and the ConfigurationInterface. Figure 9 illustrates the relationship and interaction between the components:
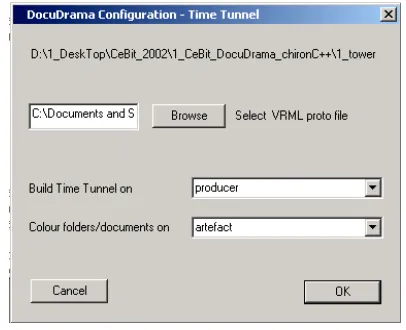
The WorldDatabase stores the data sets of the event history in the collaborative-shared workspace. The WorldMapper realises the matching between the events context and the geometrical data, which results in the three dimensional representation of the prototype. Currently the mapping of the underlying information structure is executed on the basis of a fixed placement rule. This means that the number of the mapped events is predetermined, i.e. four actions, resulting in the shape of the tunnel. On the other hand, inside the predefined shape of the tunnel, different representations could be generated from the same data depending on user’s preferences. The ConfigurationInterface. (Figure 10) allows the user to generate environments built on various aspects. In our example the tunnel is built according to the producer, which means that the tunnel will illustrate events history that were produced by a specific user within a desired period of time. The Software is written in VRML, Perl and C++ respectively. The DocuDramaInterface is implemented in Perl-CGI scripts and provides access in a Mysql backend database [10].
Fig. 10: DocuDrama ConfigurationInterface
5. Results and future work
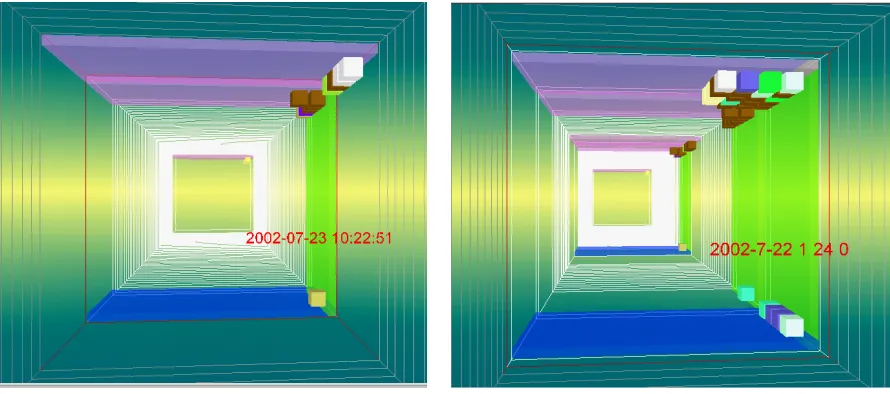
Fig. 11: Period of low activity Fig. 12: Period of high activity
Our findings indicated that the three dimensional visualisation of events history is easier to understand than the two-dimensional pure textual list of the same data as the clustering of events is easier to detect in the three dimensional representation. The evaluation in discussion with possible user groups illustrated that the DocuDrama Timetunnel represents an excellent tool for task control of shared document production. The user group pointed out that the tool could prove to be especially useful in relation to deadlines, which would enable the user to monitor the activities and delays in a task. Currently, events mapping within the mapping engine is implemented on the basis of fixed placement rules representing only four types of events. Future research and development will focus on the handling and visualisation of large datasets in the Timetunnel. To improve the functionality of the model we plan to experiment with different types of spatial clustering in a form of a parametric mapping of past events. Consequently the shape of the tunnel would reflect the real number of events that were performed at the specific time-segment. In this way the user would be able to detect and identify the period of high activity at a glance, as the associated time-segment will be bigger than the time-segment defined during the period of low activity. Future work will include providing an automatic focusing on areas of interesting activity, which will simplify interaction with the Timetunnel and its content. The future Timetunnel will be useful to monitor tasks in relation to overall milestones and project deadlines. In particular it will provide the functionality to manage and organize folders [3,10].
6. Conclusion
deadlines leading to a better understanding of the project-related events history. It is especially suited as a tool for inspecting project related folders and managing them. Finally in developing the DocuDrama Timetunnel we have created a narrative based folder management tool as part of TOWER, a Theatre of Work Enabling Relationships.
Acknowledgements
The authors would like to thank the members of the TOWER project team. The TOWER project has been partly funded through the IST program IST-10846.
References
[1] Thomas, D., 2003, “Virtual Environments help distributed project teams work more effectively”, in Computer Weekly. http://www.computerweekly.com/
[2] Schäfer, L., Prinz, W., Oldroyd, A., Gavin, L., 2001, “Virtual storytelling of cooperative activities in a Theatre of Work” in Proceedings of the International Conference ICVS 2001: Virtual Storytelling, Avignon, France. Berlin: Springer.
[3] Schäfer, L., Bokan, B., Pankoke-Babatz, U., Prinz, W., Fatah gen. Schieck, A., Oldroyd, A., 2003, “Symbolic activities in virtual spaces” in Proceedings of the 3rd international conference on Computational Semiotics for Games and New Media: Cosign 2003, University of Teeside, Middlesborough, UK.
[4] Prinz, W., Pankoke-Babatz, U., Gräther, W., Gross, T.; Klein, K.-H., Kolvenbach, S., Schäfer, L., 2003, “Presenting activity information in an inhabited information space”, in
Inhabited Information Spaces, forthcoming.
[5] TOWER Project, 2002. http://tower.gmd.de.
[6] Prinz, W., 1999, “ NESSIE: An awareness environment for cooperative settings” in
Proceedings of the 6th European conference on Computer Supported Cooperative Work (ECSCW '99), Kopenhagen: Kluwer Academic Publishers.
[7] Penn, A., Desyllas, J. & Vaughan, L., 1999, “The space of innovation: interaction and communication in the work environment”, Environment and Planning B: Planning and Design, Pion, London, Vol. 26.
[8] Schäfer, L., Pankoke-Babatz, U., Prinz, W., Fatah gen. Schieck, A., Oldroyd, A., 2003, “DocuDrama” in Virtual Reality, Berlin: Springer, forthcoming.
[9] Schank, R., 1995, Tell Me a Story: Narrative and Intelligence, Northwestern University Press, Illinois.