DEVELOPMENT OF A WEB-BASED INTERFACE
FOR THE AUTOMATIC FINITE ELEMENT ANALYSIS OF PRESSURE VESSELS
Colin Russell and David H Nash
Department of Mechanical Engineering,
University of Strathclyde, Glasgow, Scotland, UK
ABSTRACT
The Internet presents an opportunity to facilitate the design of pressure equipment in a new and different way. Current industrial design practice employs computer programmes that perform design-by-formula (DBF) calculations in accordance with ASME VIII Division 1 or other international codes and standards. Design-by-analysis (DBA), however is only undertaken by experienced vessel engineers or general finite element analysis (FEA) consultancy specialists.
The present work has established an interface between the Internet and a commercial FEA program for use by designers in the pressure vessel industry. The interface allows users to input variables for a pre-delivered model, obtained from a library of verified models, which may be analysed automatically and the results returned for review.
The outcome of the work has been that an interface has been fully established in the form of an interactive dynamically operating web site. It has extensive error checking facilities for user input variables, and is fully operational for the available models, which, for example, includes a reinforced nozzle located in an elliptical end with multiple loadings. The system has been tested by industry and new opportunities have resulted for the training of engineers by allowing access to complex models only after suitable training has been undertaken and levels of competence have been achieved.
INTRODUCTION
Pressure Vessel Design
Almost since its inception, pressure vessels have been designed within industry mainly by following a set of codes and standards, so called ‘design-by-formula’. Two of the most commonly used ones today are ASME and PD 5500. These codes have proved helpful in making the design of safe pressure vessels relatively straightforward. To ensure that the vessels are structurally sound there is generally a relatively large safety factor inherent in all vessels designed using such codes. This implies there maybe more material used than may be actually necessary to support the applied loads. Also, there are certain limitations within the rules that must be followed which constrain the flexibility the designer has, an example of which regards the placement of features such as nozzles and saddles. As these features create structural discontinuities they must be placed set distances apart to minimise the stress concentration factors.
For any industrial company who required to design a vessel while keeping the weight, and therefore the quantity of material used, to a minimum, or for example wanted to place a nozzle at a knuckle, the DBF codes do not make this possible. Therefore ‘design-by-analysis’ must be used; an approach that involves actually examining the failure modes within the vessels and so allows much more flexibility for the designer. The most common
way of performing DBA is to use a FEA computer program. However, the occasional use of an FEA program does not justify the expense of purchasing it, so if the analysis is required then it must generally be outsourced to a company that has the necessary knowledge, expertise and FEA programs for the job. Consulting companies were set-up to meet this sort of demand, but the full process can be very time consuming and a single analysis may take a week or more. In order for companies to remain competitive however and offer their customers the best possible service they must fully embrace important technological advancements. The Internet falls into this category and it is changing how business is done in many industries.
The Internet
The ability to communicate with people anywhere in the world quickly, easily and cheaply has been realised in the last decade as the Internet has matured and the use of e-mail has grown and become one of the most important forms of communication. The capacity to send information using the Internet has also increased with the development of technologies such as ADSL and Broadband, making it possible to have entire videoconferences over the Internet.
With this in mind, the aim of the present work was to utilise the Internet to create an interface for pressure vessel designers that would enable them to analyse models with the FEA program ANSYS. The concept is that the web site allows somebody to select a particular pressure vessel type from the available library to be analysed, they then input values for the required parameters for the model. This is then analysed automatically by ANSYS and the results are returned for the user to examine. The use of such an interface means a user need not even necessarily have any knowledge of either FEA or the specific proprietary FEA program to perform an analysis of one of the available models, although to be able to interpret the results correctly a user would need knowledge of the finite element method. Using the Internet as the interface means a user can potentially be located anywhere in the world and use the service to perform an analysis.
Current On-line Services
There are services that have the same kind of concept but they all differ in some respects. FEA Online require a CAD model to perform an analysis, and of course the analysis takes time. Some FEA companies have a ‘pay-per-analysis’ option, where the users create the geometry themselves with the program, and then submit it online for solving. Both of these options however do not go as far as this project in allowing anyone to perform an analysis easily and immediately.
Present Work
ANSYS for a single problem case – that of a nozzle shell intersection. After initial models were achieved, a series of parametric files could thereafter be created for different pressure vessel types, details and configurations, and added to the web site to increase the library of models available for analysis. Ideally, the models created would be those that cannot be designed using the DBF codes, thus giving the site more practical use.
DEVELOPMENT OF A WEB INTERFACE
Pages within web sites can be broadly divided into two categories in the way they display information, ‘static pages’ and ‘dynamic pages’. Static pages are ones that are coded entirely in Hyper Text Mark-up Language (HTML), the basic language used to create web pages, and the pages look the same to every person who views them.
Dynamic pages are a progression from static ones which can create the HTML code as it is needed using other programming languages. It allows users to have full interaction within a page, which is the essence of many sites on the Internet today. Since for this website users would need to enter parameter values for an analysis, and these values would have to be processed, a dynamic web site was required for this project.
The web site was designed to run using Internet Information Services (IIS), a Microsoft application that can act as a server. The pages within the site had to be coded in Active Server Pages (ASP), which is the script engine within IIS. This engine allows VBScript, which was the scripting language chosen, to be placed alongside HTML in a page.
A particular type of dynamic site is one that uses a database to store all the necessary information about each user. These databases are at the core of sites such as these and referring to this database helps create much of the pages. This was to be the basis for the site in this project, with all the information stored in a Microsoft Access database. The advantage of using this type of structure means all the information for all the users is conveniently stored in one location, which makes finding specific data a simple task. The data is added to and retrieved from this database using Structured Query Language (SQL), the standard language widely for this purpose.
The use of the core database also means that as users move around the site it is easy to display information relevant only to them, such as the results of analysis. This information is found in the database and then pages are constructed using it. There is one database table that contains the user information and one table for each model available in the library.
OVERVIEW OF WEBSITE FUNCTIONALITY
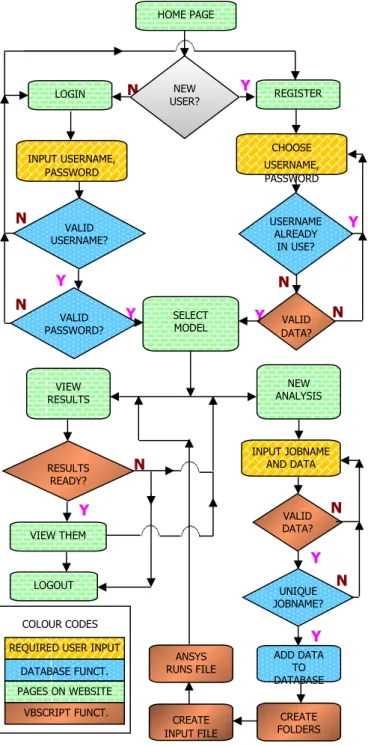
Users are required to register their details on their first visit to the site, which are added to the user-information table in the database; thereafter they can login with their chosen username and password. Data validation is used at all points where user entry is needed and if errors are encountered then users are informed what the error is and encouraged to re-enter it. Once logged in, a user is then shown to the ‘Select Model’page, which allows the user to either request an analysis or view their results. If they select the former, they are given a full description of the model with pictures and details of the variables that they need to enter with their units and limiting values. For every analysis requested the user must give it a unique name, or ‘jobname’, which helps with file management
and identifying analyses. Other options may be available depending on the model, such as requesting additional pictures.
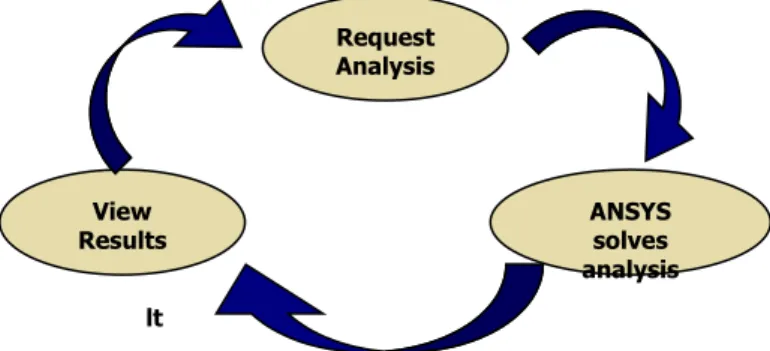
Data validation is used extensively in these pages, as it is important data of the correct type and magnitude is passed to ANSYS. Error messages are displayed as necessary until all the data is correct, which is then added to the database. ANSYS then solves the models as they are requested and creates a results HTML file. When a user goes to view their results, the page shows the information for each analysis they have requested, including whether the analysis has been completed, and if it has there is a link to the results file. The user can also delete analyses from the database they no longer require. Figure 1 shows how a user can continually cycle around this loop, requesting and viewing analyses, and the flow diagram below it shows how a user moves through the site.
Figure 1. Diagram showing user flow through the site
DATA VALIDATION AND VBSCRIPT FUNCTIONS
One of the most important issues in the construction of the web site was ensuring that the data sent to ANSYS is of the correct type, since ANSYS will not tolerate for example, a number of the wrong format. This was achieved with data validation as mentioned previously. Most of the inputs in the site require the user to type in some value such as a dimension, but this can lead to many types of errors since the user can type in anything. Therefore thorough error checking of these fields had to be employed and to do this server side data validation was used, which means the data is sent to the server and checked using functions written in VBScript. Errors are displayed to the user and the analysis is not performed until all the errors have been resolved.
It was realised that once the website was working for one ANSYS model, it would be most efficient if the addition of any other ANSYS models was made as simple as possible. This was partly achieved by the use of the functions described above and their portability between pages. These functions were all held in a single file and were easily called when needed. Functions were used not only in data validation, but also to create the input pages themselves and also the results pages. This meant no programming knowledge was needed to create pages for new models, making it easier to expand the site.
FINITE ELEMENT PROGRAM
The ANSYS general-purpose finite element program was selected to perform all the analyses as it has its own scripting language APDL (ANSYS Parametric Design Language), and so
ANSYS solves analysis Request
Analysis
View Results
getting it to function correctly was an important requirement. The tasks it needs to perform are to solve the models for the user parameters, create the necessary output results, and do this process reliably many times without human interaction. ANSYS runs in ‘batch’ mode, which means it runs as a background process on the computer and thus requires no human interaction. The first stage in running ANSYS is creating an input file to run, which contains all the necessary commands to create the model geometry, apply the
loads, solve it and post-process the results. This file is just a simple text file with the ‘.txt’ extension, and all the commands necessary to run the analysis are written using APDL. The parametric data that is required from the user can be easily included in the input file by defining all the variables at the start.
The creation of input files is done using the File System Object (FSO), which is the method within ASP that allows access to the computers file system to create, delete or move files and folders. The input file created with the FSO is quite short, the APDL command /INPUT was used to read other files in, and then the main input file is referred back to with the /EOF command. This makes the input file more readable and easier to modify, as there are different sections for solving the model and getting the output pictures etc.
To allow multiple users simultaneous access, it is important to ensure that input files are not deleted before they have been analysed. One of the most effective and simplest ways to do this is to use a number incrementing system. So if the first input file created is called ansysinput1.txt, then if another analysis is requested the file created should be called ansysinput2.txt, and so on to ensure no files are overwritten. A loop was created which was coded in ASP to ensure the files created were numbered sequentially, and also to ensure no files that were present were overwritten. This process can be shown by the flow diagram in Figure 3.
Figure 3. ANSYS input file creation flow
Y
Y
N
N
Create Input File
Create ansysinput1.txt
Create ansysinput i +1.txt
Does ansysinput1.txt
exist?
i = 1
i = i + 1 Does ansysinput i +1.txt
exist?
Y
N
N
N
N
N
N
N
N
Y
Y
Y
Y
Y
Y
Y
HOME PAGE
NEW USER? LOGIN
VALID USERNAME?
REGISTER
CHOOSE USERNAME, PASSWORD
USERNAME ALREADY
IN USE?
VALID PASSWORD?
SELECT
MODEL DATA?VALID
NEW ANALYSIS VIEW
RESULTS
RESULTS READY?
INPUT JOBNAME AND DATA
ANSYS RUNS FILE
CREATE INPUT FILE
CREATE FOLDERS ADD DATA
TO DATABASE
VALID DATA?
UNIQUE JOBNAME? VIEW THEM
LOGOUT
REQUIRED USER INPUT
DATABASE FUNCT. PAGES ON WEBSITE
VBSCRIPT FUNCT. COLOUR CODES
Figure 2. Data and logic flow diagram
AUTOMATIC FEA PROCESSING
One of the key issues of the project was to resolve how ANSYS should be executed, as there were two realistic options available. One option available was to execute ANSYS from the DOS command line every time a run was needed, using an application in ASP called ASPEXEC. The other option was to have ANSYS continually running, and waiting for input files to be created so that it could run them.
The main disadvantage of the first option is that a further program is required to monitor the FEA program state, as it is not wise to start multiple instances of the program on the server at any one time. For this reason the second option was chosen as it was easier to implement and did not require any external programming.
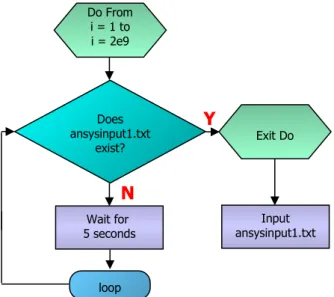
APDL was used to enable this option, and it makes ANSYS wait for the file ‘ansysinput1.txt’ to exist, since this will be the first file created. If the file does not exist then it waits for 5 seconds before checking again. This loop can be performed a total of 2109 times,
the largest integer which ANSYS supports, and with the 5 second interval ANSYS will only exit the loop after 317 years, which will never be realistically reached! If the input file does exist however, ANSYS reads it and runs through all the APDL commands within it, as shown in the flow diagram in Figure 4 below.
Figure 4. ANSYS input file creation flow
As described above the input files are created sequentially, and so after one input file has been run it is important that if others exist they are also run. The method used is to rename all the input files after one has been solved, so that they all decrease in number by 1, and a new ‘ansysinput1.txt’ exists, as shown in figure 5. It means the input file that was just run no longer exists, and the queuing system is kept in order, as the last file to be created is the last to be run.
This total flow of inputting files, solving them and renaming them is undertaken by one file written in APDL that contains the input and renaming loop described above. ANSYS initially waits in loop for the first input file to be created, and once it has it solves it. It then renames the other files accordingly, and then again waits for the input file to exist, and continues in this loop renaming and running the input files indefinitely.
Figure 5. Renaming of input files
DATA MANAGEMENT
The management of all the data produced by ANSYS is important to ensure pictures and files can be located. The method chosen is to order the files in a similar way as the database is ordered, as this is most logical. So for each user there is a folder called that users username, and then within that folder there are subfolders for the model and then the jobname, which contains the results files. This folder hierarchy can be seen in Figure 6 below, which shows how two users called ‘pwilliams’ and ‘jsmith’ might have their folders arranged. Since jobnames are unique to each user for a model type, to locate a folder all that is needed is the username, model name and jobname.
Figure 6. Folder hierarchy used for data management
The methods available to check if ANSYS had analysed a particular job were numerous, as with most programming problems. The method used herein is to check if there was an HTML file in the specific sub folder for that job with a specific name relating to the job. As part of solving the input file, ANSYS creates this file and also the relevant graphics output files (JPEGs) and writes the HTML to include them in this file. If the file is not present then it is assumed the analysis had not yet taken place, and the user was prompted to return at a later time. This procedure relies on ANSYS creating and locating the file correctly if it did run the analysis,
Y
N
Do From i = 1 to i = 2e9
Exit Do Does
ansysinput1.txt exist?
loop
Input ansysinput1.txt Wait for
5 seconds
Y
N
Do From i = 1 to i = 2e9
Exit Do Does
ansysinput i+1.txt exist?
i = i + 1
Delete ansysinput1.txt if it
has just been analysed
Rename ansysinput i+1.txt to
ansysinput i.txt, overwriting ansyinput1.txtif
however this feature was fully tested to ensure it works. Figure 6 shows how the results files might look in a folder for the user pwilliams. You can see how the HTML file to the right is named the username and then the jobname to make it easy to locate. The other files are JPEGs for the results pictures.
RESULTS OUTPUT
Getting ANSYS to output the correct results pictures, and also to display the pictures was another aspect of the project that required to be overcome. When ANSYS runs and solves a file, it creates a results output file, which contains all required information, such as stresses and displacements for every node in the model, in a binary format. It is possible to sort these values and get the required results using APDL and put them into named variables. The output pictures were created using APDL as well to get the correct views for each stress component that was requested.
The output HTML file could be created using ASP, but since ADPL has the capability to create it, it is used to create the web page containing all the pictures and information. It is a simple matter of writing the necessary HTML commands to the right file for this task, and ensuring the pictures are located in the right directory as shown in Figure 7. . Once the job is complete, an e-mail is sent to the user informing of the job completion and also indicating where the results are stored. The user then clicks the link and views the results online.
Figure 7. ANSYS input file creation flow
LIBRARY OF MODELS
Once the website was functioning the next stage was to incorporate models into it to increase the number available for analysis. Currently only one pressure vessel model is fully available for analysis, it is a reinforced nozzle in an elliptical end subject to internal pressure, and the details of it are given shortly.
The main problem associated with adding models is the extensive testing required for them, and this is time consuming and the reason why only one model is fully available. The testing is needed because although the geometry input may be realistically valid, depending on how the model is created in ANSYS an error may occur, so this must be investigated. Another aspect that is time consuming when adding a model is then need to include ‘IF statements’ in VBScript to ensure that all parameters input are of the right size relative to each other, such as inside diameters must be smaller than outside diameters. This process must be done for each model on an individual basis, and although the actual programming required is very straightforward, if a model has greater than ten parameters, which is not uncommon, it can be a somewhat timely process.
REINFORCED NOZZLE IN AN ELLIPTICAL END
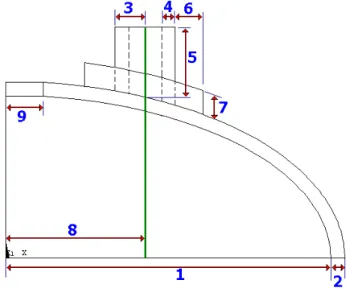
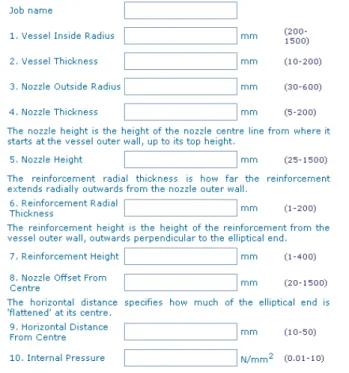
This is the first fully working model on the website, and the loading condition is an internal pressure. A schematic of the model is shown in Figure 8, where symmetry conditions are used. Along with a description of the model, the input page on the website for this model contains both figure 8 and figure 9, to help the user input the correct parameter values. The model has 10 parameters, 9 dimensions and the value of the internal pressure, and all the parameters are numbered as in the two figures below to show each
ones location.
Figure 8. Diagram of elliptical end with required Parameters
As shown in Figure 9 more detailed descriptions of the less obvious parameters are given, along with the units of each one and the minimum and maximum allowable values (the numbers in the brackets). Views of the model from three different angles showing the Tresca stress distribution are automatically included in the results. By checking the appropriate boxes in the input page pictures of the total displacement and Von Mises’ stress can also be included. Along with the pictures of the results, the results page lists the parameters for that model input by the user and a list of numerical results taken from ANSYS, including maximum displacements and stresses. The format of the page makes it suitable for printing off for review or storage. Figure 10 shows a typical picture included in the results page.
Figure 9. Part of the input page for the reinforced nozzle in an elliptical end
Figure 10. Typical results picture for the reinforced nozzle
DISCUSSION
The results of the present work are that the main objectives have been fully completed; a web-interface has been developed that allows the remote analysis of models by ANSYS.
The site has been fully designed, implemented and tested during the course of the project and it has extensive error checking facilities for user input variables. It has been programmed in such a way that someone with no knowledge of HTML or VBScript can add models in a relatively short time, since detailed instructions have been written for this purpose. This is desirable as the next stage in the advancement of the site should be the development and addition of models, and whoever does will not want to be concerned with the programming of the site.
Due to the relatively limited nature of pressure vessel shapes and forms then as long as there is great flexibility within the parameters for each model, the actual number of different models needed in the library to offer a good service would be around only a dozen. The site may therefore have potential as a business venture but research would have to be done into the demand for this type of service.
Since the analyses are done automatically, it is unclear how much trust will be accepted in a service that gives results with no human interaction, since of course the service can accept no responsibility for the results. Other online FEA services as previously mentioned are different in this respect, since they are either analysed by professionals who give a full report or the geometry is built by the user, so it is much easier to assess the results as there is more certainty as to where they came from. Some online vendors have a results service that allows users to rotate models in full 3D space, which is a very useful tool.
Certainly the present work offers something that no other service offers, which is the immediate FEA of models with a user’s own specific parameters. This is novel and so there may well be a market for it. Improvements must be made to the site though to help users assess the results. One possible way might be to include pictures of the mesh used in the analysis and the types of element used, since the quality of an FEA is very dependant on these. So, although it is possible for someone with no FEA knowledge to get an analysis done, in reality they would probably not be able to assess and interpret the results correctly.
Pressure vessel designers are also generally more interested in the membrane and membrane+bending stresses in structures than say the Von Mises stress. So it might be beneficial if the results file contained pictures of these, which can be calculated from the results files produced by ANSYS.
One issue that would need to be addressed before going commercial would be how ANSYS would be licensed from its owner ANSYS Inc., so the licensing conditions may require to be revised and thereafter prove too costly.
FURTHER DEVELOPMENTS
It is clear that with the advent of the site, the next main objective would be to populate it with a fuller library of models. It is anticipated that these additional model would analyse the more common details found in pressure vessel design namely nozzle shell intersections, saddle supports, local loads on attachments and skirt support details. However, even with such a library, there will remain those configurations that still require bespoke analysis.
very short time. The functionality of the present work allows training and education of pressure vessel engineers in the use of DBA in a safe, repeatable, quality controlled, reliable manner.
CONCLUSIONS
In conclusion the aims of the present work have been met with the development of a web-based interface for the automatic finite element analysis of pressure vessel components. During its development, it was found that
Using ASP, input files written in APDL can be created for ANSYS to read
Using ASP, any inputs can be fully error checked and error messages given to the user if necessary
By using functions within ASP models for analysis can be added to the library by someone with no programming experience in a relatively short time
ANSYS can be made to wait in loop indefinitely for a file to exist, and can loop and run multiple jobs indefinitely
APDL can be used to create and write to files, such as web pages.
Additionally, any parametric model can be added to the site but extensive testing is required to ensure they run error free.
In conclusion, any new emerging technology ought to be approached with an open mind and its application is promoted by means of extensive field tests.
REFERENCES
ASME Boiler and Pressure Vessel Code, American Society of Mechanical Engineers, New York, 2001 Edition.
PD 5500:2000, 'Unfired fusion welded pressure vessels', British Standards Institution, London.
ANSYS finite element program, version 6.1, ANSYS Inc., Houston, PA.
FEA Online, www.fea-online.com (Dec 2003)
Lowery, J ‘Dreamweaver 3 Bible’, John Wiley & Sons Inc, June 2000