A Benchmark Program for Evaluation of Methods for Computing Seismic
Response of Coupled Buildmg-Pipmg/Equipment with Non-Classical Damping
J. Xu ~), G. DeGrassi l) and N. Chokshi 2)
1) Brookhaven National Laboratory, Upton, New York 11973-5000, USA
2) The United States Nuclear Regulatory Commission, Washington, D.C. 20555-0001, USA
ABSTRACT
Under the auspices of the US Nuclear Regulatory Commission (N-RC), Brookhaven National Laboratory (t3NL) developed a comprehensive program to evaluate state-of-the-art methods and computer programs for seismic analysis of typical coupled nuclear power plant (NPP) systems with non-classical damping. In this program, four benchmark models of coupled building-piping/equipment systems with different damping characteristics were analyzed for a suite of earthquakes by program participants applying their uniquely developed methods and computer programs. This paper presents the results of their analyses, and their comparison to the benchmark solutions generated by BNL using time domain direct integration methods. The participant' s analysis results established using complex modal time history methods showed good comparison with the BNL solutions, while the analyses produced with either complex-mode response speetnnn methods or classical normal-mode response spectnnn method, in general, produced more conservative results, when averaged over a suite of earthquakes. However, when coupling due to damping is significant, complex-mode response spectrum methods performed better than the classical normal-mode response spectrum method. Furthermore, as part o f t h e program objectives, a parametric assessment is also presented in this paper, aimed at evaluation of the applicability of various analysis methods to problems with different dynamic characteristics unique to coupled N I P systems. It is believed that the findings and insights learned from this program will be useful in developing new acceptance criteria and providing guidance for future regulatory activities involving licensing applications of these alternate methods to coupled systems.
INTRODUCTION
In the nuclear industry, coupled seismic analysis of major subsystems with different damping (such as the NSSS system and Reactor Building) has been performed by applying approximate schemes [ 1, 2, 3] to estimate equivalent modal damping ratios of the coupled system as weighted sums of the component damping ratios based on some weighting functions using the component mass or stiffness or combination of both. While these methods may provide reasonable approximations of the diagonal terms of the damping matrix, they ignore the effects of the off-diagonal terms. In more recent years, more rigorous approaches have been developed based on a method first proposed by Foss [4] in which the equations of motion of the non- classically damped systems are uncoupled by a transformation to the damped modal coordinate system. Unlike the traditional methods, the solution involves complex-valued eigenvalues and eigenveetors [5]. In contrast to classical response spectrum methods, in addition to a displacement spectrum input, the response spectrum methods for non-classically damped systems require a velocity spectrum input, which is not explicitly provided in design practice. These newly evolved methods appear more powerful, but are mathematically more complicated, and require greater computational effort than the traditional methods, and to date have not been widely applied or accepted for general use in the nuclear industry. While current regulatory requirements do not prohibit the use of coupled analysis, there is no guidance on the implementation of these new methods. From the regulatory standpoint, it is important to understand the applicability and limitations of these methods to assure that they produce reasonable results with acceptable safety margins.
Under the auspices of the US Nuclear Regulatory Commission (NRC), Office of Nuclear Regulatory Research, Brookhaven National Laboratory (I3NL) developed a two-phase benchmark program for evaluation and verification of state- of-the-art analysis methods and computer programs for performing seismic analyses of coupled structures with non-classical damping. Under Phase I, a series of benchmark problems that cover various aspects of application and complexity of typical coupled nuclear power plant (NPP) structures with non-classical damping were first developed. BNL analyzed the benchmark problems for a suite of earthquake ground motions using the direct integration time history analysis method with a rigorous formulation for the explicit damping matrices. Practitioners of alternate state-of-the-art analysis methods were then invited to perform independent analyses and provide their analysis results to BNL for comparison. This paper provides a brief description of the benchmark process, analysis methods applied by the participants, and discussions of the analysis results and findings with respect to the applicability and limitations of various alternate state-of-the-art analysis methods for coupled NPP structures with non-classical damping.
This paper is organized in five sections. The process, objectives and the analysis models for the program are described in Section 2. Section 3 presents a brief outline of the participants' methodologies applied in the seismic analyses. Section 4 provides discussions of the results of the participant's analyses. Finally, conclusions are drawn in Section 5.
SMiRT 16, Washington DC, August 2001
Paper # 1468
P R O G R A M OBJECTIVES AND PROCESS
The objective of this program was to evaluate state-of-the-art methods with respect to the applicability and limitations in performing seismic analysis of coupled NPP structures with non-classical damping. The program was focused on the analysis of a coupled primary-secondary system consisting of two subsystems with different modal damping ratios. BNL developed a series of benchmark problems designed to cover various aspects of application and complexity and generated a series of solutions to these problems using the direct integration time history analysis method: Developers of alternate analysis methods were invited to apply their methods to analyze the benchmark problems and provide the results to BNL for comparison.
Four structural configurations were developed for this program. They include three simple models and one complex model, each representing a coupled primary-secondary (P-S) system. The dynamic properties of the models are representative of NPP structures, systems and components. In order to investigate the applicability of various analysis methods to problems with different dynamic characteristics, a baseline case and nine other load cases were designed for each of the three simple models to cover a range of parameter variations including secoridary to primary system frequency ratio, mass ratio, and different modal damping ratios. Table 1 provides the matrix of the analyzed load cases. The E1Centro (1940) earthquake was used as the seismic input for these cases. In addition, a suite of ground motions was selected, which consist of both real and artificial earthquake records, and the baseline models were also analyzed for the suite of ground motions. Figures 1, 2 and 3 depict the structural configurations of the three simple models, which have the same primary component (building) model that consists of weightless shear beam elements and lumped masses and is fixed at the ground. The secondary components were designed differently for each of three benchmark problems for the purpose of evaluating the effect of multiple support excitations of the secondary component (spatial coupling effect). The suite of the ground motions includes: E1Centro, SOOE (1940), Taft $69E (1952), Olympia N86E (1949), E1Centro S40E (1979), Loma Pfieta, Foster City (1989), Northridge N30W (1994), and a Regulatory Guide 1.60 artificial time history.
Figure 4 shows the fourth model representative of a realistic complex model of a coupled NPP building and piping system which utilizes the same type of elements that would be used in a design analysis. In this model, the primary system (building model) consists of seven weightless 3-D flexural beam elements and seven lumped masses. The secondary component (the piping model) consists of twenty-three straight and curved SAP piping elements. The pipe is supported by anchors at its end points and by two-directional guides at intermediate points. Rigid weightless beam elements are used to support and couple the piping to the building as shown in Figure 4. The model uses realistic piping and building material and cross-sectional properties. Two configurations were selected, which provide uncoupled fundamental natural frequencies of 8.24 Hz (No. 4a) and 4.60 Hz (No. 4b), respectively. Modal damping ratios of 7% for the uncoupled building and 2% for the uncoupled multiply supported piping system were assigned in both cases. The input ground motion is applied at the base of the primary component (Building) in the global Y direction for the model #4a, and in the global X direction for the model #4b. Both models were analyzed for the suite of earthquake ground motions.
For these four models, BNL generated analytical solutions, using the time domain direct integration method and a synthesis formulation developed by BNL [6] for assembling the fully populated damping matrix of the coupled system from the damping ratios of its subsystems. The BNL programs for developing the analytical solution for the benchmark problems were then tested and verified by comparison to other published solutions.
OUTLINE OF PARTICIPANTS' METHODOLOGIES
This section describes the alternate analysis methods applied by the program participants, which include: C. Chen of Apollo Consulting~ Inc. (Apollo); A. K. Gupta, A. Gupta and M. K. Bose of North Carolina State University (NCSU); T. Igusa of Johns Hopkins University and A. Der Kiureghian of University of California at Berkeley; A. Berkovski, O. Kireev, V. Kostarev and J. Stevenson of Stevenson and Associates, Russian Off.tee (S&A).
Chen' s Method
To produce solutions to the benchmark problems, Chen performed coupled analyses based on the classical normal mode response spectrum method [7]. The calculation of damping for the coupled structure was performed using weighted damping values based on energy principles with strain energy based on ASCE standard 4-86 [8]. For modal combinations, Chen applied the Complete Quadratic Combination (CQC) rule with cross coupling terms. Rigid modes were accounted for using the procedure described in the NRC Standard Review Plan.
Gupta's M e t h o d
dependencies relating the motion of the component to other components that are connected via the constraints. It was shown by Xu [6] that the system damping derived by Gupta's method, if transformed to time domain, assumes the same form reduced from the BNL method. Gupta's method also addresses issues associated with complex-valued response spectrum approaches such as proceAures for estimating velocity spectrum, and for combining maximum modal responses, as well as incorporating residual response.
lgusa and Der Kiureghian Method
The method used by Igusa and Der Kiureghian for the benchmark analysis is based on random vibration of non-classically damped systems and reflects improvements in formulations for the correlation coefficients developed in their past research efforts [12]. The major improvement in the current method is that filtered white noise is used instead of white noise to determine the correlation coefficients for modal combinations. Therefore, seismic events can be modeled with non-stationary properties, and maximum response, which is computed separately for each seismic event, can be compared directly with time history analysis. In addition, Igusa and Der Kiureghian also provided treatment for the velocity spectrum input. For the coupled system-damping matrix, the BNL formulation was applied without modification.
Stevenson & Associates Method
The method applied by Stevenson & Associates (S&A) closely follows that of Gupta (Ref. 9), such as in the development of system damping and of the complex-valued eigen problem solution. Two sets of analyses using response spectrum methods were performed, one with exact correlation coefficients and maximum modal responsesdirectly computed from the modal time history analysis (RSM-I), and the second with an approximation for correlation coefficients and the velocity response spectrum input (RSM-II). The RSM-I analysis, which used the exact correlation coefficients and maximum modal responses directly computed from the modal time history analysis, is not a practical approach since it is generally assumed that when performing a response speetrtnn analysis, the corresponding modal time history responses are not available. The RSM-II analysis was performed based on approximations for correlation coefficients and velocity response spectrum input. The formulation for correlation coefficients proposed by Igusa [ 13] was applied. The pseudo velocity response spectrum was used as an approximation of the velocity response spectrum.
DISCUSSIONS ON THE RESULTS OF THE PARTICIPANT'S ANALYSES
The program participants performed independent analyses for the defined benchmark problems using both the modal superposition time history method and the response spectrum method. The responses generated using the modal supeqx)sition time history method were compared to the BNL solution on one-to-one basis, while the analyses with response spectrum methods were examined based on the mean responses derived from the suite of ground motions. For the parameter variations, which were analyzed for the simple models and a single earthquake motion, the mean responses across the model were used for comparison. The response is defined as the maximum value of either nodal di~laeement or element force computed as the ratio of the participant calculation to the BNL solution. However, since in conventional piping analysis, the square-root-of- sum-of-squares (SRSS) of all three components of the maximum element moment is used to calculate stresses that are compared against Code requirements, for the secondary component of the benchmark problems No. 4a and No. 4b, the ratios were computed as the participant SRSS maximum moments to the corresponding BNL SRSS maximum moments.
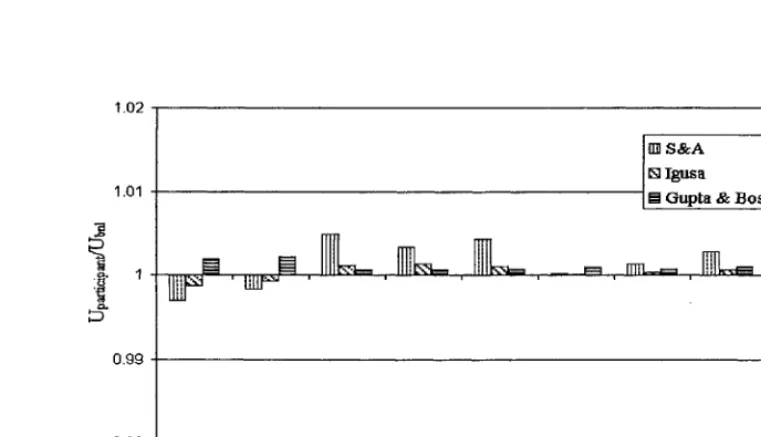
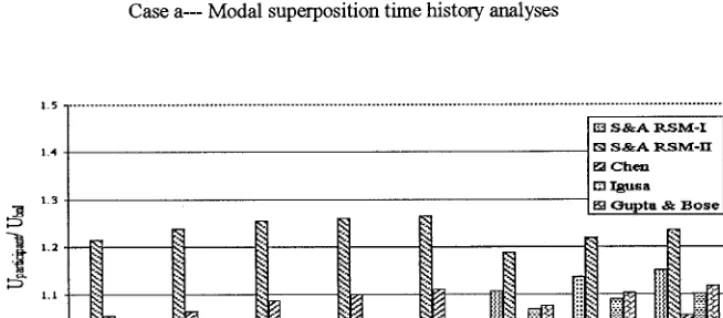
Generally, the complex-mode time history analysis results were in excellent agreement with the BNL direct integration time history results. As examples, Figures 5 and 6 show the comparisons for the baseline ease for the models No. 1, and No.4a. Although some large differences in the response comparison are observed in Figure 6, as demonstrated in Figure 7, the corresponding response values are too small to be of practical significance. Similar comparisons were also observed for other models. It is, therefore, concluded that for these problems, the participants' complex-mode time history analysis methods provide results comparable to those generated by the benchmark direct integration time history analysis methods.
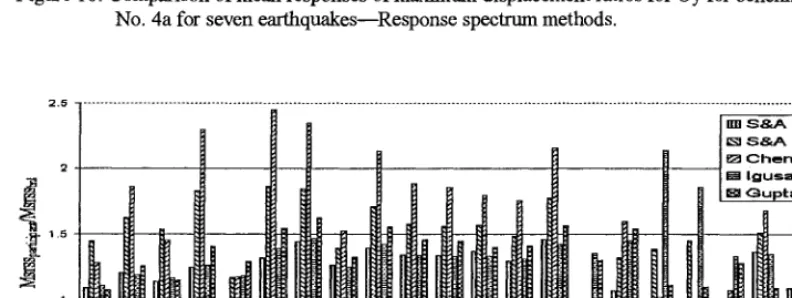
When comparisons were made based on the mean response generated using the suite of ground motion inputs, the analyses using both complex-mode response spectrum and classical normal mode response speetrttm methods predicted the responses that are mostly conservative compared to the BNL time history results. Due to limited space, selected comparisons are provided in Figures 8 though 11 for illustration purposes (for complete comparisons, the reader is referred to NUREG/CR- 6661 [14]). Based on the overall results for both the small and large benchmark problems, it is concluded that the participants' response spectrum analysis methods provide reasonably accurate and generally conservative results.
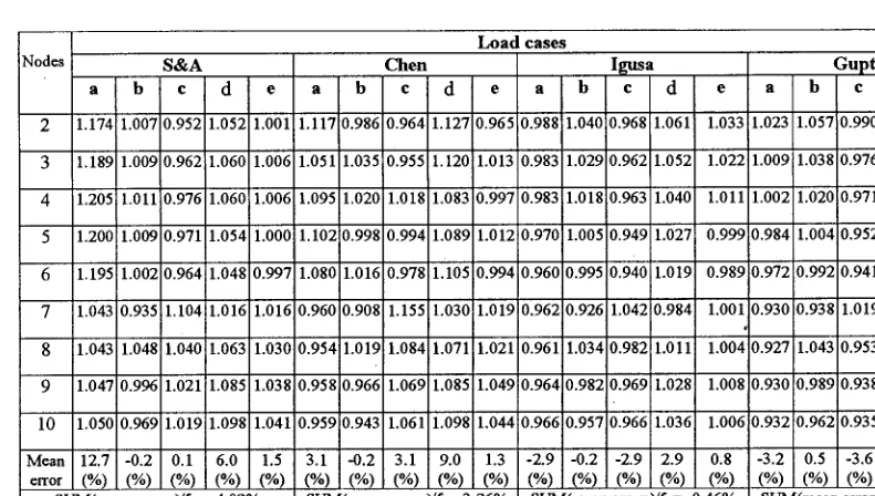
the tuned and near-tuned frequencies, and it is also observed that the Igusa and Gupta solutions appear less sensitive to frequency ratio variations than the S&A and Chen solutions. However, solutions associated with large mean errors are mostly over-predictions, implying that inherent conservatism may exist in these methods. The maximum mean errors for displacements are 12.7% for S&A, 9.0% for Chen, 2.9% for Igusa and 3.6% for Gupta. Similarly, the maximum mean errors for element shears are 13.3% for S&A, 12.24% for Chen, 8.69% for Igusa and 11.1% for Gupta. As documented in NUREG/CR-6661 [ 14], the analysis results with mass and damping variations also produced similar mean error rates, which are capped between 2.9% - 13.3%. Since response speetnma solutions would be expected to compare better to the time history solutions based on multiple earthquake inputs, a case can be made that for the same parametric variations, when a suite of earthquake input motions are applied, the computed mean errors from the parameter variations can be further improved.
C O N C L U S I O N S
In this paper, a NRC sponsored benchmark program to evaluate state-of-the-art methods with respect to the applicability and limitations in performing seismic analysis of coupled NPP structures with non-classical damping was described. The program objective was accomplished through the analyses of sets of the BNL defmed benchmark problems by four participants using their chosen analysis methods, which included complex-mode based time domain and frequency response spectrum methods as well as the classical normal mode response spectrum method. The analysis results of these benchmark problems for a suite of earthquake records and selected parametric variations showed generally conservative predictions when compared with the analytical solutions generated by BNL using the direct integration method. The mean error rates computed from the various parametric analyses were kept reasonably well within acceptable limits for practical applications. The program goal was therefore achieved by demonstrating that these methods provide results which are comparable to those obtained using the direct integration time history analysis method which has been long been considered an acceptable "exact" method of seismic analysis in the nuclear industry. In addition, during the course of this program, a significant amount of analytical data was generated using a variety of state-of-the-art analysis methods and computer programs. Details of the analysis results can be found in the benchmark program fmal report [14].
D I S C L A I M E R N O T I C E
This work was performed under the auspices of the U.S. Nuclear Regulatory Commission, Washington, D.C. The findings and opinions expressed in this paper are those of the authors, and do not necessarily reflect the views of the U.S. Nuclear Regulatory Commission or Brookhaven National Laboratory.
R E F E R E N C E S
1. Johnson, T. E. and McCaffery, R. J., "Current Techniques for Analyzing Structures and Equipment for Seismic Effects", ASCE, National Meeting on Water Resource, held at New Orleans, 1969.
2. Tsai, N. C., "Modal Damping for Soil- Structure Interaction", Journal of Engineering Mechanics, Div., EM2, pp.323-341, 1979.
3. Roesset, J. M., et al., "Modal Analysis for Structures with Foundation Interaction", ASCE, J. Struct. Div, 1973. 4. Foss, K. A., "Coordinate Which Uncouple the Equations of Damped Linear Dynamic Systems", Transactions of the
American Society of Mechanical Engineers, Vol. 82, pp. 361-364,1960.
5. Veletsos, A. S. and Ventura, C. E., "Modal Analysis of Non-Classically Damped Linear Systems," Earthquake Engineering & Structural Dynamics, Vol. 14, No. 2, pp. 217-243, 1986.
6. Xu, J.,"Overview on Methods for Formulating Explicit Damping Matrices for Non-Classically Damped Structures", ASME-PVP, San Diego,1998.
7. Chen, C., "Seismic Resistant Design of Safety Class Structures and Equipment", ASCE Specialty Conference on Structural Design of Nuclear Power Plant Facilities, Chicago, 1974.
8. ASCE Standard 4, "Seismic Analysis of Safety-Related Nuclear Structures," 1986.
9. Gupta, A.K. and Jaw, J.W., "Response Spectrum Method for Nonclassically Damped System." Nuclear Engineering and Design, Vol. 91, pp. 161-169,1986.
10.Gupta, A.K., Response Spectrum Method In Seismic Analysis and Design of Structures, CRC Press, Inc., FL, 1992. 11.Gupta, A. and Gupta, A. K., "Reduction in Seismic Response of Piping Systems due to Coupling," Proceedings of 5th
Symposium on Current Issues Related to Nuclear Power Plant Structures, Equipment and Piping, Florida, 1994. 12.Igusa, T. and Der Kiureghian, A., "Dynamic Response of Multiply Supported Secondary Systems," Journal of
Engineering Mechanics (ASCE), Vol. Ill, No. 1,1985.
13.Igusa, T. Sinha, R., E. Kokubo, E., Furukawa S.-I. and Kawahata, J.-I., "Analysis ofpiping with hysteretic supports using response spectra," Nuclear Engineering and Design, 143, 1993.
S - C o m p o n e n t
I
~ 1 P-Ccanponent
S-Component
S-Component
Ground
~ 1 . .
~
P-Component
~
P-Component
/ / / / / / ' / / /
Figure 1. Benchmark model no.1. Figure 2. Benchmark model no.2. Figure 3. Benchmark model no.3.
Parameter Variations
Frequency 0.5 Ratio (s/P)
Mass
Ratio (siP)
Modal Damping
(p,s) .... 0.9
1.0
,,
1.1 2.0 '0.0001
. . . . 0.005
0.1
...
0.5
7%,2% 7%,5% 7%,20%
Load Cases
a b e d e f g h i j
X X
x x x x x x
X
X X X X X
X
X
X X X X X X X X
X X
X X
~'V Anchor
Piping
II
JBuilding
z I I ~ Anohor
~ 7 '
Table 1. Typical matrix for load cases Figure 4. Benchmark model no. 4a & 4b.
1.02 ,:
1.01
@ IN
1 ~ ' I.[[[~
0.99
0.98
[] S&A
[] I g u s a[] Gupta & Bose
, | , | , | |
2 3 4 5 6 7" 8 9 10
Nodes
ml S & A
t ~ I ~ n n a
I ~ O u p t a & B o s e
. . . , ~ , n • n • n • n • , i n " i n , - - n •
1.2
~::~" 1.1
. . ~ . . , . , . . E ~ e FL
O.-9 J . . .
2 3 4 • 6 7 S 9 10 11 12 13 14 1~ 16 17 18 l g 2 0 :21 2:2 2 3 2 4 2 5 2 6 29' 2 8 2 g 30 31 32
N o d e s
Figure 6. Comparison of maximum displacement ratios for Uy for benchmark problem No. 4a, Case a---Modal superposition time history analyses.
. a ~ o . 2 8 0
0 . 1 E ; O
0 . 1 0 0
0 . 3 O O ... ; . . . : . . . .
o . 2 5 o s ~ r . . ~ * - ] [ g l l . l S a - - : , - < - - O u p t a ~ B o s e
. L ' ~ T o d e s
Figure 7. Comparison of actual maximum displacements Uy for benchmark problem No. 4a, Case a-- Modal superposition time history analyses
1 . 5 . . .
[
n'~ S & A I ~ S M - I| ~ S . I b - A R . S M - I I
I ~4
i
1
1~3 C h c m ]rn ~ s aI
0
13.9 - . . . J
2 3 4 5 6 9' 8 9 1 0
N o d e s
1 . 3
, ~ l ' 2 m
1 . 1
I
I . . . . . . . . . . . . . . . . . . .'-" T--1 ~ c " ' ~ t - - -
, . ~ 1 . 2 m "L.I
o.~J ... i ... i ... i.. ... i ... i ... i ... '. ... i ...
l 2 N 4 5 6 7 8 9
]~-1 ~ r n e ~ a t s
Figure 9. Comparison of mean responses of maximum element shear force ratios for benchmark problem No. 1 for seven earthquakes--Response spectrum methods
2 . . .
1 . 0 u . u , ~ . o ~ . r ~ . ~ , . , ~ J . Y . L - x
z . s ~ ' J S ~ z A R S M - I I [,.
z . 7 ! ~ C h e ~
1 . 6
.~
1 . 5 ;$3 C_~upta & B o s e 1• 1 . 4
I
, i
1 . 1 ~
1 . . . m~IL arJll_ inle]... =~1,..~ mJ~._ J~l].,. ' ] ~ . 1 [ . . . i
oo ~ ' : ' . . . ~ . . . . . . . . . .
"i
13.g
2 3 4 5 6 7 8 "9 I 0 I I 1 2 1 3 1 4 1 5 1 6 1"7 1 8 I P 2 0 2 1 2 2 2 3 2 4 ~ 5 :26 2 7 2 8 2 P 3 0 3 1 3 2
]",fro d c s
Figure 10. Comparison of mean responses of maximum displacement ratios for Uy for benchmark problem No. 4a for seven earthquakes--Response spectrum methods.
2 , 5 . . .
!~
. ~s&ARs~l II~ H II = ~.~ R~,, I
jl
!1 I.,oo°.
,
I
. . . . " . . . "' 'I- i
8 . 5
1 2 3 4 5 8 7 8 B 1 0 11 1 2 1 3 1 4 1 5 1 8 1 7 1 8 1 8 2 0 2 1 2 2 2 3
E l e m e n t s
Figure 11. Comparison of mean responses of maximum SRSS element moments of S-component for benchmark problem No. 4a for seven earthquakes--Response spectrum methods.
Table 2. E f f e c t s o f f r e q u e n c y r a t i o v a r i a t i o n s o n a n a l y s i s m e t h o d s ( D i s p l a c e m e n t r a t i o s )
Nodes
10
Mean 12.7 -0.2 0.1 6.0 1.5 3.1 -0.2 3.1 9.0 1.3 -2.9 -0,2 -2.9 2.9 0.8 error (%) (%) (%) (%) (%) (%) (%) (%) (%) (%) (%) (%) (%) (%) (%) SUM(mean errors)/5 = 4.02% SUM(mean errors)/5 = 3.26% SUM(mean errors)/5 = -0.46%
L o a d c a s e s
S & A C h e n I g u s a G u p t a
a b c d e a b c d e a b c d e a b c d e
2 1.174 1.007 0.952 1.052 1.001 1.117 0.986 0.964 1.127 0.965 0.988! 1.040 0.968 1.061 1.033 1.023 1.057 0.990 1.086 1.050
3 1.189 1.009 0.96211.060 1.006 1.051 1.035 0.955 1.120! 1.013 0.983 1.029 0.962 1.052 1.022 1.009 1.038 0.976 1.069 1.030
4 1.205 1.011!0.976 1.060 1.006 1.095 1.020 1.018 1.083 0.997 0.983 1.01810.963 1.040 1.011 1.002 1.020 0.971 1.050 1.013
5 1 . 2 0 0 1.009 0.971 1.054 1.000i 1.102 0.998 0.994 1.089 1.012 0.970 1.005 0.949 1.027 0.999 0.984 1.004 0.952 1.03210.997
6 1.195 1.002 0.964 1.048 0.997 1.080 1.016 0.978 1.105 0.994 0.960 0.995 0.940 1.019 0.989!0.972 0.992 0.941 1.02210.985
7 1.043 0.935 1.104 1.016 1.016 0.960 0.908 1.155 1.030 1.019 0.962 0.926 1.042 0.984 1.001 0.930 0.938 1.019 0.958!0.991
,!
8 1 . 0 4 3 1.048 1.040 1.063 1.030: 0.954 1.019 1.084 1.071 1.021 0.961 1.034 0.982 1.011 1.0040.927 1.043 0.953 0.987 0.990
9 1.047 0.996 1.021 1.085 1.038 0.958 0.966 1.069 1.085 1.049 0.964 0.982 0.969 1.028 1.008 0.930 0.989 0.938 1.004 0.990
1.050 0.969 1.019 1.098 1.041 0.959 0.943 1.061 1.098 1.044 0.966 0.957 0.966 1.036 1.006 0.932 0.962 0.935 1.012 0.987
-3.2 0.5 -3.6 2.4 0.4 (%) (%) (%) (%) (%) SUM(mean errors)/5 = -0.7%
T a b l e 3. E f f e c t s o f f r e q u e n c y r a t i o v a r i a t i o n s o n a n a l y s i s m e t h o d s ( E l e m e n t S h e a r r a t i o s )
E l e m e l l
t
L o a d c a s e s
S & A C h e n I g u s a G u p t a
i
a b c d e a b c d e a b c d e a b c d e
I
1 1.173 1.00810.951 1.052 1.003 1.068 1.010 0.969 1.084 1.001 0.988 1.040 0.968 1.061 1.033 1.023 1.058 0.990 1.086 1.050
i
2 1.211 1.019 0.977 1.065 1.013 1.099 1.023 0.995 1.099 1.012 0.979 1.018 0.958 1.039 1.011 0.994 1.017 0.962 1.045 1.009
3 1.212 1.018 0.977 1.065 1.013i1.101 1.023 0.998 1.097 1.012 0.955 0.995 0.936 1.013 0.988 0.955 0.981 0.927 1.005 0.973
4 1.171 0.990 0.945 1.035 0.990 1.070 0.998 0.966 1.068 0.988 0.910 0.951 0.886 0.968 0.945 0.901 0.929 0.868 0.951 0.922
5 1.140 0.950 0.932 1.016 0.951! 1.039 0.956 0.951 1.046 0.954 0.863 0.894 0.857 0.929 0.896 0.848 0.867 0.833 0.908 0.869
:|
6 1.06711.062 1.002 1.167 0.949 0.96611.037 1.052 1.157 0.954 0.974 1.0420.949 1.076 0.856 0.939 1.046 0.917 1.059 0.817
|
7 1.072 0.991 0.999 1.189! 0.936 0.967 0.975 1.048 1.168 0.942 0.978 0.972 0.948 1.093 0.839 0.944 0.972 0.916 1.077 0.797
8 1.077 0.933 i0.999 1.207 0.927|0.966 0.920 1.038 1.194 0.919i0.982 0.909 0.950 1.108 01828 0.948 0.905 0.917 1.093 0.785
9 1.078 0.895 1.000 1.219 0.926:0.977 0.903 1.039 1.189 0.968 0.985 0.869 0.952! 1.120 0.822 0.9510.859 0.919 1.105 0.777
Mean 1 3 . 3 -1.49 -2.42 11.28-3.24'2.811 -1.72 0.622 12.24-2.78 -4.29 -3.44 -6.62 4.52 -8.69 -5.52 -4.07 -8.34 3.66 -11.1 error (%) (%) (%) (%) ( % ) . (%) (%) (%) (%) (%) (%) (%) (%) (%) (%) (%) (%) (%) (%) (%)