Volume 2006, Article ID 32767, Pages1–8 DOI 10.1155/ASP/2006/32767
Domain-Based Predictive Models for Protein-Protein
Interaction Prediction
Xue-Wen Chen and Mei Liu
Bioinformatics and Computational Life-Sciences Laboratory, Information and Telecommunication Technology Center, Department of Electrical Engineering and Computer Science, The University of Kansas, 1520 West 15th Street, Lawrence, KS 66045, USA
Received 4 May 2005; Revised 8 September 2005; Accepted 15 December 2005
Protein interactions are of biological interest because they orchestrate a number of cellular processes such as metabolic pathways and immunological recognition. Recently, methods for predicting protein interactions using domain information are proposed and preliminary results have demonstrated their feasibility. In this paper, we develop two domain-based statistical models (neu-ral networks and decision trees) for protein interaction predictions. Unlike most of the existing methods which consider only domain pairs (one domain from one protein) and assume that domain-domain interactions are independent of each other, the proposed methods are capable of exploring all possible interactions between domains and make predictions based on all the do-mains. Compared to maximum-likelihood estimation methods, our experimental results show that the proposed schemes can predict protein-protein interactions with higher specificity and sensitivity, while requiring less computation time. Furthermore, the decision tree-based model can be used to infer the interactions not only between two domains, but among multiple domains as well.
Copyright © 2006 Hindawi Publishing Corporation. All rights reserved.
1. INTRODUCTION
Proteins play an essential role in nearly all cell functions such as composing cellular structure, promoting chemical reac-tions, carrying messages from one cell to another, and act-ing as antibodies. The multiplicity of functions that proteins execute in most cellular processes and biochemical events is attributed to their interactions with other proteins. It is thus critical to understand proteprotein interactions (PPIs) in-volved in a pathway or a cellular process in order to better understand protein functions and the underlined biological processes. PPI information can also help predict the func-tion of uncharacterized proteins based on the classificafunc-tion of known proteins within the PPI network. Furthermore, a complete PPI map may directly contribute to drug develop-ment as almost all drugs are directed against proteins.
The recent development of high throughput technolo-gies has provided experimental tools to identify PPIs sys-tematically. These methods include two-hybrid system [1], mass spectrometry [2], protein chips [3], immunoprecipita-tion [4], and gel-filtraimmunoprecipita-tion chromatography [5]. Protein in-teractions can also be measured by biophysical methods such as analytical ultracentrifugation [6], calorimetry [7], and op-tical spectroscopy [8]. Among those experimental methods, the two-hybrid system is mature and accurate enough to be
used for obtaining the full protein interaction networks of
Saccharomyces cerevisiae[9,10]. However, such techniques are tedious and labor-intensive. In addition, the number of possible protein interactions within one cell is enormous, a potentially limiting factor for experimental analyses. The need for faster and cheaper techniques has prompted exten-sive research in seeking complementaryin silicomethods that are capable of accurately predicting interactions.
structural information is also used to predict protein interac-tions. Lu et al. [20] employ multimeric threading algorithm to assign quaternary structures and to predict protein inter-actions. Several papers propose to predict protein interaction sites based on profiles of a residue and its neighbors [21– 23]. Bock and Gough introduced a method to predict pro-tein interactions based on the primary structure and associ-ated physicochemical properties [24]. There are also meth-ods that integrate interaction information from many diff er-ent sources [25–27].
Recently, methods for predicting protein interactions us-ing domain information are developed and preliminary re-sults have demonstrated their feasibility [26, 28–34]. The domain-based methods are motivated by the fact that proteprotein interactions are the results of physical in-teractions between their domains. In [33, 35], homology searches and clustering of domain profile pairs are used for protein interaction prediction. Kim et al. introduced a sta-tistical domain-based algorithm called “potentially interact-ing domain pair (PID)” [32]; it is similar to the associa-tion method except in how scores are calculated for all pos-sible domain pairs. Deng et al. [28] propose a probabilistic approach that employs the maximum likelihood estimation (MLE). Ng et al. [36] infer domain interactions from data collected through three different sources: experimental pro-tein interaction data, intermolecular relationship data from protein complexes, and predict data by Rosetta Stone. Those domain-based techniques only consider single-domain pair interactions; however, protein-protein interactions could be the result of multiple-domain pairs or groups of domains in-teracting with each other. Han et al. [29,30] introduced a do-main combination-based method, which considers all possi-ble domain combinations as the basic units of a protein. The domain combination interaction probability is also based on the number of interacting protein pairs containing the do-main combination pair and the number of dodo-main combi-nations in each protein. Thus, the method still suffers from a general limitation of the association method, that is, ignor-ing other domain-domain interaction information between the protein pairs. It assumes that one domain combination is independent of another. Furthermore, the domain combi-nation method is computationally more expensive than the MLE method because all possible domain combinations are considered instead of just single-domain pairs. For example, if a protein containsmdomains and the other containsn do-mains, (2m−1)×(2n−1) possible domain combination pairs between the two proteins have to be considered instead of m×nsingle-domain pairs in the MLE method.
Even though there are a number of progresses made toward protein interaction prediction using current com-putational methods, they still have a limited range of ap-plicability: the specificity and sensitivity are normally low. In this paper, we develop two domain-based statistical ap-proaches to predict protein-protein interactions. In the pro-posed methods, instead of considering single-domain pair as the basic unit of protein interactions, all the possible domain combinations will contribute to the protein interactions. In addition, the proposed models do not need to make the
assumption that domain pairs are independent of each other. We compare the methods to the MLE method, better results (in terms of the specificity and sensitivity) are obtained. Fur-thermore, the decision tree-based model can be used to infer domain-domain interactions for each predicted protein pair. The paper is organized into four sections.Section 2 in-troduces our predictive systems and methods. The experi-mental results are presented inSection 3. Finally, conclusions are drawn inSection 4.
2. SYSTEM AND METHODS
We formulate protein-protein interaction prediction prob-lems as two-class classification probprob-lems: each protein pair is a sample belonging to either “interaction” class (the two proteins interact with each other) or “noninteraction” class (the two proteins do not interact with each other). Each pro-tein pair is characterized by the domains of two propro-teins. In Section 2.1, we discuss how each sample is represented in terms of domains. In Section 2.2, we introduce a forward-pruning decision tree-based modeling, and inSection 2.3, we briefly discuss a neural network-based modeling.
2.1. Feature representation
Among all proteins in our data set, there are 4293 unique Pfam domains (for details, refer toSection 3.1). For ease of implementation, each domain is labeled with a number be-tween 1 and 4293. Each protein is represented by a vector of 4293 binary numbers where each binary number is as-sociated with the 4293 domains. For example, if a protein has a domain with label 5, then the 5th number of the fea-ture vector is 1, otherwise 0. In order to represent a protein pair, two vectors of binary numbers corresponding to each protein are concatenated to form the final input feature vec-tor (seeFigure 1). The domain labels in the second protein are increased by 4293 to distinguish domain labels between two proteins. Now, we have 8586 features and one class la-bel, where 0 and 1 represent noninteracting and interacting, respectively.
Protein 1 Protein 2
1 2 3 4 · · · 4293 4294 4295 4296 4297 · · · 8586 0 1 0 0 · · · 0 1 0 0 0 · · · 0 Protein 1 has domain 2
Protein 2 has domain 1
Figure1: Feature representation for a pair of proteins.
2.2. Forward-pruning decision tree
Decision tree is one of the most popular classification meth-ods. A decision tree is a tree consisting of two types of nodes: decision nodes and class nodes. A class node is a leaf node of a tree, which specifies a class. A decision node, also known as a nonleaf node, specifies a test to be carried out on a sin-gle attribute. An edge branches out from a decision node is associated with an attribute value.
Decision tree construction usually involves constructing and pruning. In the constructing phase, a decision tree is built level by level from a given training data set starting at the root. At each decision node, we need to select the best splitting attribute based on the measure called “goodness of split,” which assesses how well the attributes discriminate be-tween classes. A number of measures were developed to select attributes for splitting. We use the information gain [19,37] as the “goodness of split” measure, which is based on the clas-sic formula from information theory. The information gain measures the theoretical information content of a code by
ipilog(pi), wherepiis the probability of theith message. LetD=[X1,X2,. . .,Xn] represent thentraining samples
and letXi = [x1(i),x2(i),. . .,xm(i),yi] represent the ith sample
withmattributesxbelonging to the classyi. In our problem, yi = 1 represents for the “interaction” class and 0 for the “noninteraction” class. Assume that the numbers of samples in the “interaction” class and the “noninteraction” class are n1 andn2, respectively. The information needed to classify
samples given only the decision class totals as a whole is
H(C)= −P(y=0) logP(y=0) +P(y=1) logP(y=1), (1)
whereP(y) is the class probability among all samples (P(y= 1) =n1/nandP(y =0) =n2/n). The information needed
to classify samples, given knowledge of the attributexi, is de-fined as
HC|x=
2
i=1
P(x=xi)HC|x=xi, (2)
whereP(x =xi) is the probability of the attributextaking the valuexi(in our case,xcan only take ones (x1 =1) and
zeros (x2=0)).
The information needed given each attribute value, H(C|x=xi), is defined by
HC|x=xi
= −Py=0|x=xilogPy=0|x=xi −Py=1|x=xilogPy=1|x=xi,
(3)
whereP(y=yj|x=xi) is the conditional probability ofjth class given attribute value xi. Finally, the information gain (IG) measure for an attributex can be calculated with (1) and (2):
IG(x)=H(C)−HC|x. (4)
During the tree construction phase, at each decision node, the attribute with the largest information gain and which has never been selected in the branch will be selected. The information gain for each attribute is calculated by (4) based on training samples classified at the decision node. After the attribute is selected, it splits the training samples according to the attribute values. Each decision node keeps splitting until all training samples at the node belong to the same decision class or no more attribute is left for splitting. The decision class associated with majority of the training samples at each leaf node is assigned as the prediction.
In order for the decision tree to work successfully and to avoid overfitting problems, branches with little statistical sig-nificance have to be pruned or removed. Traditionally, prun-ing methods begin with a full tree constructed from a set of training data, and remove tree branches in the bottom-up fashion. It has worked well for problems with a handful of attributes. However, for our problem, we have approximately 9000 attributes, and a full tree is expected to be extremely large. Therefore, pruning after building the full tree may not be a practical idea.
A forward-pruning technique that prunes during tree construction was implemented. It stops building the tree if certain conditions are met. First, we reserved 2/3 of the train-ing data set as traintrain-ing and 1/3 as validation data set. The decision tree is then built with the training data set, and be-fore each splitting attribute is selected, classification error for that particular decision node is calculated over the validation data set. Among all validation samples that go through the branch and reach the node for classification, the classifica-tion error is just the proporclassifica-tion of misclassified samples. If the error is less than or equal to a prespecified threshold, the node stops splitting and becomes a leaf node. This makes sure that branches with little statistical validity are not pursued.
2.3. Neural network
Input layer · · · i wji
j · · ·
Hidden layer
Output layer
Figure2: Simple neural network structure.
operations and works in parallel with other neurons to solve problems quickly.
Typically, a neural network has three layers: input, hid-den, and output layers. The input layer is used to encode in-stance presented to the network for processing. The process-ing elements in the input layer are called input nodes, which may represent an attribute or feature value in the instance. In our application, each input neuron represents a domain. The hidden layer makes the network nonlinear through its hidden units. The output layer contains output units, which assign values to the input instance. The simple view of a neu-ral network structure is depicted inFigure 2.
The nodes between layers are fully connected. For exam-ple, each hidden node is connected to all input nodes, and each output node is connected to all hidden nodes. There are no connections between nodes in the same layer. All con-nections point to the same direction from the input toward the output layer. The weights associated with each connec-tion are real numbers in the range of [0, 1]. The connecconnec-tion weights are initialized to random small real numbers and are adjusted during network training. This structure can capture various combinations between domains, instead of only two domains at a time. Each domain will contribute to the net-work output, depending on the weights associated with the nodes. The network predicts a protein pair to be interact-ing if the output node value is larger than or equal to certain threshold. Normally, the threshold is set to be 0.5. In our ex-periment, we implement a multilayer feed-forward network using the delta rule.
3. EXPERIMENTAL RESULTS
3.1. Data sources
Protein-protein interaction data for the yeast organism were collected from the database of interacting proteins (DIP) [38], Deng et al. [28], and Schwikowski et al. [39]. The data set used by Deng et al. [28] is a combined interaction data experimentally obtained through two-hybrid assays on Sac-charomyces cerevisiae by Uetz et al. [10] and Ito et al. [9]. Schwikowski et al. [39] gathered their data from yeast two-hybrid, biochemical, and genetic data.
We obtained 15409 interacting protein pairs for the yeast organism from DIP, 5719 pairs from Deng et al. [28], and 2238 pairs from Schwikowski et al. [39]. The data sets were then combined by removing the overlapping interaction pairs. Because domains are the basic units of protein interac-tions, proteins without domain information cannot provide
any useful information for our prediction. Therefore, we ex-cluded the pairs where at least one of the proteins has no domain information. To further reduce noises in our data, pairs with both proteins containing only one domain, which only occurred once among all proteins, were also excluded. Finally, we have 9834 protein interaction pairs among 3713 proteins, and it is separated evenly (4917 pairs each) into training and testing data sets. Negative samples are generated by randomly picking a pair of proteins. A protein pair is con-sidered to be a negative sample if the pair does not exist in the interaction set. Total of 8000 negative samples were gen-erated and also separated into two halves. The final training and testing data set both have 8917 samples, 4917 positive and 4000 negative samples.
The protein domain information was gathered from Pfam [40], a protein domain family database, which contains multiple sequence alignments of common domain families. Hidden Markov model profiles were used to find domains in new proteins. The Pfam database consists of two parts: Pfam-A and Pfam-B. Pfam-Pfam-A is manually curated, and Pfam-B is automatically generated. Both Pfam-A and Pfam-B families are used here. In total, there are 4293 Pfam domains defined by the set of proteins.
3.2. Evaluation criteria
To evaluate the neural network and decision tree-based methods for predicting PPIs, we use both specificity and sen-sitivity. The specificity SP is defined as the percentage of matched noninteractions between the predicted set and the observed set over the total number of noninteractions. The sensitivity, denoted by SN, is defined as the percentage of matched interactions over the total number of observed in-teractions.
SP= # of true negative PPI # of observed negative PPI,
SN= # of true positive PPI # of observed positive PPI.
(5)
3.3. Predicting PPI
Training
2 3 4 Log 10 (training cycles)
−0.1 0 0.1 0.2 0.3 0.4 0.5 0.6
T
raining
er
ro
r
3 neurons 5 neurons 10 neurons 20 neurons
30 neurons 50 neurons 100 neurons 200 neurons Figure3: Comparing different number of neurons.
reached. Based on the results, we have chosen 50 hidden neu-rons and 2000 training cycles.
A decision tree is constructed over a set of training data with satisfied threshold for forward-pruning set to 0.01. Then the tree is used to classify samples in the test data set.
The results of our methods are compared with the max-imum likelihood estimation (MLE) results [14]. The MLE method is trained with false positive rate fp=1.0E−5 and false negative rate fn=0.85 over our training data.
Test results
To classify a new protein pair as either interacting or nonin-teracting, the pair is first converted to a feature vector as de-scribed inSection 2.1and then used as input in the modes. Prediction is made based on the result generated by the mod-els. For neural network, the output is a real number between 0 and 1. If the output is greater than or equal to a certain threshold (0.5), then the pair is said to be interacting. This threshold can be changed to produce an ROC curve for the neural network. In our decision tree model, the classification decision is either 0 for noninteracting or 1 for interacting. The decision tree ROC curve is constructed by tree chop-ping. When a decision tree is chopped to a certain height, its prediction accuracy in terms of specificity and sensitiv-ity would change and consequently producing a point on the ROC curve.
Figure 4compares the ROC curves of the three meth-ods: neural network, decision tree, and MLE. As shown in Figure 4, both the neural network and decision tree outper-form the MLE method.Table 1shows the prediction results that each of the three methods can achieve over the test data set. FromTable 1, we can see that with comparable
sensitiv-0 0.2 0.4 0.6 0.8 1 1.2 1-specificity
0 0.2 0.4 0.6 0.8 1 1.2
Sensiti
vit
y
NNw/80 neurons DT
MLE
Figure4: Results comparison for DT, NN, and MLE (specificity versus sensitivity on test data).
ities fixed at approximately the same level 78%, both of our methods can achieve above 60% in specificity, and MLE can only achieve specificity of 37.53%. Clearly fromFigure 4, the neural network gives the best performance, and decision tree performs almost as well. Note that the training data set for decision tree is only 2/3 of the training data set used for the neural network and MLE. Therefore, with a full training data set, accuracy of decision tree is expected to be better.
Computational speed
Among the three methods, neural network-based system is the fastest, as the neural network’s running time mainly de-pends on the number of input nodes, hidden neurons, out-put nodes, and training cycles. Number of outout-put nodes can be ignored in complexity calculation since it is one. Although the number of input nodes is extremely large, there are many zeros that do not involve in any calculation. Only the ones are considered by the network, so this is reduced to a quite small number mostly between 1 and 20. Therefore, the neu-ral network’s computation time mainly depends on the num-ber of hidden neurons and training cycles. The decision tree runs much slower than the neural network, however, is much faster than MLE methods. MLE takes the longest to run be-cause it calculates interaction probability for all possible pro-tein pairs, domain pairs, and propro-tein pairs to be observed as interacting. For each type of pairs, there are several million possibilities, and it performs the calculations for a number of iterations. When running the models on an Intel Dual Xeon 2.6 GHz computer, it took approximately 20 minutes to train the neural network and several hours for the decision tree model. A single MLE iteration took several hours to execute, and many iterations are required for the likelihood function to converge.
Table1: Confusion matrix comparing DT, NN, and MLE.
Decision tree Neural network MLE
True positive (TP) 3899 3813 3850
False positive (FP) 1488 1368 2499
True negative (TN) 2512 2632 1501
False negative (FN) 1018 1104 1067
Specificity (SP) 62.80% 65.80% 37.53%
Sensitivity (SN) 79.30% 77.55% 78.30%
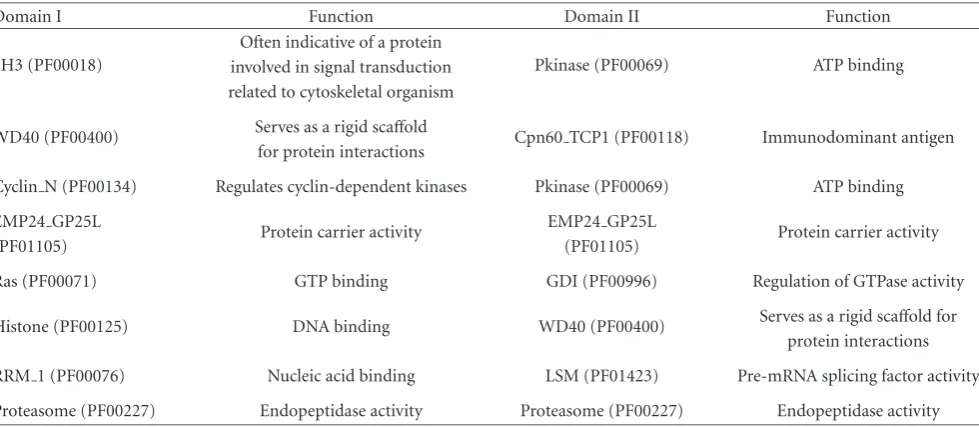
Table2: Examples of discovered interacting domain pairs.
Domain I Function Domain II Function
SH3 (PF00018)
Often indicative of a protein
Pkinase (PF00069) ATP binding involved in signal transduction
related to cytoskeletal organism
WD40 (PF00400) Serves as a rigid scaffold Cpn60 TCP1 (PF00118) Immunodominant antigen for protein interactions
Cyclin N (PF00134) Regulates cyclin-dependent kinases Pkinase (PF00069) ATP binding
EMP24 GP25L
Protein carrier activity EMP24 GP25L Protein carrier activity
(PF01105) (PF01105)
Ras (PF00071) GTP binding GDI (PF00996) Regulation of GTPase activity
Histone (PF00125) DNA binding WD40 (PF00400) Serves as a rigid scaffold for protein interactions
RRM 1 (PF00076) Nucleic acid binding LSM (PF01423) Pre-mRNA splicing factor activity
Proteasome (PF00227) Endopeptidase activity Proteasome (PF00227) Endopeptidase activity
MLE methods may become an issue, as it may take several months to train the model.
3.4. Inferring domain-domain interactions
With the decision tree method, we can also infer domain teractions. For each correctly predicted proteprotein in-teraction pairs, we can derive domains involved in the deci-sion process by looking at the branch the protein pair took to reach the prediction. The branch of the decision tree contains all domains from both proteins that contribute to the cor-rect classification. Among those involved domains, domains of two proteins with value of 1 indicate their existence in the protein pairs. Thus, these domains are interacted with each other. Apparently, we can retrieve more than two domains from each branch. This is attractive, as in some protein-protein interactions it is highly possible that more than two domains interact with each other. Most of the existing meth-ods can only identify domain pairs.
Table 2lists some of the domain interacting pairs iden-tified by the decision tree. We also found that those do-main pairs are considered to be interacting pairs with a high confidence by the InterDom, a database of putative inter-acting domains, developed by Ng et al. [34]. For example, SH3 (PF00018) and Pkinase (PF00069) are derived from a protein-protein interaction only involving single-domain
proteins. A protein is considered as a single-domain protein if it has only one domain and the domain accounts for at least 50% of the protein length. The domain interactions derived from single-domain protein interactions are usually consid-ered to be highly likely. The domain SH3 is also found to interact with Pkinase Tyr by Pfam [40]. The Pfam domain-domain interactions are determined by mapping Pfam do-mains onto the PDB structures, and interaction bonds are then identified. Pkinase and Pkinase Tyr are both members of the protein kinase superfamily clan.
Table3: Examples of domain combinations discovered.
Domains in protein I Domains in protein II
PB000001; PB051691 PF00018
PF00400; PB000886 PB012950
PF00400; PB054726 PF01237
PF00400; PB000886 PF00393
PF00172; PB043568 PF00183
PF01399; PB014525 PF00009
form an interacting domain pair with Zn clus (PF00172) by iPfam [23]; therefore, our hypothesis formed from the pre-diction results is that the Zn clus domain (PF00172) forms a domain combination with PB043568 and interacts with the HSP90 (PF00183) as a whole.
4. CONCLUSION
Proteins perform biological functions by interacting with other molecules. It is hypothesized that proteins interact with each other through specific intermolecular interactions that are localized to specific structural domains within each protein. Often, protein domains are structurally conserved among different families of proteins. Thus, understanding protein interactions at the domain level gives detailed func-tional insights onto proteins. Most of the existing domabased computational approaches for predicting protein in-teraction assume that domain pairs are independent of each other and consider the interactions between two domains only. In this paper, we develop decision tree and neural network-based models to predict protein-protein interac-tions. These systems are capable of utilizing all the possi-ble interactions between domains. For example, in the neu-ral network-based method, all domains will contribute to the prediction of protein-protein interactions with diff er-ent weights (e.g., the weights for domains that are not in-cluded in the protein pairs may be zeros). We compared our results with the maximum likelihood estimation method. The experimental results have shown that both methods can predict protein-protein interactions with higher specificity and sensitivity than the MLE method. Computationally, the MLE method needs extensive computation time and runs much slower than our methods. In addition, the decision tree method is particularly useful because domain-domain inter-actions can be inferred from the domains involved in pre-dicting protein interactions, especially, this method allows for discovering interactions of domain combinations.
ACKNOWLEDGMENT
This publication was made possible partly by the National Science Foundation under Grant no. EPS-0236913 and matching support from the State of Kansas through Kansas Technology Enterprise Corporation and by NIH Grant P20 RR17708 from the Institutional Development Award (IDeA) Program of the National Center for Research Resources.
REFERENCES
[1] S. Fields and O.-K. Song, “A novel genetic system to detect protein-protein interactions,”Nature, vol. 340, no. 6230, pp. 245–246, 1989.
[2] Y. Ho, A. Gruhler, A. Heilbut, et al., “Systematic identifica-tion of protein complexes in Saccharomyces cerevisiae by mass spectrometry,”Nature, vol. 415, no. 6868, pp. 180–183, 2002. [3] H. Zhu, M. Bilgin, R. Bangham, et al., “Global analysis of
protein activities using proteome chips,” Science, vol. 293, no. 5537, pp. 2101–2105, 2001.
[4] N. E. Williams, “Immunoprecipitation procedures,”Methods in Cell Biology, vol. 62, pp. 449–453, 2000.
[5] D. M. Bollag, “Gel-filtration chromatography,” Methods in Molecular Biology, vol. 36, pp. 1–9, 1994.
[6] J. C. Hansen, J. Lebowitz, and B. Demeler, “Analytical ul-tracentrifugation of complex macromolecular systems,” Bio-chemistry, vol. 33, no. 45, pp. 13155–13163, 1994.
[7] M. L. Doyle, “Characterization of binding interactions by isothermal titration calorimetry,”Current Opinion in Biotech-nology, vol. 8, no. 1, pp. 31–35, 1997.
[8] J. H. Lakey and E. M. Raggett, “Measuring proteprotein in-teractions,”Current Opinion in Structural Biology, vol. 8, no. 1, pp. 119–123, 1998.
[9] T. Ito, K. Tashiro, S. Muta, et al., “Toward a protein-protein interaction map of the budding yeast: a comprehensive system to examine two-hybrid interactions in all possible combina-tions between the yeast proteins,”Proceedings of the National Academy of Sciences of the United States of America, vol. 97, no. 3, pp. 1143–1147, 2000.
[10] P. Uetz, L. Giot, G. Cagney, et al., “A comprehensive analysis of protein-protein interactions in Saccharomyces cerevisiae,” Nature, vol. 403, no. 6770, pp. 623–627, 2000.
[11] R. M. Kini and J. H. Evans, “Prediction of potential protein-protein interaction sites from amino acid sequence. Identifi-cation of a fibrin polymerization site,”FEBS Letters, vol. 385, no. 1-2, pp. 81–86, 1996.
[12] S. Jones and J. M. Thornton, “Prediction of protein-protein interaction sites using patch analysis,”Journal of Molecular Bi-ology, vol. 272, no. 1, pp. 133–143, 1997.
[13] F. Pazos, M. Helmer-Citterich, G. Ausiello, and A. Valencia, “Correlated mutations contain information about protein-protein interaction,” Journal of Molecular Biology, vol. 271, no. 4, pp. 511–523, 1997.
[14] T. Dandekar, B. Snel, M. Huynen, and P. Bork, “Conservation of gene order: a fingerprint of proteins that physically inter-act,”Trends in Biochemical Sciences, vol. 23, no. 9, pp. 324–328, 1998.
[15] A. J. Enright, I. Iliopoulos, N. C. Kyrpides, and C. A. Ouzou-nis, “Protein interaction maps for complete genomes based on gene fusion events,”Nature, vol. 402, no. 6757, pp. 86–90, 1999.
[16] E. M. Marcotte, M. Pellegrini, H.-L. Ng, D. W. Rice, T. O. Yeates, and D. Eisenberg, “Detecting protein function and protein-protein interactions from genome sequences,”Science, vol. 285, no. 5428, pp. 751–753, 1999.
[17] M. Huynen, B. Snel, W. Lathe III, and P. Bork, “Predicting protein function by genomic context: quantitative evaluation and qualitative inferences,”Genome Research, vol. 10, no. 8, pp. 1204–1210, 2000.
[19] F. Pazos and A. Valencia, “Similarity of phylogenetic trees as indicator of protein-protein interaction,”Protein Engineering, vol. 14, no. 9, pp. 609–614, 2001.
[20] L. Lu, H. Lu, and J. Skolnick, “MULTIPROSPECTOR: an al-gorithm for the prediction of protein-protein interactions by multimeric threading,”Proteins, vol. 49, no. 3, pp. 350–364, 2002.
[21] P. Fariselli, F. Pazos, A. Valencia, and R. Casadia, “Prediction of protein-protein interaction sites in heterocomplexes with neural networks,”European Journal of Biochemistry, vol. 269, no. 5, pp. 1356–1361, 2002.
[22] C. Yan, V. Honavar, and D. Dobbs, “Predicting protein-protein interaction sites from amino acid sequence,” Tech. Rep. ISU-CS-TR 02-11, Department of Computer Science at Iowa State University, Iowa State, Iowa, USA, 2002.
[23] H.-X. Zhou and Y. Shan, “Prediction of protein interaction sites from sequence profile and residue neighbor list,”Proteins, vol. 44, no. 3, pp. 336–343, 2001.
[24] J. R. Bock and D. A. Gough, “Predicting protein-protein inter-actions from primary structure,”Bioinformatics, vol. 17, no. 5, pp. 455–460, 2001.
[25] R. Jansen, Y. Haiyuan, D. Greenbaum, et al., “A Bayesian net-works approach for predicting protein-protein interactions from genomic data,”Science, vol. 302, no. 5644, pp. 449–453, 2003.
[26] E. M. Marcotte, M. Pellegrini, M. J. Thompson, T. O. Yeates, and D. Eisenberg, “A combined algorithm for genome-wide prediction of protein function,”Nature, vol. 402, no. 6757, pp. 83–86, 1999.
[27] S. Martin, D. Roe, and J.-L. Faulon, “Predicting protein-protein interactions using signature products,”Bioinformatics, vol. 21, no. 2, pp. 218–226, 2005.
[28] M. Deng, S. Mehta, F. Sun, and T. Chen, “Inferring domain-domain interactions from protein-protein interac-tions,”Genome Research, vol. 12, no. 10, pp. 1540–1548, 2002. [29] D. S. Han, H. S. Kim, J. Seo, and W. H. Jang, “A domain combi-nation based probabilistic framework for proteprotein in-teraction prediction,”Genome Informatics, vol. 14, pp. 250– 259, 2003.
[30] D. S. Han, H. S. Kim, W. H. Jang, S. D. Lee, and J. K. Suh, “PreSPI: design and implementation of protein-protein inter-action prediction service system,”Genome Informatics, vol. 15, no. 2, pp. 171–180, 2004.
[31] C. Huang, S. P. Kanaan, S. Wuchty, D. Z. Chen, and J. A. Iza-guirre, “Predicting protein-protein interactions from protein domains using a set cover approach,”to appear in IEEE/ACM Transactions on Computational Biology and Bioinformatics. [32] W. K. Kim, J. Park, and J. K. Suh, “Large scale statistical
predic-tion of protein-protein interacpredic-tion by potentially interacting domain (PID) pair,”Genome Informatics, vol. 13, pp. 42–50, 2002.
[33] J.-C. Rain, L. Selig, H. De Reuse, et al., “The protein-protein interaction map of Helicobacter pylori,” Nature, vol. 409, no. 6817, pp. 211–215, 2001.
[34] S. K. Ng, Z. Zhang, S. H. Tan, and K. Lin, “InterDom: a database of putative interacting protein domains for validating predicted protein interactions and complexes,”Nucleic Acids Research, vol. 31, no. 1, pp. 251–254, 2003.
[35] J. Wojcik and V. Schachter, “Protein-protein interaction map inference using interacting domain profile pairs,” Bioinformat-ics, vol. 17, suppl. 1, pp. S296–S305, 2001.
[36] S. K. Ng, Z. Zhang, and S. H. Tan, “Integrative approach for computationally inferring protein domain interactions,” Bioinformatics, vol. 19, no. 8, pp. 923–929, 2003.
[37] J. R. Quinlan, “Discovering rules from large collections of ex-amples: a case study,” inExpert Systems in the Micro Electronic Age, D. Michie, Ed., Edinburgh University of Press, Edinburgh, Scotland, 1979.
[38] I. Xenarios, E. Fernandez, L. Salwinski, et al., “DIP: The Database of Interacting Proteins,” http://dip.doe-mbi.ucla. edu.
[39] B. Schwikowski, P. Uetz, and S. Fields, “A network of protein-protein interactions in yeast,”Nature Biotechnology, vol. 18, no. 12, pp. 1257–1261, 2000.
[40] A. Bateman, L. Coin, R. Durbin, et al., “The Pfam protein fam-ilies database,”Nucleic Acids Research, vol. 32, suppl. 1, pp. D138–D141, 2004.
Xue-Wen Chen received his Ph.D. de-gree from Carnegie Mellon University, Pittsburgh, USA, in 2001. He is currently an Assistant Professor of computer science at The University of Kansas. His research interest includes bioinformatics, machine learning, and statistical modeling.