Population Genetics of
Schistosoma mansoni
in Ugandan
Pre-school Children and Mothers
Martha Betson1, Jose C. Sousa-Figueiredo2,3, Narcis B. Kabatereine4, J. Russell Stothard2*
1Department of Production and Population Health, The Royal Veterinary College, Hatfield, Hertfordshire, United Kingdom,2Parasitology Department, Liverpool School of Tropical Medicine, Liverpool, United Kingdom,3Department of Infectious and Tropical Diseases, London School of Hygiene and Tropical Medicine, London, United Kingdom,4Vector Control Division, Ministry of Health, Kampala, Uganda
Abstract
Significant numbers of pre-school children are infected with Schistosoma mansoniin sub-Saharan Africa and are likely to play a role in parasite transmission. However, they are currently excluded from control programmes. Molecular phylogenetic studies have provided insights into the evolutionary origins and transmission dynamics ofS. mansoni, but there has been no research into schistosome molecular epidemiology in pre-school children. Here, we investigated the genetic diversity and population structure ofS. mansoni in pre-school children and mothers living in lakeshore communities in Uganda and monitored for changes over time after praziquantel treatment. Parasites were sampled from children (,6 years) and mothers enrolled in the longitudinal Schistosomiasis Mothers and Infants Study at baseline and at 6-, 12- and 18-month follow-up surveys. 1347 parasites from 35 mothers and 45 children were genotyped by direct sequencing of the cytochrome c oxidase (cox1) gene. Thecox1 region was highly diverse with over 230 unique sequences identified. Parasite populations were genetically differentiated between lakes and non-synonymous mutations were more diverse at Lake Victoria than Lake Albert. Surprisingly, parasite populations sampled from children showed a similar genetic diversity to those sampled from mothers, pointing towards a non-linear relationship between duration of exposure and accumulation of parasite diversity. The genetic diversity six months after praziquantel treatment was similar to pre-treatment diversity. Our results confirm the substantial genetic diversity ofS. mansoniin East Africa and provide significant insights into transmission dynamics within young children and mothers, important information for schistosomiasis control programmes.
Citation:Betson M, Sousa-Figueiredo JC, Kabatereine NB, Stothard JR (2013) New Insights into the Molecular Epidemiology and Population Genetics of
Schistosoma mansoniin Ugandan Pre-school Children and Mothers. PLoS Negl Trop Dis 7(12): e2561. doi:10.1371/journal.pntd.0002561
Editor:Marı´a-Gloria Basa´n˜ez, Imperial College London, Faculty of Medicine, School of Public Health, United Kingdom
ReceivedMay 10, 2013;AcceptedOctober 14, 2013;PublishedDecember 12, 2013
Copyright:ß2013 Betson et al. This is an open-access article distributed under the terms of the Creative Commons Attribution License, which permits
unrestricted use, distribution, and reproduction in any medium, provided the original author and source are credited.
Funding:This work was supported by the Wellcome Trust (www.wellcome.ac.uk). The grant number is WT085440MA. The funders had no role in study design,
data collection and analysis, decision to publish, or preparation of the manuscript.
Competing Interests:The authors have declared that no competing interests exist.
* E-mail: jrstoth@liv.ac.uk
Introduction
The neglected tropical disease schistosomiasis, remains a significant public health problem, particularly in sub-Saharan Africa (SSA), and is caused by infection with parasites of the genus Schistosoma [1]. In SSA Schistosoma mansoni is responsible for intestinal schistosomiasis and is associated with pathologies ranging from diarrhoea and anaemia to hepatosplenomegaly and portal hypertension [2]. Although S. mansoni infects tens of millions of individuals across SSA, its distribution is heterogeneous as its life-cycle depends on water contact, poor sanitation and the presence of suitable habitats for the intermediate host, freshwater snails of the genusBiomphalaria[3,4].
National Control Programmes for schistosomiasis have been established in a number of African countries [5]. These programmes are based on regular mass distribution of the anthelminthic drug praziquantel to school-aged children and their main aim is control of morbidity. School-aged children have been particularly targeted because they usually show the highest infection intensities. However, recent work has demonstrated that infants and pre-school children are also at high risk of infection and can benefit from praziquantel treatment [6,7]. In 2012, new
targets were set by WHO calling for elimination of schistosomi-asis in certain African countries by 2020 [8]. To reach these goals, it will be necessary to implement measures such as snail control and health education in addition to preventive chemo-therapy, and to target the whole community including pre-school children [1].
Particularly high levels of genetic diversity have been observed in East AfricanS. mansonipopulations [17,20–23]. Barcoding ofS. mansonicollected from school-aged children andBiomphalariasnails on the shores of Lake Albert (LA) in Uganda and Lake Victoria (LV) in Kenya, Tanzania and Uganda revealed extensive population diversity with genetic differentiation between LA and LV [17,18]. Interestingly, most parasite diversity was at the level of the individual host rather than at the level of geographical location [17]. Similar levels of within-child diversity have been observed in Kenya using microsatellite markers [22].
To date there have been no studies investigating the genetic structuring of Schistosoma populations in pre-school children. It could be hypothesised that because the cumulative exposure and infection window has been shorter for younger children than school-aged children or adults, parasite diversity in pre-school children may be lower than in older individuals. However, heterogeneities in local transmission may also be more manifest in younger children [24]. The aim of this study was to investigate the genetic diversity and population structuring ofS. mansoniparasites in a cohort of pre-school children and their mothers living in Ugandan lakeshore communities before and after praziquantel treatment, in so doing we hoped to address the role of young children in local parasite transmission.
Methods
Ethics statement
The London School of Hygiene and Tropical Medicine (LSHTM 5538.09) and the National Council of Science and Technology, Kampala, Uganda, granted ethical approval for the Schistosomiasis in Mothers and Infants (SIMI) study. Before selection, all families received an information leaflet describing the study objectives and procedures, which were explained in detail by the local Vector Control Division district officer. Informed consent documented by signature or fingerprint (in cases of illiteracy) was obtained from each mother on her own behalf and on behalf of her child or children who were participating in the study. Fingerprint consent procedures were specifically approved by the
research ethics committees of the London School of Hygiene and Tropical Medicine and the Ugandan National Council of Science and Technology.
Epidemiological surveys
Schistosome parasites were collected during the SIMI longitu-dinal study carried out in six communities on the shores of LA and LV in Uganda [6,7,25]. 1856 mothers and children under six were recruited into the study at baseline and followed-up at three, six, 12 and 18 months (LV only) after baseline survey. At each time point parasitological assessment ofS. mansoniwas carried out [25]. At baseline all participants were offered praziquantel (40 mg/Kg) and albendazole (400 mg) according to WHO treatment guidelines [26]. At subsequent surveys, praziquantel was provided on the basis of a positive cathodic-circulating antigen (CCA) test [27]. At each timepoint, malaria treatment (artemether-lumefantrine) was provided to study participants on the basis of a positive malaria rapid diagnostic test (RDT) result (Paracheck or First Response). During each survey mothers were asked a suite of questions on behalf of themselves and their child(ren) pertaining to health-seeking behaviour, water-contact and socio-economic status. Copies of the questionnaire are available on request from the corresponding author. Anaemia and faecal occult blood (FOB) were assessed as reported [25,28] and clinical examination of liver and spleen pathology was carried out as described [29].
Sample collection
At baseline schistosome eggs were isolated from the stool of participants who were egg-patent or CCA-positive forS. mansoni infection. Particular effort was made to obtain eggs from family groups. During subsequent surveys, eggs were collected from the same individuals sampled at baseline or members of the same family (ifS. mansonipositive). In addition, for the 6 month survey at Bugoigo a selection of samples for egg isolation was chosen at random from a list of schistosome-positive individuals. To obtain eggs, stool samples were diluted in bottled water and an adaptation of the Pitchford-Visser funnel method was used [18]. After isolation, eggs were exposed to light for several hours to stimulate miracidial hatching. Individual miracidia and/or eggs were harvested under a dissecting microscope and placed on FTAH indicator cards (Whatman). Alternatively miracidia/eggs were placed in wells of a 96-well PCR plate, each well containing 7.5ml of RNAlaterH (Ambion, Life Technologies Ltd). Samples were transported to the UK for molecular analysis.
DNA extraction andcox1 PCR
2.0 mm punches were taken from the centre of each parasite spot on FTAHcards and processed as described [20]. DNA was extracted from samples in RNALaterH using the DNAeasy (Qiagen Ltd) [30] or the GeneJet (Fermentas, ThermoFisher Scientific Ltd) genomic DNA extraction kits according to the manufacturers’ instructions. A 540 bp fragment was amplified from the FTA punch or 3ml of genomic DNA using the ASMIT1 [18] and Cox1_Schist_39 [10] primers and illustraTM puReTaq Ready-To-Go PCR Beads (GE Healthcare). The following cycling conditions were used: 95uC for 1 min, 40 cycles of 95uC for 30 s, 40uC for 30 s and 72uC for 2 min, with a 7 min extension of 72uC. PCR products were cleaned using the QIAquick PCR purification kit (Qiagen Ltd) or SureClean reagent (BioLine Reagents Ltd) according to the manufacturers’ instructions. Samples were sequenced on a 31306l Genetic Analyser (Applied Biosystems) running BigDye v3.1 sequencing chemistry.
Author Summary
Cox1 sequence and phylogenetic analysis
DNA sequences were manually edited using CLC Workbench v6 based on inspection of sequence chromatograms and truncated to the 396 bp ASMIT region for comparison withcox1 sequences from previous studies [17,18,31]. BLAST was used to search for exact sequence matches in Genbank. Sequences were aligned in MacClade v4.05 and Collapse v1.2 was used to identify samples with identical haplotypes. The sequences of novel haplotypes (H176–H359) were submitted to Genbank (accession numbers KC964660–KC964848). To determine efficiency of schistosome sampling, the cumulative number of unique haplotypes was plotted against sequentially sampled infrapopulations (individual hosts) [32]. Phylogenetic analysis of all identified haplotypes was carried out in MEGA v5 [33].Cox1 sequences representing the five lineages of S. mansoni across Africa [20] were included for comparison and an S. rodhaini cox1 sequence was used to root trees. Bootstrapping (1000 replicates) was carried out to test branch reliability.
Population genetic analysis
Sequences from all parasite samples were imported into DNASP v5 [34]. Haplotype diversity (h), overall nucleotide diversity (P) (with Jukes-Cantor corrections) [35,36] and nucleo-tide diversity for synonymous and non-synonymous substitutions were determined for the whole population of parasites sampled, and parasite populations stratified by host type (mother or child), lake, village, survey timepoint and individual host (where $6 parasites were barcoded). Genetic diversity in individual hosts/ infrapopulations was summarised by host type, lake and survey timepoint so that comparisons could be made with genetic diversity measures based on pooled samples (infrapopulation approach versus component population approach) [23,37]. As diversity data were not normally distributed, the median was chosen as the measure of central tendency and confidence intervals calculated using the binomial exact method [38]. To take into account the potential relatedness of miracidia within individual hosts, genetic differentiation between parasite popula-tions was analysed using a hierarchical analysis of molecular variance (AMOVA) procedure in Arlequin v3.5.1.2 [23,39]. Statistical tests of genetic differentiation were carried out using 10000 random permutations. In addition, pairwise analysis of gene flow between parasite infrapopulations was carried out in Arlequin using the WST estimator together with permutation tests (10000
random permutations) of genetic differentiation. The net mean genetic distance [40] between infrapopulations was determined in MEGA and used to draw phylogenetic trees.
Statistical analysis
For baseline data, statistical associations were investigated (using non-parametric tests) between haplotype and nucleotide diversity in individual hosts (from whom$6 parasites were sequenced) and lake, host type (mother or child), host age, infection intensity (number of eggs per gram of stool) and a history of prazi-quantel treatment (mothers only). To examine associations between morbidity and schistosome diversity, study participants were classified as anaemic if they had a haemoglobin level
,11.0 g/dL and FOB positives were categorised as described [25]. Liver and spleen pathology were inferred on the basis of an enlarged liver/spleen and/or a firm/hard liver/spleen consistency [29]. A categorical variable was created to capture overall morbidity, with 0 representing no anaemia, FOB, liver or spleen pathology, 1 representing the presence of one morbidity maker, 2 the presence of two markers and 3 the presence of three/more markers. All statistical analysis was carried out in Stata v11.
Accession numbers S. mansoni cox1 haplotypes
V7: FJ750538; V3: FJ750534; A7: FJ750530; H1: GQ415163; H2: GQ415167; H4: GQ415169; H8: GQ415171; H10: GQ415173; H14: GQ415176; H16: GQ415179; H17: GQ415182; H18: GQ415185; H20–H23: GQ415189–92; H29: GQ415200; H31: GQ415202; H35: GQ415208; H36: GQ415211; H38: GQ415215; H41: GQ415218; H42: GQ415220; H46: GQ415227; H47: GQ415228; H50: GQ415231; H53: GQ415234; H54: GQ415235; H60: GQ415242; H63: GQ415245; H65: GQ415247; H67: GQ415249; H75: GQ415258; H77–H79: GQ415261–3; H84: GQ415268; H87: GQ415271; H89: GQ415273; H92: GQ415276; H99: GQ415283; H100: GQ415284; H103: GQ415288; H106: GQ415291; H107: GQ415292; H116: GQ415301; H117: GQ415302; H123: GQ415308; H124: GQ415309; H126: GQ415311; H128: GQ415313; H131: GQ415316; H136: JF290433; H137: HM055378; H140: HQ839768; H146: JF274042; H150: JF274046; H153: JF440336; H155: JF508492; H158: JF508495; H176–H359: KC964660–848 (release date 1 Aug 2013); CA1b: JQ289589; CA1f: JQ289593; CA1h: JQ289595; CK1e: JQ289600; CK1g: JQ289602; CK1h: JQ289603; CK1j: JQ289605; CK1l–CK1n: JQ289607–9; CK1u: JQ289616; EG1: JQ289620; KE1: JQ289618; NI1a: JQ289624; NI1g: JQ289630; NI1h: JQ289631; NI1k: JQ289634; NI1m: JQ289636; NI1p: JQ289639; SA1b: JQ289653; SE2a: JQ289655; SE2c: JQ289657; SE2j: JQ289668; SE3e: JQ289682; SE4c: JQ289690; TA1c: JQ289693; TA1g: JQ289697; TA1h: JQ289698; TA1n: JQ289704; TA1p: JQ289706; UG3a: JQ289716; UG3b: JQ289717; UG4a: JQ289721; UG4e: JQ289725; ZA1b–ZA1j: JQ289728–36.
S. rodhaini cox1: JQ314100
Results
Haplotypes
Schistosoma mansoni cox1 sequences were obtained from 1347 parasites collected from 35 mothers and 45 children. The cox1 region was highly diverse with 246 different haplotypes identified, of which 184 were novel. Figure 1 shows how often each haplotype was identified in parasites collected from mothers and children at baseline and six month follow-up. H1 was very common at both lakes, whereas other haplotypes (e.g. H2, H8, H10 and H23) were more common at one lake rather than the other. In addition, a number of haplotypes were extremely rare, only being identified once during the study. Plotting the cumulative number of unique haplotypes identified against sequentially sampled hosts (each representing a parasite infrapopulation) suggested that the infrapopulations sampled were not fully representative of the cox1 haplotype diversity at either lake, as the curves did not approach the asymptote after 36 infrapopulations for LA or 28 infrapopulations for LV (Figure 2). Consistent with this, 70 haplotypes not sampled at baseline were identified in follow-up surveys.
Phylogenetic analysis
Figure 1. Haplotype abundance barcharts for Lake Albert (A) and Lake Victoria (B).The main barcharts display haplotypes recovered during the baseline surveys and the inset barcharts display haplotypes isolated during the six-month follow up surveys. Dark grey bars indicate haplotypes identified in mothers whereas light grey bars represent haplotypes isolated from children. ‘‘Single’’ refers to unique haplotypes which were only identified once during the surveys.
and Coastal Kenya), one haplotype (H265) in lineage 1 (West Africa, Brazil and Asia) and one (H343) in lineage 3 (Central West Africa and Niger). Very similar tree topologies were generated using the Neighbour-Joining, Maximum Parsimony and Mini-mum Evolution methods.
Genetic diversity
High levels of haplotype and nucleotide diversity in thecox1 region were found in schistosome parasites sampled at each lake (Table 1) and similar levels of diversity were observed when the data were stratified by village (Table 2). Surprisingly, except for Bugoto village, parasite populations sampled from children were as diverse as those sampled from their mothers (Tables 1 and 2). Parasite populations were also highly diverse in thecox1 region at the infrapopulation level and similar levels of diversity were found in parasites sampled from individual mothers and children, whether related or unrelated (Tables S1 and S2). In addition,S.
mansoniparasites sampled at six, 12 and 18 months were highly diverse (Table 1). When nucleotide diversity at synonymous and non-synonymous sites was compared between lakes, villages and mothers and children, similar levels of diversity at synonymous sites were found in mothers and children and in different locations (Tables 1 and 2). However, the diversity at non-synonymous sites appeared higher at LV than in LA. This was consistent in mothers and children and between villages (Table 2).
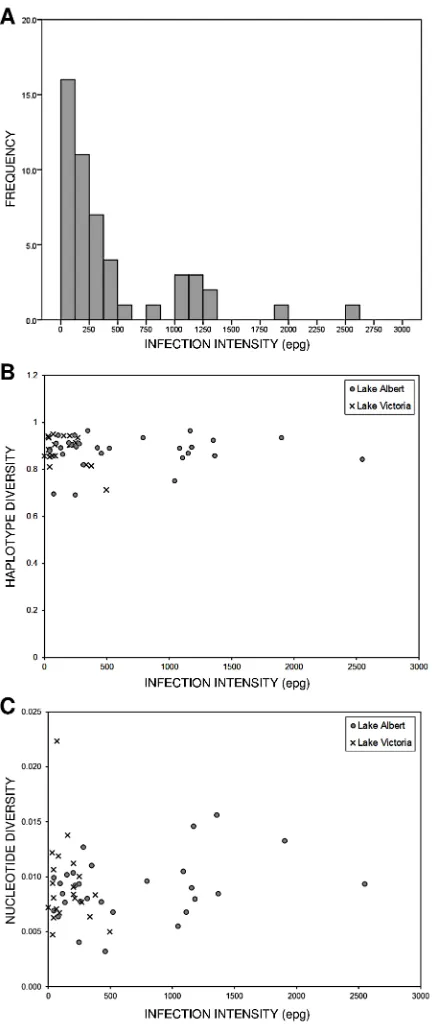
The associations between schistosome cox1 diversity and host type (mother or child), lake, history of praziquantel treatment, infection intensity and morbidity were investigated at baseline. There was no evidence for an association between host type, lake and praziquantel treatment history and haplotype or nucleotide diversity (data not shown). Interestingly, nucleotide diversity at non-synonymous sites was associated with lake (Wilcoxon’s W= 156.5;p= 0.004;N= 50). There was no correlation between infection intensity and haplotype diversity (Spearman’s r=
Figure 2. Cumulative number of unique haplotypes identified at baseline plotted against the identification code of each sequentially sampled host from Lake Albert (A) and Lake Victoria (B).
20.0287; p= 0.834;N= 50), or nucleotide diversity (Spearman’s
r= 0.1974; p= 0.766; N= 50) (Figure 4), however nucleotide diversity at non-synonymous sites was negatively correlated with infection intensity (Spearman’sr=20.3429;p= 0.015;N= 50). In addition, there was some evidence for a positive correlation between nucleotide diversity at non-synonymous sites and age in children (Spearman’s r= 0.3426; p= 0.074; N= 28). Finally, no association was observed between any individual morbidity marker and genetic diversity (data not shown), nor was there evidence of an association between overall morbidity and haplotype diversity (x2
= 0.574;p= 0.9023;N= 36) or nucleotide diversity (x2
= 1.704;p= 0.636;N= 36).
Genetic differentiation
AMOVA analysis, with groups defined based on location or host type, revealed that variation in parasite populations within individual hosts accounted for most of genetic variation observed (Tables 3, 4 and S3). Nevertheless there was evidence of restricted gene flow between parasite populations at LA and LV but not between mothers and children (Tables 3 and 4) or between individual villages at LA or LV (Table S3). Interestingly, there was evidence of genetic differentiation between infrapopulations at LV but not at LA, although this only accounted for,3.5% of overall variation (Tables 4 and S3). Comparison of parasite populations sampled at different time points revealed little differentiation
Figure 3. A neighbour joining tree based on Kimura-2-parameters representing phylogenetic relationships between haplotypes identified during the baseline surveys and selected haplotypes from across the globe.Black dots represent branches for which bootstrap support was over 75% (1000 replicates). Most haplotypes fall into lineage 2 as identified by Websteret al.[20]. Haplotypes falling into lineages 1, 3, 4 and 5 are indicated using red oval outlines.
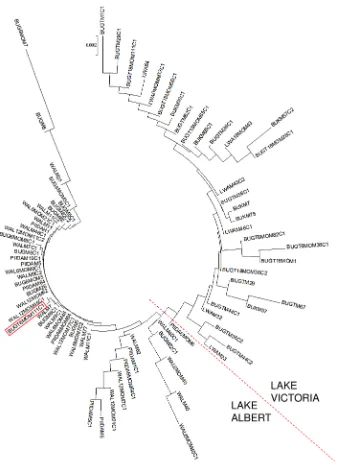
between populations collected at baseline and 6 months or 12 months in Bugoigo, Walukuba or Piida (LA), however there was evidence of differentiation between parasites obtained at different timepoints from Bugoto (Table 5). Pairwise analysis of gene flow between infrapopulations revealed little differentiation between infrapopulations in LA villages at baseline or in follow-up surveys (data not shown). For LV, the pattern was more complex with restricted gene flow between some infrapopulations, even within the same village. Phylogenetic analysis revealed that infrapopula-tions from LA clustered together and those from LV clustered together (Figure 5). Overall the genetic distances between infrapopulations from LV were larger than between tions from LA. However, there was no clustering of infrapopula-tions by survey timepoint.
Discussion
This is the first study to investigate the population genetics ofS. mansoni in pre-school children. We found similar high levels of genetic diversity in pre-school children and their mothers, both at baseline and after praziquantel treatment. Overall diversity was comparable between LA and LV and between individual villages. However, nucleotide diversity at non-synonymous sites was significantly higher in LV than LA. There was also evidence of
genetic differentiation between parasite populations at the two lakes.
Our results are consistent with a number of studies demon-strating thatS. mansoniis highly diverse in East Africa [11,20,23]. Interestingly, despite barcoding over 1340 individual parasites and identifying 184 novel haplotypes, it appears that our sampling did not capture the fullcox1 diversity at either lake (Figure 2). Although this could be considered a limitation of our study, it is consistent with the fact that newcox1 haplotypes are identified every timeS. mansoniis sampled from East Africa [17,18,20,31,41]. Based on mathematical models of microsatellite data, French et al. have suggested that sampling more hosts (infrapopulations) rather than more miracidia per host leads to more robust estimates of parasite population diversity [37]. It is important to have effective sampling strategies in place for research and monitoring and evaluation of control programmes, however given the level of variation which we and others have observed, it is likely to be very difficult to obtain a truly representative sample ofS. mansonidiversity in East Africa.
Our observation that genetic diversity is similar in mothers and young children is somewhat unexpected. Diversity inSchistosoma infrapopulations could be anticipated to depend on the degree of host exposure to genetically diverse parasites in the environment and on parasite interaction with the host immune system. Our
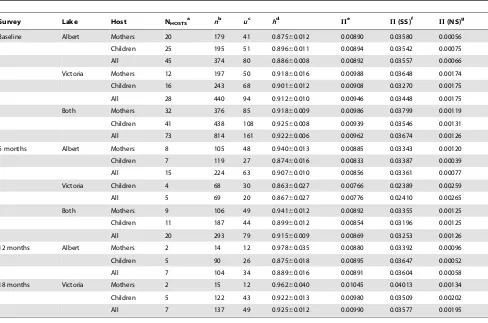
Table 1.Cox1 diversity stratified by host type, lake system and survey timepoint.
Survey Lake Host NHOSTSa nb uc hd Pe P(SS)f P(NS)g
Baseline Albert Mothers 20 179 41 0.87560.012 0.00890 0.03580 0.00056
Children 25 195 51 0.89660.011 0.00894 0.03542 0.00075
All 45 374 80 0.88660.008 0.00892 0.03557 0.00066
Victoria Mothers 12 197 50 0.91860.016 0.00988 0.03648 0.00174
Children 16 243 68 0.90160.012 0.00908 0.03270 0.00175
All 28 440 94 0.91260.010 0.00946 0.03448 0.00175
Both Mothers 32 376 85 0.91860.009 0.00986 0.03799 0.00119
Children 41 438 108 0.92560.008 0.00939 0.03546 0.00131
All 73 814 161 0.92260.006 0.00962 0.03674 0.00126
6 months Albert Mothers 8 105 48 0.94060.013 0.00885 0.03343 0.00120
Children 7 119 27 0.87460.016 0.00833 0.03387 0.00039
All 15 224 63 0.90760.010 0.00856 0.03361 0.00077
Victoria Children 4 68 30 0.86360.027 0.00766 0.02389 0.00259
All 5 69 20 0.86760.027 0.00776 0.02410 0.00265
Both Mothers 9 106 49 0.94160.012 0.00892 0.03355 0.00125
Children 11 187 44 0.89960.012 0.00854 0.03196 0.00125
All 20 293 79 0.91560.009 0.00869 0.03253 0.00126
12 months Albert Mothers 2 14 12 0.97860.035 0.00880 0.03392 0.00096
Children 5 90 26 0.87560.018 0.00895 0.03647 0.00052
All 7 104 34 0.88960.016 0.00891 0.03604 0.00058
18 months Victoria Mothers 2 15 12 0.96260.040 0.01045 0.04013 0.00134
Children 5 122 43 0.92260.013 0.00980 0.03509 0.00202
All 7 137 49 0.92560.012 0.00990 0.03577 0.00195
a
NHOSTS= number of hosts;
b
n= number of haplotypes; c
u= number of unique haplotypes; d
h= haplotype diversity; e
P= nucleotide diversity; f
P(SS) = nucleotide diversity at synonymous sites; g
findings contradict the hypothesis, based on a trickle model of infection [42,43], that young children would show lowerS. mansoni genetic diversity than mothers due to a shorter cumulative exposure window. Using small GPS dataloggers, we have demonstrated that young children come into contact with water at the margins of Lake Albert for around 30 minutes each day [44]. It is possible that the trickle dynamic becomes rapidly saturated, i.e. the majority of exposures result in infection in the first five minutes and not much longer, with subsequent acquisition of new genotypes as they emerge from snails. In addition, we have shown that young children can become infected with S. mansoni from six months of age [45]. The fact that by two years of age some children had acquired highly diverse infections suggests that a cumulative exposure window of up to 1.5 years is sufficient. Although we did not observe a correlation between infection intensity and parasite diversity, which is somewhat counter-intuitive, infections must be egg patent for successful harvesting of eggs using the Pitchford-Visser method, which may bias sampling towards individuals with a higher burden of infection [46]. Alternatively, the sample size (50 infrapopulations) may not have been large enough to detect a correlation between infection intensity and diversity. Interestingly, there was some suggestion of a positive correlation between host age andcox1 diversity at non-synonymous sites in children, potentially because of the more
developed immune system in older children. Diversifying selection by host immune systems is an important explanation for pathogen antigenic variation [47] and there is evidence that host immunity drives genetic diversity in (male) schistosomes [48]. Since cox1 encodes an intracellular protein, it is not exposed to the immune system in intact schistosomes, but it is conceivable that particular cox1 haplotypes are associated with specific polymorphisms in antigens under selection pressure. As a mitochondrial gene,cox1 variation is only related to the diversity of female worms, but it is possible that host immunity also drives diversity in female schistosomes. Inspection of genetic variation within genes whose products are under immune-surveillance would be informative.
Consistent with previous work, we found evidence for genetic differentiation betweenS. mansonipopulations at LA and LV [18]. This is unsurprising given that the field sites on the two lakes are over 300 km apart and that, based on questionnaire data, there was little evidence of individuals moving between the two lakes. Furthermore, human populations are different on the two lakes, with individuals on LA belonging mainly to the Bugungu and Alur tribes and those on LV belonging to the Busoga people. Interestingly, cox1 diversity at non-synonymous sites was higher at LV than LA, which may reflect differences in diversifying selection caused by host immunity at the two lakes. The snail intermediate host may also play a role, since the composition of
Table 2.Cox1 diversity stratified by host type and village at baseline and 6 months.
Survey Village Host NHOSTSa nb uc hd Pe P(SS)f P(NS)g
Baseline Bugoigo Mothers 5 61 20 0.87060.025 0.00946 0.03858 0.00044
Children 6 54 21 0.90960.021 0.01011 0.04077 0.00074
All 11 115 34 0.89860.013 0.00977 0.03962 0.00058
Walukuba Mothers 10 74 21 0.88960.018 0.00875 0.03524 0.00054
Children 10 86 26 0.87460.020 0.00825 0.03181 0.00093
All 20 160 40 0.87960.013 0.00845 0.03327 0.00075
Piida Mothers 5 44 13 0.85260.027 0.00833 0.03268 0.00076
Children 9 55 20 0.90060.022 0.00906 0.03665 0.00048
All 14 99 28 0.88060.017 0.00868 0.03464 0.00061
Bugoto Mothers 4 27 15 0.90960.038 0.01435 0.05819 0.00141
Children 9 131 48 0.92960.014 0.00952 0.03280 0.00229
All 13 158 54 0.92860.013 0.01047 0.03765 0.00214
Bukoba Mothers 5 68 23 0.91260.022 0.01045 0.03879 0.00172
Children 5 68 24 0.89960.026 0.00848 0.03252 0.00105
All 10 136 34 0.91060.018 0.00952 0.03583 0.00140
Lwanika Mothers 3 102 27 0.87660.025 0.00803 0.02804 0.00181
Children 2 44 18 0.88860.030 0.00844 0.03180 0.00120
All 5 146 48 0.88860.020 0.00824 0.02952 0.00163
6 months Bugoigo All 5 78 25 0.88960.019 0.00895 0.03418 0.00110
Walukuba All 7 99 34 0.91260.015 0.00832 0.03332 0.00054
Piida All 3 47 19 0.89560.027 0.00739 0.02875 0.00071
Bugoto All 3 47 23 0.84760.032 0.00798 0.02413 0.00291
Lwanika All 1 21 13 0.83860.067 0.00626 0.02148 0.00153
a
NHOSTS= number of hosts;
b
n= number of haplotypes; c
u= number of unique haplotypes; d
h= haplotype diversity; e
P= nucleotide diversity; f
P(SS) = nucleotide diversity at synonymous sites; g
Biomphalariasnail populations is different at the two lakes, withB. stanleyifound only at LA,B. choanomphalaonly at LV andB. sudanica and B. pfeifferi at both lakes [49–52]. Variations in S. mansoni -associated morbidity have been observed between LA and LV which may be due, at least in part, to genetic differentiation between schistosome populations, leading to somewhat different host pathologies [7,25,53].
Figure 4. Relationship between infection intensity and genetic diversity at baseline. (A) Histogram displaying typical ‘‘overdis-persed’’ distribution ofS. mansoniinfections at baseline. (B) Haplotype diversity of parasites isolated from individual hosts plotted against host infection intensity. (C) Nucleotide diversity of parasites isolated from individual hosts plotted against host infection intensity.
doi:10.1371/journal.pntd.0002561.g004
Table
3.
AMOVA
results
for
mothers
and
children
showing
evidence
of
genetic
differentiation
between
lake
systems
at
baseline.
Mothers
Children
Source
of
variation
Sum
of
squares
Variance
c
omponents
%
of
variation
WST
a
P
value
b
Sum
of
squares
Variance
c
omponents
%
of
variation
WST
P
value
Between
lakes
34.7
0.171
8.4
0.0845
,
0.0001
34.2
0.148
7.7
0.0768
,
0.0001
Among
hosts
within
lake
regions
69.5
0.049
2.3
0.1071
0.022
8
1.97
0.035
1.8
0.0950
0.037
Within
hosts
620.5
1.804
89.3
0.0248
,
0.0001
690.1
1.697
90.5
0.0197
,
0.0001
aW
ST
estimator
o
f
g
enetic
differentiation;
bP
value
from
permutation
test
of
genetic
differentiation
(10000
p
ermutations).
doi:10.1371/journal.pntd
Intriguingly, whereas there was little genetic structuring between parasite populations in individual hosts at LA, there was genetic differentiation between infrapopulations at LV. This could reflect the fact that the lake shore of LV is more convoluted than that of LA, providing micro-environments for transmission. Such micro-environments could mean that even individuals living in the same village are exposed to different parasite populations, depending on where and when they come into contact with infested water. In all villages there was generally little evidence of genetic differentiation between parasite infrapopulations from hosts belonging to the same family. The transmission dynamics of S. mansoni are substantially different at LA and LV: overall infection prevalence at baseline was higher at LA than LV and
individuals were more rapidly re-infected at LA [6,7], which could also influence parasite populations.
Similar levels ofS. mansonigenetic diversity were observed at the lake, village and host level in follow-up surveys after praziquantel treatment, suggesting that six months is sufficient for acquisition of diverse infections and that therapy did not impact on the host immune system to reduce diversity. There was generally little genetic differentiation between parasite populations pre- and post-treatment at LA. At LV schistosome populations did show different genetic structures at baseline and six months, although this could be because parasites were successfully sampled from only three children at six months compared with nine at baseline. When parasite populations from the same hosts were compared
Figure 5. Neighbour joining tree based on the net mean genetic distances between individual infrapopulations sampled at baseline and in follow-up surveys.The red-dotted line indicates the almost-complete segregation between infrapopulations from Lake Albert and those from Lake Victoria. The red rectangle highlights one infrapopulation from Lake Victoria which clusters with infrapopulations from Lake Albert. BUG = Bugoigo; WAL = Walukuba; PIIDA = Piida; BUGT = Bugoto; BUK = Bukoba; LWA = Lwanika. 6 MO = 6 month follow-up; 12 MO = 12 month follow-up; 18 MO = 18 month follow-up. M* = identification code for a mother host; M*C1 or M*C2 = identification code for a child host.
between surveys, there was generally little evidence of genetic differentiation between surveys with infrapopulations clustering by lake rather than timepoint. Overall these results suggest that parasite population structure in the lake-shore communities was relatively stable over the study period. Although we did not directly test the clearance of parasites after praziquantel treatment in the present study, we have recently published data from the same villages demonstrating that cure rates were low in very young children and those with a history of previous praziquantel treatment [54]. Thus, it is also possible our findings could represent non-clearance of parasites as well as or rather than reinfection from a pool of parasites with a stable population structure. In contrast to our results, a reduction in genetic diversity in S. mansoni sampled from Tanzanian school children was observed after one round of treatment and genetic differentiation between pre- and post-treatment populations [55]. These differing findings may reflect the fact that only a subset of mothers and children in the communities were treated during our study in contrast to most school children in the Tanzanian study. In addition, different molecular markers were used and differences in ecology, transmission dynamics and water contact patterns are likely.
It is now evident that pre-school children can become infected with S. mansoni at an early age [6], but their role in S. mansoni transmission is still somewhat unclear. A comparison of cox1 haplotypes identified only in parasites from pre-school children with haplotypes discovered in cercariae shed by Biomphalaria [17,31] has revealed two haplotypes (H150 at LA and H29 at LV) which are found in both pre-school children and snails. This provides circumstantial evidence that young children play a role in S. mansonitransmission but further work is required to confirm this. If true, the high genetic diversity ofS. mansoni in young children suggests that they could be currently operating as local refugia of meta-populations, providing pools of susceptible genes to dilute genes conferring praziquantel tolerance selected in treated populations (i.e. school children) [56]. High diversity also means that parasites in pre-school children may act as a source of other
genetic traits and highlights the need to monitor praziquantel effectiveness and changes in parasite population structure in pre-school children once treatment begins.
To conclude, this study provides novel insights into the epidemiology, genetic diversity and population dynamics of S. mansoni in young children and mothers in Uganda, important information for effective ongoing control of intestinal schistosomi-asis.
Supporting Information
Table S1 Cox1 diversity stratified by individual host.
(DOC)
Table S2 Cox1 diversity in infrapopulations
summa-rised by host type, lake system and survey timepoint. (DOC)
Table S3 AMOVA results showing little evidence of
genetic differentiation between villages at Lake Albert or Lake Victoria at baseline.
(DOC)
Acknowledgments
We would like to thank all the mothers and children who participated in the Schistosomiasis in Mothers and Infants study. We are also very grateful to technicians from the Vector Control Division, Ugandan Ministry of Health, for expert field assistance and to S. Appleton for lab assistance. RVC manuscript number: PPH_00555.
Author Contributions
Conceived and designed the experiments: JRS NBK JCSF. Performed the experiments: MB JCSF. Analyzed the data: MB. Contributed reagents/ materials/analysis tools: NBK JRS. Wrote the paper: MB. Collected samples and epidemiological data: MB JCSF JRS. Critically revised the manuscript: NBK JCSF JRS. Approved final version of manuscript: MB JCSF NBK JRS.
References
1. WHO (2013) Sustaining the drive to overcome the global impact of neglected tropical diseases. Geneva: WHO.
2. Gryseels B, Polman K, Clerinx J, Kestens L (2006) Human schistosomiasis. Lancet 368: 1106–1118.
3. Brooker S, Clements ACA (2009) Spatial heterogeneity of parasite co-infection: Determinants and geostatistical prediction at regional scales. Int J Parasitol 39: 591–597.
4. Standley CJ, Adriko M, Alinaitwe M, Kazibwe F, Kabatereine NB, et al. (2009) Intestinal schistosomiasis and soil-transmitted helminthiasis in Ugandan schoolchildren: a rapid mapping assessment. Geospatial Health 4: 39–53. 5. Fenwick A, Webster JP, Bosque-Oliva E, Blair L, Fleming FM, et al. (2009) The
Schistosomiasis Control Initiative (SCI): rationale, development and implemen-tation from 2002–2008. Parasitology 136: 1719–1730.
6. Stothard JR, Sousa-Figueiredo JC, Betson M, Bustinduy A, Reinhard-Rupp J (2013) Schistosomiasis in African infants and preschool children: let them now be treated! Trends Parasitol 29: 197–205.
7. Stothard JR, Sousa-Figueiredo JC, Betson M, Green HK, Seto EY, et al. (2011) Closing the praziquantel treatment gap: new steps in epidemiological monitoring and control of schistosomiasis in African infants and preschool-aged children. Parasitology 138: 1593–1606.
8. WHO (2012) Accelerating work to overcome the global impact of neglected tropical diseases. A roadmap for implementation. Geneva: WHO.
9. Despres L, Imbert-Establet D, Combes C, Bonhomme F (1992) Molecular evidence linking hominid evolution to recent radiation of schistosomes (Platyhelminthes: Trematoda). Mol Phylogenet Evol 1: 295–304.
10. Lockyer AE, Olson PD, Ostergaard P, Rollinson D, Johnston DA, et al. (2003) The phylogeny of the Schistosomatidae based on three genes with emphasis on the interrelationships ofSchistosomaWeinland, 1858. Parasitology 126: 203– 224.
11. Morgan JAT, Dejong RJ, Adeoye GO, Ansa EDO, Barbosa CS, et al. (2005) Origin and diversification of the human parasiteSchistosoma mansoni. Mol Ecol 14: 3889–3902.
12. Morgan JAT, DeJong RJ, Kazibwe F, Mkoji GM, Loker ES (2003) A newly-identified lineage ofSchistosoma. Int J Parasitol 33: 977–985.
13. Snyder SD, Loker ES (2000) Evolutionary relationships among the schistoso-matidae (Platyhelminthes: Digenea) and an Asian origin for Schistosoma. J Parasitol 86: 283–288.
14. Besansky NJ, Severson DW, Ferdig MT (2003) DNA barcoding of parasites and invertebrate disease vectors: what you don’t know can hurt you. Trends Parasitol 19: 545–546.
15. Frezal L, Leblois R (2008) Four years of DNA barcoding: Current advances and prospects. Infect Genet Evol 8: 727–736.
16. Rollinson D, Webster JP, Webster B, Nyakaana S, Jorgensen A, et al. (2009) Genetic diversity of schistosomes and snails: implications for control. Parasitology 136: 1801–1811.
17. Standley CJ, Kabatereine NB, Lange CN, Lwambo NJS, Stothard JR (2010) Molecular epidemiology and phylogeography ofSchistosoma mansoniaround Lake Victoria. Parasitology 137: 1937–1949.
18. Stothard JR, Webster BL, Weber T, Nyakaana S, Webster JP, et al. (2009) Molecular epidemiology of Schistosoma mansoni in Uganda: DNA barcoding reveals substantial genetic diversity within Lake Albert and Lake Victoria populations. Parasitology 136: 1813–1824.
19. Webster BL, Emery AM, Webster JP, Gouvras A, Garba A, et al. (2012) Genetic diversity within Schistosoma haematobium: DNA barcoding reveals two distinct groups. PLoS Negl Trop Dis 6: e1882.
20. Webster BL, Webster JP, Gouvras AN, Garba A, Lamine MS, et al. (2012) DNA ‘barcoding’ ofSchistosoma mansoniacross sub-Saharan Africa supports substantial within locality diversity and geographical separation of genotypes. Acta Trop doi: 10.1016/j.actatropica.2012.08.009.
21. Agola LE, Mburu DN, DeJong RJ, Mungai BN, Muluvi GM, et al. (2006) Microsatellite typing reveals strong genetic structure ofSchistosoma mansonifrom localities in Kenya. Infect Genet Evol 6: 484–490.
infrapopulations in Mwea, central Kenya assessed by microsatellite markers. Acta Trop 111: 219–225.
23. Gower CM, Gouvras AN, Lamberton PH, Deol A, Shrivastava J, et al. (2013) Population genetic structure ofSchistosoma mansoniandSchistosoma haematobium from across six sub-Saharan African countries: Implications for epidemiology, evolution and control. Acta Trop 128(2):261–74.
24. Woolhouse MEJ, Mutapi F, Ndhlovu PD, Chandiwana SK, Hagan P (2000) Exposure, infection and immune responses toSchistosoma haematobiumin young children. Parasitology 120: 37–44.
25. Betson M, Figueiredo JCS, Rowell C, Kabatereine NB, Stothard JR (2010) Intestinal schistosomiasis in mothers and young children in Uganda: Investiga-tion of field-applicable markers of bowel morbidity. Am J Trop Med Hyg 83: 1048–1055.
26. WHO (2006) Preventive chemotherapy in human helminthiasis. Coordinated use of anthelminthic drugs in control interventions: a manual for health professionals and programme managers. Geneva: WHO.
27. Sousa-Figueiredo JC, Betson M, Kabatereine NB, Stothard JR (2013) The urine circulating cathodic antigen (CCA) dipstick: A valid substitute for microscopy for mapping and point-of-care diagnosis of intestinal schistosomiasis. PLoS Neglect Trop Dis 7: e2008.
28. Green HK, Sousa-Figueiredo JC, Basanez MG, Betson M, Kabatereine NB, et al. (2011) Anaemia in Ugandan preschool-aged children: the relative contribution of intestinal parasites and malaria. Parasitology 138: 1534–1545. 29. Vennervald BJ, Dunne DW (2004) Morbidity in schistosomiasis: an update. Curr
Opin Infect Dis 17: 439–447.
30. Webster BL (2009) Isolation and preservation of schistosome eggs and larvae in RNAlater(R) facilitates genetic profiling of individuals. Parasit Vectors 2: 50. 31. Levitz S, Standley CJ, Adriko M, Kabatereine NB, Stothard JR (2013)
Environmental epidemiology of intestinal schistosomiasis and genetic diversity of Schistosoma mansoniinfections in snails at Bugoigo villages, Lake Albert. Acta Trop 128(2):284–91.
32. Walker SM, Johnston C, Hoey EM, Fairweather I, Borgsteede F, et al. (2011) Population dynamics of the liver fluke,Fasciola hepatica: the effect of time and spatial separation on the genetic diversity of fluke populations in the Netherlands. Parasitology 138: 215–223.
33. Tamura K, Peterson D, Peterson N, Stecher G, Nei M, et al. (2011) MEGA5: Molecular Evolutionary Genetics Analysis using maximum likelihood, evolu-tionary distance, and maximum parsimony methods. Mol Biol Evol 28: 2731– 2739.
34. Librado P, Rozas J (2009) DnaSP v5: a software for comprehensive analysis of DNA polymorphism data. Bioinformatics 25: 1451–1452.
35. Lynch M, Crease TJ (1990) The analysis of population survey data on DNA-sequence variation. Mol Biol Evol 7: 377–394.
36. Nei M (1987) Molecular Evolutionary Genetics. New York: Columbia University Press.
37. French MD, Churcher TS, Basanez MG, Norton AJ, Lwambo NJ, et al. (2013) Reductions in genetic diversity of Schistosoma mansoni populations under chemotherapeutic pressure: The effect of sampling approach and parasite population definition. Acta Trop 128(2):196–205.
38. Conover WJ (1999) Practical Nonparametric Statistics. New York: Wiley. 39. Excoffier L, Lischer HE (2010) Arlequin suite ver 3.5: a new series of programs
to perform population genetics analyses under Linux and Windows. Molecular ecology resources 10: 564–567.
40. Tajima F, Nei M (1984) Estimation of evolutionary distance between nucleotide sequences. Mol Biol Evol 1: 269–285.
41. Standley CJ, Mugisha L, Adriko M, Arinaitwe M, Rukundo J, et al. (2013) Intestinal schistosomiasis in chimpanzees on Ngamba Island, Uganda: observations on liver fibrosis, schistosome genetic diversity and praziquantel treatment. Parasitology 140: 285–295.
42. Monrad J, Christensen NO, Nansen P, Johansen MV, Lindberg R (1995) Acquired-resistance againstSchistosoma bovis after single or repeated low-level primary infections in goats. Res Vet Sci 58: 42–45.
43. Theron A, Sire C, Rognon A, Prugnolle F, Durand P (2004) Molecular ecology ofSchistosoma mansonitransmission inferred from the genetic composition of larval and adult infrapopulations within intermediate and definitive hosts. Parasitology 129: 571–585.
44. Seto EY, Sousa-Figueiredo JC, Betson M, Byalero C, Kabatereine NB, et al. (2012) Patterns of intestinal schistosomiasis among mothers and young children from Lake Albert, Uganda: water contact and social networks inferred from wearable global positioning system dataloggers. Geospat Health 7: 1–13. 45. Stothard JR, Sousa-Figueiredo JC, Betson M, Adriko M, Arinaitwe M, et al.
(2011)Schistosoma mansoniinfections in young children: when are schistosome antigens in urine, eggs in stool and antibodies to eggs first detectable? PLoS Negl Trop Dis 5: e938.
46. Sousa-Figueiredo JC, Pleasant J, Day M, Betson M, Rollinson D, et al. (2010) Treatment of intestinal schistosomiasis in Ugandan preschool children: best diagnosis, treatment efficacy and side-effects, and an extended praziquantel dosing pole. Int Health 2: 103–113.
47. Lipsitch M, O’Hagan JJ (2007) Patterns of antigenic diversity and the mechanisms that maintain them. J R Soc Interface 4: 787–802.
48. Beltran S, Gourbal B, Boissier J, Duval D, Kieffer-Jaquinod S, et al. (2011) Vertebrate host protective immunity drives genetic diversity and antigenic polymorphism inSchistosoma mansoni. J Evolution Biol 24: 554–572.
49. Jorgensen A, Kristensen TK, Stothard JR (2004) An investigation of the ‘‘Ancyloplanorbidae’’ (Gastropoda, Pulmonata, Hygrophila): preliminary evi-dence from DNA sequence data. Mol Phylogenet Evol 32: 778–787. 50. Jorgensen A, Kristensen TK, Stothard JR (2007) Phylogeny and biogeography
of AfricanBiomphalaria(Gastropoda: Planorbidae), with emphasis on endemic species of the great East African lakes. Zool J Linn Soc 151: 337–349. 51. Kazibwe F, Makanga B, Rubaire-Akiiki C, Ouma J, Kariuki C, et al. (2006)
Ecology of Biomphalaria(Gastropoda: Planorbidae) in Lake Albert, Western Uganda: snail distributions, infection with schistosomes and temporal associa-tions with environmental dynamics. Hydrobiologia 568: 433–444.
52. Mandal-Barth (1954) Freshwater mollusks of Uganda and adjacent territories. Ann Muse´e R Congo 32: 7–203.
53. Balen J, Stothard JR, Kabatereine NB, Tukahebwa EM, Kazibwe F, et al. (2006) Morbidity due toSchistosoma mansoni: an epidemiological assessment of distended abdomen syndrome in Ugandan school children with observations before and 1-year after anthelminthic chemotherapy. Trans R Soc Trop Med Hyg 100: 1039–1048.
54. Sousa-Figueiredo JC, Betson M, Atuhaire A, Arinaitwe M, Navaratnam AM, et al. (2012) Performance and safety of praziquantel for treatment of intestinal schistosomiasis in infants and preschool children. PLoS Negl Trop Dis 6: e1864. 55. Norton AJ, Gower CM, Lamberton PHL, Webster BL, Lwambo NJS, et al. (2010) Genetic consequences of mass human chemotherapy for Schistosoma mansoni: Population structure pre- and post-praziquantel treatment in Tanzania. Am J Trop Med Hyg 83: 951–957.