ABSTRACT
JUNE, MICHAEL SEAN. Static Efficiency of Positive and Negative Pin-Ring Type Electrohydrodynamic Air Moving Devices. (Under the direction of Dr. Kevin Lyons.)
As far back as 1709, under certain conditions, air flow was observed in the presence of high voltage. This phenomenon is an example of electrohydrodynamic flow. The presence of high voltage, on the order of thousands to tens of thousands of volts, along with one electrode of high curvature (sharp) and another electrode without sharp edges, will support an ionization cascade given an initial, natural ionization event. , Under the right conditions, this will result in a sufficient number of ions to move a measurable amount of air due to momentum transfer between the ions and the neutral gas molecules. The current study investigated the efficiency and air flow enhancements of a small, simple ionic air moving device that consisted of needles and a 25 mm diameter cylinder. It was found that there was an optimal cylinder length, needle distance, polarity, and voltage for both air flow and efficiency, and it was shown that increasing the number of needles, and therefore ionization sites increased air flow and efficiency. Most
Static Efficiency of Positive and Negative Pin-Ring Type Electrohydrodynamic
Air Moving Devices
by
Michael Sean June
A dissertation submitted to the Graduate Faculty of North Carolina State University
in partial fulfillment of the requirements for the Degree of
Doctor of Philosophy
Mechanical Engineering
Raleigh, North Carolina 2010
APPROVED BY:
_______________________________ _______________________________
Dr. Kevin Lyons Dr. Tiegang Fang
Committee Chair
_______________________________ _______________________________
ii DEDICATION
For my wife, Tracy. For my son, Nicholas. For my son, Christopher. For my daughter, Megan.
BIOGRAPHY
iv ACKNOWLEDGEMENTS
I would like to thank Dr. Kevin Lyons for his support and guidance throughout this process. It simply would not have been possible to juggle work, family, and a higher education without such a patient and wise advisor.
Likewise, thanks to Drs Tiegang Fang, Alexi Saveliev and Thomas Ward for serving on my committee, and actively contributing to my success in this endeavor.
Thank you to James Kribs (NCSU) for his invaluable work, and thank you to Michael Purdy (IBM) for keeping me from experiencing 20,000 Volts first hand, and for his technical expertise.
TABLE OF CONTENTS
List of Tables ... vii
List of Figures ... viii
Chapter 1 Introduction ...1
1.1 Scope of Work ...1
1.2 Introduction to Ionic Flow Devices ...2
1.3 Other Applications ...3
1.4 Ionic Air Moving Devices ...5
Chapter 2 Background ...7
2.1 Mechanism of Flow ...7
2.2 Negative Corona ...14
2.3 Positive Corona ...19
2.4 Efficiency ...22
2.5 Air Flow bench ...37
Chapter 3 Experiments ...39
3.1 Overview ...39
Chapter 4 Excerpts from M.S. June, J. Kribs, K.M. Lyons, Efficiency of Electrostatic Air Moving Devices, J. Electrostat, 68 (2010) 419-423 ...43
4.1 Procedure ...43
4.2 Results ...48
4.3 Discussion ...56
4.4 Conclusions ...58
Chapter 5 Excerpts from M.S. June, J. Kribs, K.M. Lyons, Measuring Efficiency of Positive and Negative Ionic Wind Devices for Comparison to Fans and Blowers, Submitted for Review to Journal of Electrostatics 08/02/2010 ...60
5.1 Procedure ...60
vi
5.3 Discussion ...76
5.4 Conclusions ...77
Chapter 6 Excerpts from M.S. June, J. Kribs, K.M. Lyons, Integrated Ionic Flow Device and Heat Sink as a Fan Sink Alternative, Submitted for Review to Journal of Thermal Science and Engineering Applications 06/18/2010 ...79
6.1 Procedure ...79
6.2 Results ...82
6.3 Discussion ...86
6.4 Conclusions ...87
Chapter 7 Discussion and Future Work ...88
7.1 Overall Summary of Results ...88
7.2 Future Work ...91
7.3 Future Applications ...95
LIST OF TABLES
Table 6.1 Comparison of power consumed by each air moving device
viii LIST OF FIGURES
Figure 2.1 Schematic representation of wire and plate geometry for an ionic air moving device ……….. 8 Figure 2.2 schematic representation of needle and ring geometry for an
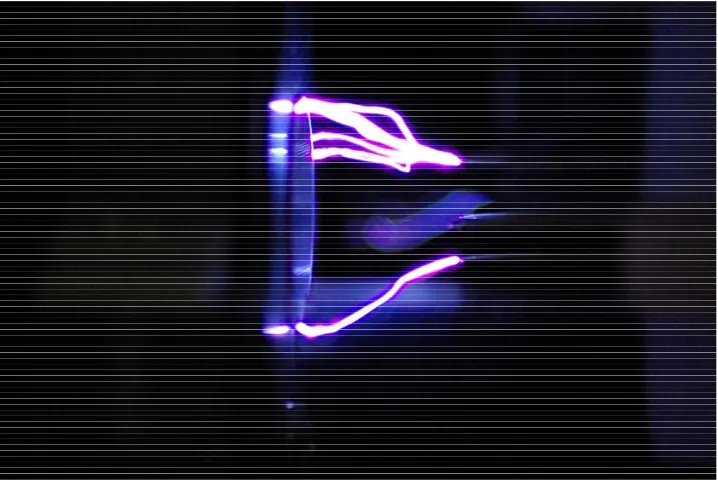
ionic air moving device ………. 9 Figure 2.3 photograph of the corona and secondary ionization on a needle and
ring ionic air moving device ………... 12 Figure 2.4 Photograph of arcing between needle and ring on an ionic air
moving device ………..………..………... 13 Figure 2.5 Beginning stages of the formation of a negative corona………..…. 16 Figure 2.6 Three regions of a negative corona. Ionization occurs in the
Ionizing Plasma region due to natural events, and due to
cascading mechanisms. In the Non-Ionizing Plasma region, electrons lack sufficient energy for further ionization. Mostly recombination occurs. Mass transfer resulting in bulk flow occurs mainly in the Unipolar region ………...……… 18 Figure 2.7 Two regions of a Positive corona. Ionization occurs in the Ionizing
Plasma region due to natural events, and due to cascading
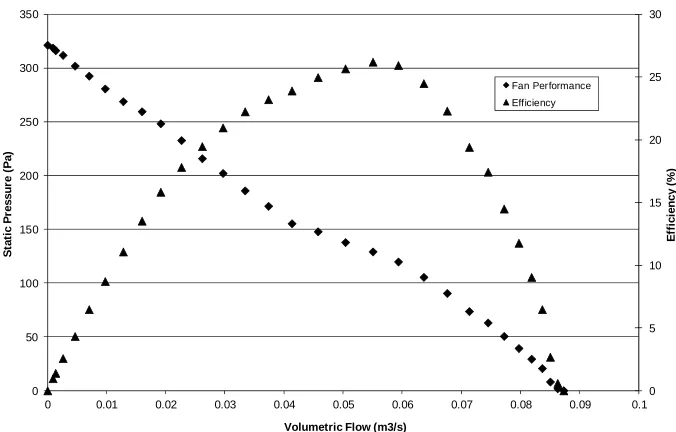
mechanisms. Mass transfer resulting in bulk flow occurs mainly in the Unipolar region…...………... 21 Figure 2.8 Typical fan performance and efficiency curves………...……….. 35 Figure 2.9 Schematic representation of typical air flow bench……...………… 38 Figure 4.1 Photograph of experimental apparatus showing the ring electrode
and 5 needle electrodes………....….. 44 Figure 4.2 Photograph of experimental apparatus with the needle electrodes
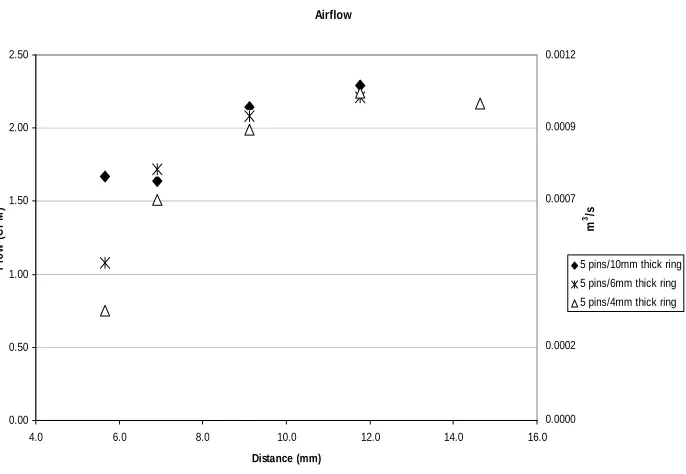
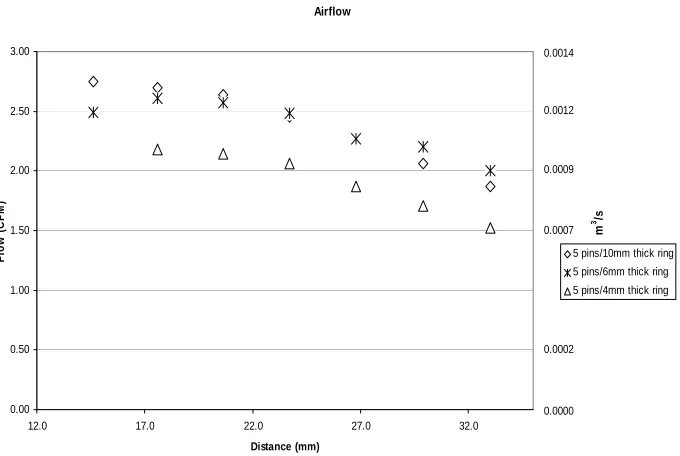
Figure 4.3 Air flow as a function of distance and ring thickness. Maximum Air flow was obtained by increasing voltage at each point until just before the onset of arcing or until the limit of the power supply (24800 V) was reached. Air flow trends toward a peak at around 12mm ..………...………..………. 48 Figure 4.4 Air flow as a function of distance and ring thickness at fixed voltage .
The limit of the power supply (24800 V) had been reached, so could not be increased as distance was increased. Air flow
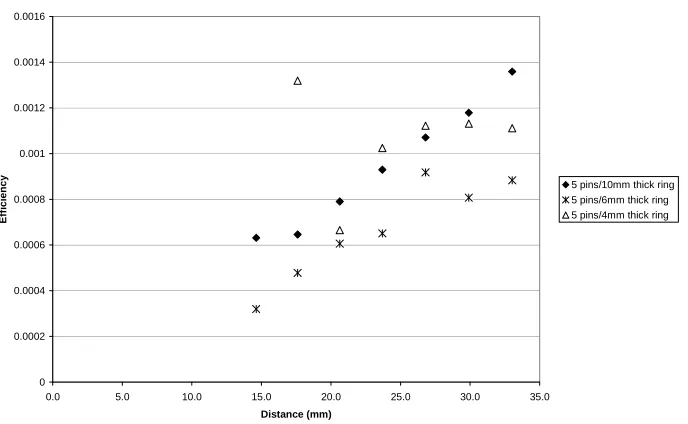
steadily decreases with distance ...………..…….…. 49 Figure 4.5 Efficiency as a function of distance and ring thickness at fixed
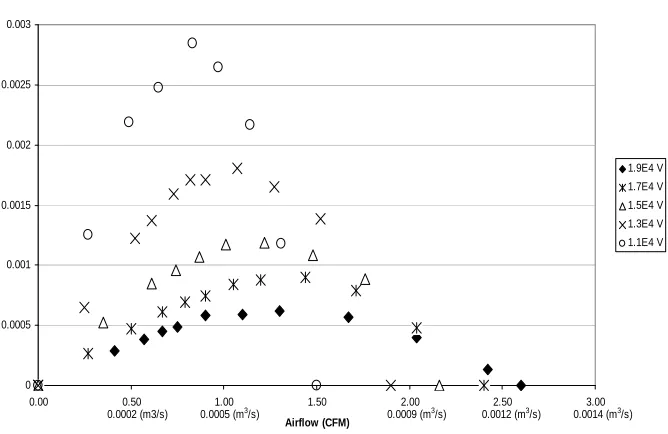
voltage . The limit of the power supply (24800 V) had been reached, so could not be increased as distance was increased. Efficiency steadily increases with distance ...………..……….. 50 Figure 4.6 Efficiency curves at various voltages and fixed needle distance
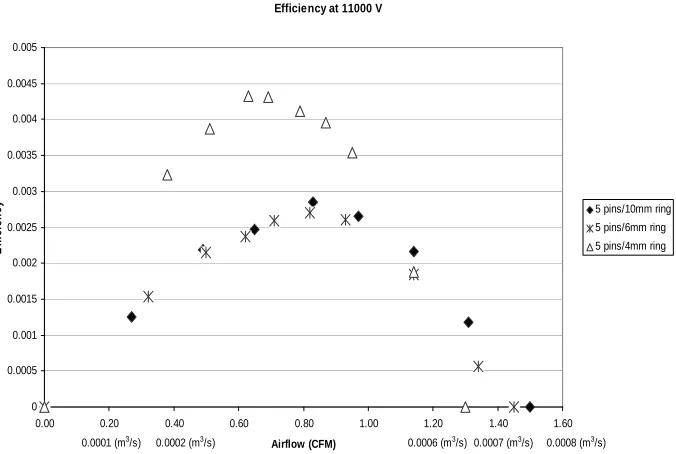
of 13.5mm. Efficiency decreased throughout the operating range of the air moving device as voltage was increased while maximum air flow increased ………...………..………. 51 Figure 4.7 Efficiency at various ring widths at constant voltage. Air flow
increased as ring size was increased, as long as the increase was larger than the uncertainty of the measurements .………..…….…. 52
Figure 4.8 Efficiency with 4 and 5 ionization sites (needles). As in Figure 10, Air flow increased as ionization sites were increased, but
efficiency decreased ………..………..……… 53
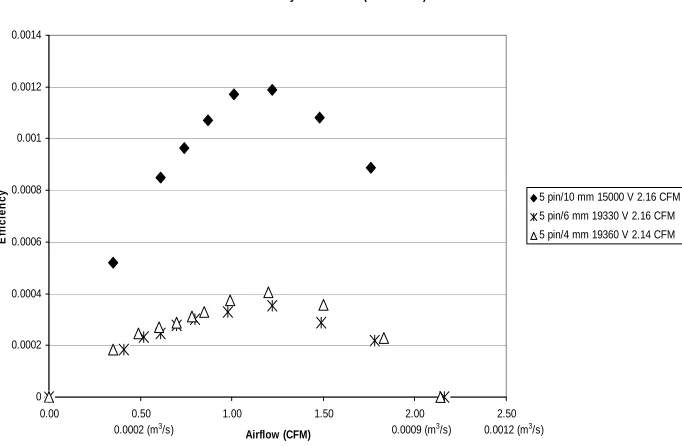
Figure 4.9 Efficiency of different ring widths at a fixed maximum air flow. Efficiency increased with ring thickness when air flow was held constant ………..………..……… 54
Figure 4.10 Efficiency of 4 and 5 ionization sites at a fixed maximum
x Figure 5.1 Photograph of experimental apparatus showing the ring electrode
and 5 needle electrodes ………...…..………… 61
Figure 5.2 Photograph of experimental apparatus with the needle electrodes rotated 90-degrees to show the arrangement of the needles……….. 62
Figure 5.3 Schematic representation of typical air flow bench ………. .65
Figure 5.4 Behavior of peak static efficiency as a function of air flow, and therefore voltage. For lower air flows, positive corona yielded much higher efficiencies than negative corona. The static efficiency dropped quickly with air flow, and curves for both polarities showed the same nature. Higher peak air flows were achieved with
negative coronas, as the positive coronas tended to arc at lower voltages ………... .68
Figure 5.5 Characteristic performance curve for a needle-ring ionic flow device, as well as characteristic static efficiency curve. Lines were added for clarity .………...… 69
Figure 5.6 Negative corona static efficiency as a function of distance from the needle to the upstream plane of the ring, for 6 different ring lengths. Static efficiency showed sensitivity to distance, and peaked
at approximately 20 mm. The most efficient ring length was 14 mm. Lines were added for clarity …..………...… 71 Figure 5.7 Positive corona static efficiency as a function of distance from the
needle to the upstream plane of the ring, for 4 different ring
lengths. Measurements of current were at or below the detection limit of the measurement methodology, and therefore values at the
Figure 5.8 Comparison of positive and negative corona static efficiency for a ring length of 6 mm. This was a lower efficiency ring length in the negative corona data, and therefore was low enough to be above the detection limit of the current measurement methodology. The trend for positive corona static efficiency to be much higher than the
negative case, as well as the peak for both around 20 mm distance can be seen. Lines were added for clarity……… 74
Figure 5.9 Static efficiency as a function of ring length. This shows the
sensitivity of static efficiency to ring length, where the peak occurred with the 14 mm long ring ………. 75
Figure 6.1 Sketch of the heat sink ducted to the axial fan, and the heat sink as part of a 5 needle ionic air moving device ………..…. 80 Figure 6.2 Static efficiency as a function of distance between the needle and the
1
Chapter 1
Introduction
1.1
Scope of Work
1.2
Introduction to Ionic Air Moving Devices
As early as 1709 it was observed by Francis Hauksbee that when he got near certain devices with high voltage present, air flow was felt. The commonly told story is that he felt the air flow on his face upon coming very close to the high voltage device. Sir Isaac Newton (1718), Michael Faraday (1839) and James Clerk Maxwell (1873) observed and reported on the same phenomenon, but the first major study is attributed to Chattock in 1899. Chattock correlated air flow pressure to electrical current flowing between electrodes of specific geometry. Steutzer (1959) analyzed ionic flows using both gas and liquid as a working fluid, and Robinson (1961, 1962) is known for his comprehensive survey of prior work, and the history of ionic flows in addition to his own work on the subject. Perhaps some of the most comprehensive modern work on this subject was completed by Lawton and Weinberg in their investigation of combustion phenomena. The physics of the phenomena and defining equations are well defined in their book,
Electrical Aspects of Combustion (1969).
3 neutral molecules, as they flow to the opposite electrode. Momentum transfer between the ions and the molecules results in a steady bulk air flow. A side effect of this process is ozone generation. There are also several other applications worth noting as follows.
1.3
Other Applications
Ionic devices have been successfully sold commercially as filtration devices. A common example is the Ionic Breeze tm, once sold by the Sharper Image. Various ionic air purifiers are still available, however their effectiveness in the home and the associated risks of ozone generation are subject to debate and in some cases litigation. Researchers however have found the technology to be effective in filtering soot from flames. Saxena
et al (1982) surveyed the state of the art in particulate removal from high pressure, high
temperature gasses using ionic filtration methods. Saito et al (1997, 1999) looked at soot emission from an acetylene diffusion flame in the presence of a high strength electric field. They reported on the effects on the flame shape as well. Sylvestre de Ferron et al
In addition to filtration of particulates in exhaust streams, researchers have been investigating how electric fields and ionic devices vary the combustion process in hopes of controlling combustion products. Thong and Weinberg (1971) looked at control of particulate suspensions, both liquid and solid, in the flame using electric fields. In addition to unwanted combustion products there are applications where the products of combustion are useful. Chakrabarty (2008) investigated separating combustion product particulates using electric fields, and similarly Zhao (2008) investigated particle agglomeration. The pharmaceutical industry is often mentioned as a potential user of this technology.
5
1.4
Ionic Air Moving Devices
7
Chapter 2
Background
2.1 Mechanism of the Flow
Figurre 2.1 Sc m
chematic rep oving device
presentation e.
Figurre 2.2 Sc m
chematic rep oving device
presentation e.
of needle and ring geeometry for an ionic a
In an electrostatic field, the body force on a unit volume of the bulk gas is equal to the forces on the ions or other charged particles dispersed in the gas. This is provided that the ions or charged particles have constant mobility and do not accelerate. The force is given by
)
(
Ee n n
F 2.1
where F is the body force on a unit volume of air, E is the electric field,eis the fundamental charge, and n is the number density. Given the high electrical potential used to generate the ions and motivate the flow, it can be assumed that the clouds of ions are unipolar as long as secondary ionization is not occurring. Thus, the local current density,
Ee n K n K j j
j ( ) , 2.2
becomes
e E n K
j( ) 2.3
and
) ( Ee n
11 Combining, yields
F j/K 2.5
This equation describes the body force on a unit volume of air in terms of the local current density and the charge carrier mobility K.
Ion Producing Corona at Tip of Needles
Secondary Ionization Around Collector Ring
13 Figure 2.4 Photograph of arcing between needle and ring on an ionic air moving
2.2
Negative Corona
If the emitter electrode is on the negative side of the power supply, a “negative corona” will be generated given a high enough electric field. The mechanism and characteristics of the negative corona are significantly different than the “positive” corona which is generated when the emitter is on the positive side.
15 This is called the “Onset Voltage” or the “Corona Inception Voltage” and is given by
1 .0301/ ln / . 2.6
Figurre 2.6 Th Pl th fu bu hree regions lasma region e Non-Ioniz urther ionizat
ulk flow occu
s of a nega n due to natu zing Plasma tion. Mostly urs mainly in
ative corona ural events, a
a region, e recombinat n the Unipol
a. Ionization and due to c electrons lac
tion occurs. M lar region.
n occurs in cascading me ck sufficien
Mass transfe
the Ionizin echanisms. I nt energy fo er resulting i
19 Because electrons travel slower the further they get from the emitter, they tend to build up near the negative emitter. This locally reduces the electric field gradient and temporarily stops the ionization process. As the electrons drift away from the emitter, the local charge from the electrons dissipates, and the high electrical gradient is reestablished, thus starting the ionization process again. A characteristic of the negative corona, therefore is that it is pulsatile. This leads to emitted energy and electrical interference. While negative coronas are reported to have higher air flow than positive coronas (Chen and Davidson, 2003), these aforementioned characteristics along with increased ozone generation make the negative corona less suited for consumer applications.
2.3 Positive Corona
Figurre 2.7 Tw re tra
wo regions o gion due to ansfer resulti
of a Positive o natural ev
ing in bulk f
corona. Ion vents, and d
flow occurs m
nization occu due to casca mainly in th
urs in the Ion ading mecha he Unipolar r
2 nizing Plasm anisms. Mas region.
21 ma
2.4 Efficiency
The efficiency of ionic air moving devices (AMDs) is discussed in several papers (Rickard, 2006, Moreau, 2008, Kim, 2010, Bondar, 1986, Goldman, 1985), however these calculations of efficiency and methodology of determining efficiency vary from what is used by the computer industry. That industry as well as companies that supply rotary AMDs to it, follow a method outlined by the ASME in ASME PTC 11-2008 (2008). A similar method is outlined by ASHRAE and ANSI as ANSI/ASHRAE 51-1999 (1999). The approach followed by academic literature regarding ionic AMDs results in lower reported efficiency for the ionic devices than would be reported if the industry preferred method was used. One goal of this paper is to explain the differences, and applicability of these methods and to evaluate the efficiency of ionic AMDs using the ASME/ANSI/ASHRAE methodology.
There is agreement that efficiency is defined as power supplied by the AMD divided by the electrical power supplied to the AMD
in out
P P
, or
electrical mech
P P
23 but the discrepancy is in how the power supplied by the AMD is defined. Moreau (2006) provided a detailed derivation typical of the academic literature, starting from
conservation of kinetic energy inside a control volume, and obtained
dy y y U P D D mech
/2
2 / 3 ) ( 2 1 (2.8)
where is the density of the ambient air, and U3 is the cubed velocity profile of the air. A circular collector was assumed, so this was essentially a cubed linear velocity, multiplied by area and again multiplied by density. Much of the literature follows a similar approach. Moreau’s derivation began with the further assumption that linear velocity would be measured at various points to obtain a flow profile. This was integrated as a function to obtain the flow rate.
dS U y ydyd
y U Q
S S
( , ) ( , ) (2.9)
Assuming axial symmetry, Q becomes
2
0 2 / 0 2 / 0 2 / 2 / ) ( ) ( 2 ) (
D D D
D dy y y U dy y U dy y U d
Q (2.10)
Starting from Conservation of kinetic energy inside a control volume, Moreau generally defines mechanical power.
Tv v g P v v dt d 2 2 1 (2.11)
The time rate of change of kinetic energy per unit volume is on the left and the terms on the right, from left to right are as follows: rate of work done by pressure forces per unit volume per unit time, rate of work performed by body forces per unit volume per unit time, and rate of work done by viscous forces per unit volume per unit time.
Because the following is true,
v v v t v dt
d 2 2 2
2 1 2
1 2
1
(2.12)
Moreau integrated over a volume assuming the stationary case,
25 and applied the Green-Ostrogradsky theorem to obtain
dA n v v dV v v V S
2
22 1 2
1
(2.14) and finally,
V S TdV dA n v v2 2 1 (2.15) (Moreau 2006)For the case of an ionic air moving device with a circular cross section, this becomes equation 2.8.
mech
P D U y ydy
D
2 / 2 / 3 ) ( 2 1 (2.8)Moreau (2007) states also that mechanical power of an air flow in a duct is given by
3
2 1
V
It is easy to see the similarity between equations 2.8 and 2.16. The difference is due to the integration of the velocity profile over the area.
Kim et al (2010) similarly defined mechanical power as
2
2 1
U m
Pmech (2.17)
Jewell-Larsen (2006) used a “pump efficiency” metric which was volumetric air flow divided by electrical power with the resulting units [cm3/sW].
These approaches, however mathematically defensible, do not account for how efficiency changes when the air moving device is under load. In other words, the approach taken by the literature is only valid for an air moving device in open air, but not one that is working against the flow impedance provided by a heat sink , for example. In these cases efficiency is often plotted against flow rate or voltage as the independent variable. In the next example and in the methodology followed in this work, static pressure is varied while the electrical input to the device is held nearly constant.
27 and the fan vendors which supply that industry. One of these methods has been used by the authors in previous research (June et al, 2010) and is the method followed in the current work. Derivations of these methods are shown in a paper by Kroll (1982). The first method considered is to multiply the volumetric flow rate by a quantity known as the fan specific energy which is energy per unit mass, given by
2 1 2 1 1 2 2 2 2 2 2 1 2
2g A A
m P P y c F m s s f (2.18)
where Ps2is the static pressure down stream from the fan, Ps1is the static pressure up stream from the fan, m is the mean density of the working fluid, m is the mass flow rate of the working fluid, gc is acceleration due to gravity, 1 and 2 are kinetic energy conversion factors up stream and down stream, 1and 2are up stream and down stream
local densities, and A is the cross sectional area of the duct up stream and down stream.
The other method, used most often by the computer industry, and by the authors in this study, takes the volumetric flow rate and multiplies it by static pressure or alternatively by total pressure. Total Efficiency which is defined as
where Q is the volumetric flow rate in m3/s and Pt Total Pressure. V is the voltage supplied to the air moving device, and I is the current drawn by the device. From this, Static Efficiency is defined as
t s t s
P
P
(2.20)which reduces to
VI QPs
s
(2.21)
Kroll’s derivation starts with the General Energy Equation from the First Law of Thermodynamics 1 1 2 2 1 1 1 1 2 2 2
2 k p ek ep
P u m e e P u m Q
(2.22)
where is the fan input power, Qis the heat loss from the fan, m2is the mass flow rate,
29 Ignoring changes in potential energy and heat loss (customary in fan engineering per Kroll), equation 2.22 becomes,
1 1 1 1 2 2 1 22 v ek ep
P P T T C m
(2.23)
Kroll then invokes the Mechanical Energy, or “Generalized Bernoulli” Equation from Newton’s second law of mechanics ,
1 2 1 2 )( k k p p
F V p dV m e e e e (2.24)
where Fis the friction power and V is volume.
By considering flows along streamlines through the fan, and ignoring changes in potential energy, equation 2.24 is reduced to,
1 2 2 1 k kF e e
dp m
If the process is considered to be incompressible, then equation 2.25 can be subtracted from equation 2.22 resulting in,
) (T2 T1 C
Q v
F
(2.26)
For incompressible flows,
m
Q
(2.27)
Therefore, equation 2.25 becomes,
2 k2 1 k1
F Q p e p e
(2.28)
or
f2 f1
F Q p p
(2.29)
31 To get to the form of the equation used most commonly by the computer industry and its fan vendors, one must consider that the previous equations are the basis for the definitions of flow rate, ideal energy rise, and fan output power. These are the performance variables that need to defined in order to determine a useful metric for fan efficiency, and thus for the efficiency of the ionic devices under consideration.
In what Kroll defines as the “Volume Flow Rate – Pressure Approach to Defining Fan Performance Variables,” volume flow rate, and fan total pressure are chosen as primary performance variables. This is considering fan total pressure to be a type of energy per unit volume.
The fan total Pressure is,
) (
) (
1
2 1 1
2
2 k k
ft p e p e
p (2.30)
Density may change between the inlet and the outlet of the fan, so density, in this method, is taken at the inlet, so the volumetric flow rate is considered to be,
1 f f
m Q
For incompressible flow, fan power simply becomes,
f ft
O p Q
(2.32)
which is the fan total pressure and the volumetric flow rate.
If the flow is compressible, a compressibility coefficient, Kpis factored in,
ft f p k
k
O e e K Q p
dp
m
1 2 2 1 (2.33)
Kroll references ASHRAE 51-75 (1975) for further explanation and development of Kp, however due to the low speeds involved in the current work, compressibility was not considered. It is presented here for completeness.
Kroll defines “fan total efficiency” as
O p f ft
t
p Q K
33 Static pressure, which is considered in the current work, is further defined as,
)
( 1 1
2 k
fs P p e
P (2.35)
which is the difference between outlet static pressure and inlet total pressure. Static pressure in general is a property “obtained in an isentropic-workless deceleration from the actual fluid state to a state with zero velocity” (Kroll, 1982). Simply stated, while dynamic pressure is measured with a tube aligned with the air flow, and is the pressure due to the flow itself, static pressure is measured with a tube perpendicular to the flow. This is typically measured as gage pressure and is only non-zero when the flow is restricted, and thus pushing against said restriction. Static efficiency is then defined as,
ft fs t s
p p
(2.36)
This is equivalent to,
VI p Q p
Qf fs f fs
s
This is the preferred metric since static pressure and volumetric flow rate are the independent and dependent variables respectively, of a fan performance curve. The data for both the fan performance curve and the static efficiency curve are collected concurrently.
35 0 5 10 15 20 25 30 0 50 100 150 200 250 300 350
0 0.01 0.02 0.03 0.04 0.05 0.06 0.07 0.08 0.09 0.1
Ef fi ci en c y ( % ) St at ic Pr e ssu re ( P a )
Volumetric Flow (m3/s)
120 mm x 38 mm Axial Fan
Fan Performance Efficiency
If it is necessary to determine the efficiency at various fan speeds, or in the case of ionic AMDs, supplied voltages, then it is necessary to generate these fan curves and efficiency curves at various voltages Then from each curve either the peak efficiency would be taken and plotted against voltage, or the efficiency at some intended operating point may be of more interest and this plotted against voltage.
37
2.5 Air Flow Bench
39
Chapter 3
Experiments
3.1 Overview
surface finish such that it wasn’t a variable in the experiments, but such that it was an achievable, cost effective surface finish in terms of quality and variability. Given that the ultimate goal was to evaluate the feasibility of using ionic air moving devices to cool electronic equipment in place of conventional fans, they needed to be representative of what would be achievable at a comparative cost to the fans. This meant highly polished surfaces on the emitter needed to be avoided. Plating was acceptable on the needles since they are a high volume, common item, however in reality a purpose built emitter array for a production ionic air moving device would likely not have plated emitter needles.
Experiments were performed in a climate controlled laboratory, with little variation in ambient temperature and humidity within each dataset. Humidity has been identified in the literature to have an observable effect on air flow. It was not observed to have an effect within the variation in the laboratory where the experiments were performed.
41 The papers cover the following experiments and results.
1) The effect on air flow and efficiency of varying the distance between the needle emitters and the cylindrical collector. This was performed with various collector lengths.
2) The effect on efficiency of varying voltage for a fixed ring length and needle distance. The ring length and needle distance chosen were the most efficient as observed in previous experiments.
3) The effect on air flow and efficiency as the number of emitter needles was varied.
4) The effect on air flow and efficiency as the ring thickness was varied as maximum air flow was held constant.
5) The effect on air flow and efficiency as the number of emitter needles was varied as maximum air flow was held constant.
7) The effect on efficiency as collector length was varied for both positive and negative ionic flow.
43
Chapter 4
Excerpts from:
M.S. June, J. Kribs, K.M. Lyons, Efficiency of Electrostatic Air Moving Devices, J. Electrostat, 68 (2010) 419-423
4.1Procedure
Figurre 4.1 Ph ne
hotograph of eedle electro
f experimen des.
Figurre 4.2 Ph 90
hotograph of 0-degrees to
f experimen show the arr
ntal apparatu rangement o
us with the n of the needle
needle elect es.
4 trodes rotate
A 20kV Acopian DC power supply was used to supply a potential between the needle and the aluminum ring. A negative potential was applied to the needle, and the aluminum ring was grounded.
Air flow and back pressure were measured with a flow bench using a Meriam model 50MC2-2F linear flow element and a Meriam model LFS-1180E-99SP-5-31-1-99 to read air flow, and ambient conditions. Static pressure was measured with an MKS model 698A11TRD differential manometer.
Voltage was measured using a Hewlett Packard HP3466A DMM attached to the voltage sense terminals of the Acopian power supply. Current was measured also using a Hewlett Packard HP3466A DMM attached to the current sense terminals on the Acopian power supply. The offset for voltage readings was 1 V indicated for 10,000 V output. For the current measurement, 1 V indicated 1 mA output.
47 pressure on the device. At each increment, the difference between the pressure behind the ionic device and atmospheric pressure was determined along with volumetric air flow. Also, at each point, voltage and current to the ionic air moving device were measured. These data were used to generate P-Q curves, as well as to generate efficiency curves.
P-Q and efficiency curves were generated at various incremental distances between the pins and the ring. This was done with a 10mm thick ring, a 6 mm thick ring, and a 4mm thick ring. At each distance, the voltage was increased incrementally, and air flow measured at each increment until either sparking occurred or the voltage limit of the power supply was reached. If sparking occurred, the voltage was reduced to the point of maximum air flow but below the voltage where sparking occurred. Finally, distance was fixed and air flow was set at 2.16 CFM. Ring width and number of ionization sites were varied while keeping the maximum air flow constant. Efficiency was then calculated at each point on the P-Q curve. Static efficiency ( was calculated as,
=P*Q/V*I (4.1)
4.2 Results
As distance from the pins to the ring was increased, the voltage at which sparking occurred increased until the limit of the power supply (24800 V) was reached. Figure 4.3 shows the maximum observed air flow at each distance from the needles to the closest point on the ring. Each needle was equidistant from the ring. Even though voltage was increased at each increment in distance, the rate of change of air flow decreases, reaching a peak value.
Airflow 0.00 0.50 1.00 1.50 2.00 2.50
4.0 6.0 8.0 10.0 12.0 14.0 16.0
Distance (mm) Fl ow ( C FM )
5 pins/10mm thick ring 5 pins/6mm thick ring 5 pins/4mm thick ring 0.0012 0.0009 0.0007 0.0002 0.0000 m 3/s
49 Figure 4.4 shows results for air flow in the case where distance was increased while voltage was maintained at the upper limit of the power supply (24800V). Air flow decreased with distance in this regime, but efficiency increased as shown in Figure 4.5.
Airflow 0.00 0.50 1.00 1.50 2.00 2.50 3.00
12.0 17.0 22.0 27.0 32.0
Distance (mm) Fl ow ( C F M )
5 pins/10mm thick ring 5 pins/6mm thick ring 5 pins/4mm thick ring 0.0014
0.0012
0.0009
0.0007 3m
/s
0.0000 0.0002
Efficiency
0 0.0002 0.0004 0.0006 0.0008 0.001 0.0012 0.0014 0.0016
0.0 5.0 10.0 15.0 20.0 25.0 30.0 35.0
Distance (mm)
E
ffi
ci
en
cy 5 pins/10mm thick ring
5 pins/6mm thick ring 5 pins/4mm thick ring
51 Figure 4.6 shows a set of efficiency curves over the operating range of the device at various voltages. It shows that at a given distance, as voltage increased air flow also increased, but efficiency decreased.
Efficiency, 5 pins/10mm Thick Ring at 13.5mm distance
0 0.0005 0.001 0.0015 0.002 0.0025 0.003
0.00 0.50 1.00 1.50 2.00 2.50 3.00
Airflow (CFM) E ff ici en cy 1.9E4 V 1.7E4 V 1.5E4 V 1.3E4 V 1.1E4 V
0.0014 (m3/s)
0.0012 (m3/s)
0.0009 (m3/s)
0.0005 (m3/s)
0.0002 (m3/s)
In Figure 4.7, voltage is fixed for the set of curves, but the width of the ring was varied. In this case, there was no clear difference between the 10 mm and 6 mm ring, but the 4 mm ring showed lower flow and higher efficiency. Figure 4.8 is similar, but the number of ionization sites was varied rather than the ring width. Figure 4.8 shows that an increase in ionization sites allows higher voltage and air flow, but at lower efficiency.
Efficiency at 11000 V
0 0.0005 0.001 0.0015 0.002 0.0025 0.003 0.0035 0.004 0.0045 0.005
0.00 0.20 0.40 0.60 0.80 1.00 1.20 1.40 1.60 Airflow (CFM) E ff ici en c
y 5 pins/10mm ring
5 pins/6mm ring 5 pins/4mm ring
0.0008 (m3/s)
0.0007 (m3/s)
0.0006 (m3/s)
0.0001 (m3/s) 0.0002 (m3/s)
53
Efficiency at 11000 V
0 0.001 0.002 0.003 0.004 0.005 0.006 0.007 0.008 0.009
0.00 0.20 0.40 0.60 0.80 1.00 1.20 1.40 1.60 Airflow (CFM)
E
ff
ici
en
cy 4 pin/10mm ring
5 pin/10mm ring 3 pin/10mm ring
0.0008 (m3/s)
0.0007 (m3/s)
0.0006 (m3/s)
0.0002 (m3/s)
0.0001 (m3/s)
Figure 4.9 shows that when maximum air flow was held constant, and the ring width was varied, efficiency was higher for the 10mm ring, but no clear trend was seen between the 4 mm and 6 mm rings. Figure 4.10 shows that when air flow was held constant similar to Figure 4.10, but the number of ionization sites was varied, efficiency increased with the number of ionization sites.
Efficiency at 2.16 CFM (0.001 m3/s)
0 0.0002 0.0004 0.0006 0.0008 0.001 0.0012 0.0014
0.00 0.50 1.00 1.50 2.00 2.50
Airflow (CFM)
E
ff
ici
en
cy 5 pin/10 mm 15000 V 2.16 CFM
5 pin/6 mm 19330 V 2.16 CFM 5 pin/4 mm 19360 V 2.14 CFM
0.0012 (m3/s)
0.0009 (m3/s)
0.0002 (m3/s)
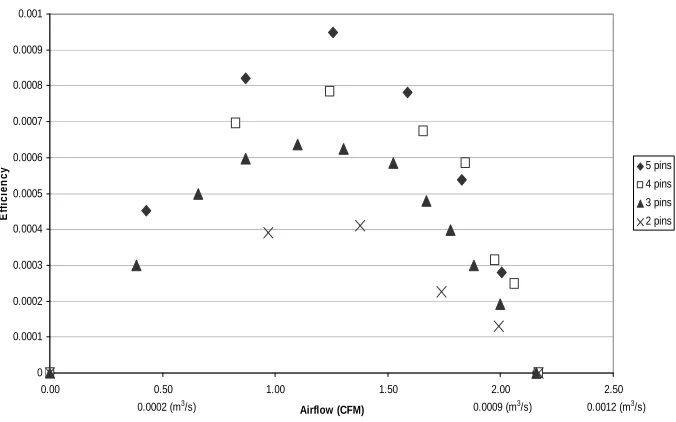
55
Efficiency at 2.16 CFM (0.001 m3/s)
0 0.0001 0.0002 0.0003 0.0004 0.0005 0.0006 0.0007 0.0008 0.0009 0.001
0.00 0.50 1.00 1.50 2.00 2.50
Airflow (CFM)
E
ff
ici
en
cy 5 pins
4 pins 3 pins 2 pins
0.0002 (m3/s) 0.0009 (m3/s) 0.0012 (m3/s)
4.3 Discussion
The P-Q curve is a common tool for determining the performance of an air moving device. At the origin, flow is zero and pressure is at its maximum. At this point, efficiency is necessarily zero. Also, at the point of maximum flow, pressure is zero, and therefore efficiency is zero as well. Efficiency peaked near the midpoint of the PQ curve for the air moving devices in this study. For Figures 4.3, 4.4, and 4.5, P-Q and efficiency curves were generated at each distance, then maximum efficiency or maximum flow was determined. Figures 4.6-4.10 show the entire efficiency curve.
57 frequently and at lower voltage since it tended to cause marks on the surface of the ring where the spark hit. These marks then were observed to be the origin of subsequent sparks, even after the ring was rotated relative to the needles. In subsequent experiments, the rings were removed, cleaned, and polished to their original surface finish to reduce this effect.
When voltage and distance were increased such that the maximum air flow was obtained prior to the onset of sparking, flow peaked at a value around 12 mm. In the fixed voltage regime in this study, efficiency was seen to increase with distance past 20 mm, while air flow steadily decreased. This suggests that there is an inverse relationship between air flow and efficiency past a certain distance. This experiment should be repeated at constant voltage at lesser distances, as well as greater distances since efficiency cannot be expected to increase without bound.
When the number of ionization sites was varied, more sites allowed for higher voltage and therefore higher flow. However if the maximum air flow was held constant, more ionization sites resulted in higher efficiency. The apparatus only allowed for up to 5 pins, however 5 pins does not appear to be a limiting number. The increase in efficiency between 2, 3, 4, and 5 pins suggests that the efficiency would still increase with 6 pins. Since efficiency cannot increase unbounded with the number of pins, it is assumed that there would be some number of pins where the efficiency no longer increased. Further work needs to be done with a modified apparatus and more pins.
4.4 Conclusions
The results of this study show how variation in collector width, and in the number of ionization sites influences the efficiency and air flow. Also, the data suggest that efficiency is sensitive to voltage.
1) When voltage was increased to a maximum with each increase in distance, air flow reached an optimal value.
59 3) When voltage was increased to a maximum with each increase in ring thickness,
Chapter 5
Excerpts from:
M.S. June, J. Kribs, K.M. Lyons, Measuring Efficiency of Positive and Negative Ionic Wind Devices for Comparison to Fans and Blowers, Submitted for Review to Journal of Electrostatics 08/02/2010
5.1 Procedure
Figurre 5.1 Ph ne
hotograph of eedle electro
f experimen des.
ntal apparatuus showing the ring ele
6 ectrode and
Figurre 5.2 Ph 90
hotograph of 0-degrees to
f experimen show the arr
ntal apparatu rangement o
us with the n of the needle
needle elect es.
63 A 20kV Acopian DC power supply was used to supply a potential between the needle and the ring. A negative potential was applied to the needles, and the aluminum ring was grounded. For positive ionic flow, the negative potential was applied to the ring, and the needles were grounded.
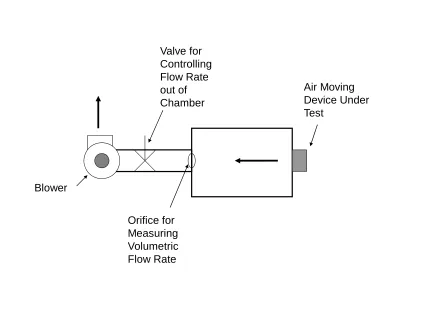
65 Air Moving
Device Under Test
Orifice for Measuring Volumetric Flow Rate
Valve for Controlling Flow Rate out of Chamber
Blower
Performance and efficiency curves were generated at various incremental distances between the pins and the ring. This was done with 6, 8, 10, and 14 mm long cylinders for positive ionic flow, and with 6, 8, 10, 14, 20 and 26 mm long cylinders for negative ionic flow. Dunn-Rankin et al reported that the optimal flow was achieved at a needle to cylinder distance of r, where r is the needle to cylinder distance. Distances were chosen around this value. Cylinder lengths were also chosen around an optimal value given by Dunn-Rankin for air flow velocity of 2r. Initial work showed that the highest efficiency was achieved at lower voltages, so at each distance, the voltage was adjusted until the stagnation pressure of the device was 1.5 PA (0.006 in-H20). This was to ensure that the static pressure measurement stayed above a reasonable lower detection limit for that instrument.
5.2 Results
Figure 5.4 Behavior of peak static efficiency as a function of air flow, and therefore voltage. For lower air flows, positive corona yielded much higher efficiencies than negative corona. The static efficiency dropped quickly with air flow, and curves for both polarities showed the same nature. Higher peak air flows were achieved with negative coronas, as the positive coronas tended to arc at lower voltages.
0.0 1.0 2.0 3.0 4.0 5.0 6.0
0 200 400 600 800 1000 1200
St
a
tic
Ef
fi
c
ie
n
c
y
(
%
)
Maximum Airflow (cm3/s)
Positive and Negative Corona, 6mm Ring, 13.5mm Distance
69
Typical Pressure, Airflow, and Efficiency Behavior of a Needle and Ring Ionic Flow Device
0 0.2 0.4 0.6 0.8 1 1.2 1.4 1.6
0 100 200 300 400 500 600
Air Flow (cm3/s)
Pr ess u re (Pa ) 0 2 4 6 8 10 12 14 16 18 Stati c Eff ici en cy (% ) P-Q Efficiency
71
Negative Corona Efficiency
0.00 2.00 4.00 6.00 8.00 10.00 12.00 14.00 16.00 18.00
0.0 5.0 10.0 15.0 20.0 25.0 30.0 35.0 40.0 45.0 50.0
Needle Distance From Ring (mm)
Sta ti c Effi ci en cy (% )
6 mm Ring 8 mm Ring 10 mm Ring 14 mm Ring 20 mm Ring 26 mm Ring
Positive Corona Efficiency 0.00 2.00 4.00 6.00 8.00 10.00 12.00 14.00 16.00
0.0 5.0 10.0 15.0 20.0 25.0 30.0 35.0 40.0 45.0 50.0
Needle Distance From Ring (mm)
S tat ic E ff icie n cy ( % )
6 mm Ring 8 mm Ring 10 mm Ring 14 mm Ring
Positive and Negative Corona Efficiency, 6 mm Ring
0.00 2.00 4.00 6.00 8.00 10.00 12.00 14.00 16.00
0.0 5.0 10.0 15.0 20.0 25.0 30.0 35.0 40.0 45.0 50.0
Needle Distance from Ring
Sta
tic Efficiency
(%
)
Negative Corona Positive Corona
75
Effect of Ring Length on Static Efficiency
0 2 4 6 8 10 12 14 16 18
0 5 10 15 20 25 30
Collector Ring Length (mm)
S
tat
ic Ef
fi
cien
cy (
%
)
5.3 Discussion
77 possible that the highest efficiency would have been observed between 14 mm and 20 mm. Cylinder lengths of 15 mm through 20 mm in 1 mm increments need to be tested to determine a good correlation for efficiency. Finally, the positive corona was much more efficient at producing flow, than the negative corona. This was as expected since the negative corona is pulsitile while the positive corona is steady (Trichel, 1938). The negative produces the maximum number of ions periodically for an apparently steady current and voltage , while the positive corona steadily produces its maximum number of ions. The positive corona was so efficient that the current fell below the detection limit of the instrumentation. This resulted in the aforementioned clipped peaks in the efficiency graphs (Figure 5.7). Measuring current in the pico-amp range is know to be problematic, and will be addressed in subsequent studies.
5.4 Conclusions
The results of this study show the sensitivity of static efficiency of ionic air moving devices to emitter distance, length of the collector, and to polarity of the electrodes.
1) Static efficiency peaked when the distance from the emitter to the collector was
r
5 .
2) Static efficiency peaked when collector length was 14 mm. This does not coincide with the length that provides maximum air flow (reported by Rickard, Dunn-Rankin, Weinberg (2006) as 2*r).
79
Chapter 6
Excerpts from:
M.S. June, J. Kribs, K.M. Lyons, Integrated Ionic Flow Device and Heat Sink as a Fan Sink Alternative, Submitted for Review to Journal of Thermal Science and Engineering 6/18/2010
6.1 Procedure
Figurre 6.1 Sk a 5
ketch of the 5 needle ion
heat sink du ic air movin
ucted to the a ng device.
81 A 20kV Acopian DC power supply was used to supply a potential between the needle and the heat sink for the ionic device. For negative ionic flow, negative potential was applied to the needles, and the aluminum heat sink was grounded. For positive ionic flow, the negative potential was applied to the heat sink, and the needles were grounded.
Air flow was measured using a flow bench consisting of an air flow source and a chamber. Air flow through the chamber was balanced with air flow from the ionic air moving device by closing a valve between the air flow source and the chamber. When static pressure in the chamber was zero, the air flow into the chamber from the ionic device was the same as the air flow out of the chamber from the air flow source. Static pressure was measured with a Setra 339-1 digital manometer. Volumetric air flow was measured with a Miriam 50MW20-1F linear flow element and a Datametrics 1018 differential manometer.
Since efficiency is a function of distance between the emitter and the collector, this distance was varied from 11 mm to 35 mm and static efficiency was determined at seven increments to determine the optimal distance.
Heat was applied to the heat sink using a 19 mm diameter circular heater with thermal grease between the heater and the heat sink. The heat sink base temperature was measured with a thermocouple when evaluating the fan.
The fan was fully ducted to the heat sink when placed on the flow bench. The fan was powered up along with the heater, and the temperature of the heat sink base in the middle of the heater was measured with the thermocouple. The air flow through the heat sink was measured using the flow bench, and the power used by the fan was noted. The fan was then removed, and the 5 needle ionic device was assembled, and powered to the same air flow as the fan. Power used by the ionic air flow device was measured by noting the voltage and current drawn by the device.
6.2 Results
83 consuming 0.4W of electrical power. The air flow through the heat sink was 462 cm3/s (0.98 SCFM). The heater supplied 17W of power.
0.00 0.10 0.20 0.30 0.40 0.50 0.60 0.70 0.80
0.0 5.0 10.0 15.0 20.0 25.0 30.0 35.0 40.0
S
ta
ti
c
E
ffi
c
ien
cy
(%
)
Distance (mm)
Negative Ionic Integrated Heat Sink
the h was t
Table
The 5 nee heat sink. Su
tested at 462
e 6.1 Co air
edle positive ubsequently 2 cm3/s, cons
omparison o r flow.
e ionic devic the device w suming 0.17W
of power con
ce consumed was reconfig
W.
nsumed by e
d only 0.19 gured as a n
each air mov
W at 462 c negative ioni
ving device
8 cm3/s throug ic device an
at 462 cm3/
85 gh nd
6.3 Discussion
87
6.4 Conclusions
The results of this study show the ionic air moving device used less power than a comparable axial fan to cool a low power electronic component.
1) At 462 cm3/s (0.98 SCFM), the negative ionic AMD required 0.17W while the axial fan required 0.40W
2) The negative ionic device consumed slightly less power than the negative device (0.17 W vs 0.19 W) at equivalent air flow, but both consumed less than half the power as the fan.
Chapter 7
Discussion and Future Work
7.1 Overall Summary of Results
The results of the previous three studies show how variation in collector length, and the number of ionization sites influences the efficiency and air flow. Also, the data suggest that the efficiency is very sensitive to voltage. Static efficiency of ionic air moving devices depends strongly on emitter distance, and polarity of the electrodes as well. The results of the third study show the ionic air moving device used less power than a comparable axial fan to cool a low power electronic component.
89 1) When voltage was increased to a maximum with each increase in distance, air
flow reached an optimal value.
2) When voltage was held constant as distance was increased, flow decreased and efficiency increased with distance.
3) When voltage was increased to a maximum with each increase in ring thickness, or with an increase in number of ionization sites, flow increased and efficiency decreased. However if air flow was held constant as ring thickness or number of ionization sites were increased, voltage needed to maintain the flow decreased and efficiency increased.
4) Static efficiency peaked when the distance from the emitter to the collector was between 2.5r. This does not coincide with the distance that provides
maximum air flow.
5) Static efficiency peaked when collector length was 14 mm. This does not coincide with the length that provides maximum air flow.
7) At 462 cm3/s (0.98 SCFM), the negative ionic AMD required 0.17W while the axial fan required 0.40W
8) The negative ionic device consumed slightly less power than the negative device (0.17 W vs 0.19 W) at equivalent air flow, but both consumed less than half the power as the fan.
9) The stated flow conditions and heat sink were sufficient to cool at 17W
component to a reasonable temperature of 70C at an ambient condition of 35C and 3000ft altitude. This is a typical upper bound for computer equipment.
91
7.2 Future Work
While this work shows that ionic air moving devices are more promising alternatives to conventional rotary air moving devices than previously thought, there are still issues that need to be addressed. The following are suggestions for further research.
1) It was shown that air flow and efficiency increased with the number of ionization sites. It is trivial logic that the efficiency and air flow cannot increase without bound and therefore there must be an optimal number of ionization sites. Further investigation should include a needle holder that can hold many more than five needles.
3) Most air flow benches in use by fan manufacturers and by cooling system designers are set up for measuring static efficiency only. Measuring total
efficiency would require addition of a dynamic pressure probe in accordance with ASME PTC 11-2008. This dynamic pressure measurement would enable further comparison of the literature’s method of evaluating efficiency with the industry method. Since the derivations of both methods are based on first principles, and both derivations are validated and widely accepted, albeit by two different groups, the results should agree at some point. That point should be total efficiency at open flow. Static efficiency at open flow is zero, and the dynamic efficiency component is subtracted out, or ignored in the calculation and measurement of static efficiency. It is therefore the measurement of efficiency at open flow similar to the literature method. They should, therefore agree within reasonable
uncertainty.
93 performance curves to comparable ionic devices shows that ionic devices are capable of much less air flow at a given pressure implying that ionic devices can’t be an alternative to larger fans. However this is not a valid comparison, as when the heat sink is made the collector, it is no longer just impedance to the air flow. Rather it is a part of the air moving device actually generating the air flow. For this reason, traditional consideration of impedance and air moving device
performance curves is invalid and must be replaced by a more appropriate metric. In unreported, preliminary experimentation it was observed that an array of needles set in front of a heat sink not optimized for ionic flow, generated enough flow to cool an 85 Watt CPU to reasonable operating temperatures, under
reasonable ambient conditions. Looking at just the performance curves for that same needle array with a ring collector and the impedance curve for that heat sink, would never have led to the conclusion that it could cool an 85 Watt CPU. This work needs to be further carried out with an optimal heat sink geometry in terms of fin spacing, fin thickness, reduction of secondary ionization sites, and needle distance.
6) equivalent length of wire that will represent the same area as many needles. There is no data currently comparing the efficiency of a length of wire as an emitter, to an equivalent number of needles as emitters.
7) Currently the literature focuses on very small ionic air moving devices in the 25mm diameter range. This is a very inefficient size for axial fans. Larger axial fans can be anywhere from 10% – 45% efficient when over 40 mm in diameter. At 25 mm diameter they are around 0.5 % efficient. The previous studies need to be extended to larger ionic air moving devices. However, scaling the ionic devices to larger sizes will likely require geometry changes.
8) Ionic devices are known to emit ozone, which is potentially harmful to humans. Positive coronas produce noticeably less ozone than negative coronas, but for a device intended for consumer applications, these ozone emissions need to be carefully characterized and evaluated.
95 10)Since these devices are also commonly used for air filtration, it is easy to imagine that fouling would be an issue for heat sinks used as part of the ionic air moving device. Control and minimization of fouling must be investigated in order to characterize the expected life or maintenance requirements of one of these systems before they will be widely adopted for electronics cooling applications.
7.3 Future Applications
This fan-less air moving technology is potentially valuable to electronic cooling
applications due to its lack of moving parts, and comparably silent operation. It has been largely ignored by the computer industry due to its reported low efficiency and overall lack of development compared to conventional fans.
In addition to use of ionic air moving devices as primary air moving devices, they are also being investigated to enhance or to control air flow. As previously mentioned, research teams have been investigating boundary layer enhancement (Moreau, 2006; Go
et al, 2008). Enhancements to efficiency of stand-alone ionic air moving devices also
have applicability to these efforts as well.
97 REFERENCES
Air Movement and Control Association International, Inc. and American Society of Heating, Refrigerating and Air-Conditioning Engineers, Inc., Laboratory Methods of testing Fans for Aerodynamic Performance rating, Arlington Heights, Ill. ANSI/ASHRAE Standard 51-1999, ANSI/AMCA Standard 210-99
American Society of Heating, Refrigerating and Air-Conditioning Engineers, Inc., Laboratory Methods of testing Fans for rating, Arlington Heights, Ill. ASHRAE Standard 51-75, AMCA Standard 210-74
American Society of Mechanical Engineers, Power Test Codes for fans, New York: ASME, Power Test Codes, PTC 11-2008
Bondar, H., Bastien, F. Effect of Neutral Fluid Velocity on Direct Conversion from Electrical to Fluid Kinetic Energy in an Electro Fluid Dynamics (EFD) Device, J. Phys. D. Appl. Phys., 19 (1986) 1657
Brown, N.M., Lai, F.C., Electrohydrodynamic Gas Pump in a Vertical Tube, J. Electrostat. 67 (2009) 709-714
Carleton, F.B., Weinberg, F.J., Electric field-induced flame convection in the absence of gravity, Nature 330 (1987) 635
Chakrabarty, R.K. et al, Morphology Based Particle Segregation by Electrostatic Charge, Aerosol Science 39 (2008) 785-792
Chattock, A.P., On the Velocity and Mass of Ions in the Electric Wind in Air, Phil. Mag. S. 5 48 (294) (1899) 401.
Chen, J., Davidson, J.H., Model of the Negative DC Corona Plasma: Comparison to the Positive DC Corona Plasma, Plasma Chem. Plasma Process. 23 (2003) 83
Dunn-Rankin, D., Weinberg, F.J., Using Large Electric Fields to Control Transport in Microgravity, Proceedings of the Interdisciplinary Transport Phenomena in Microgravity and Space Sciences Conference IV, Tomar, Portugal, August 7-12, 2005
Fox, R.W., McDonald, A.T., Introduction to Fluid Mechanics, Fourth ed.,Wiley, New York, 1992, pp. 544-618
Go, D., Garimella, S. V., Fisher, T. S., and Mongia, R. K., “Ionic Winds for Locally Enhanced Cooling,” Journal of Applied Physics Vol. 102, 053302, 2007
Goldman, M., Goldman, A., R.S. Sigmond, The Corona Discharge, Its Properties and Specific Uses, Pure Appl. Chem., 57 (1985) 1353
Hauksbee, F., Physico-Mechanical Experiments on Various Subjects, London, England, pp.46-47, 1709.
Jewell-Larsen, N.E., Hsu, C.P., Krichtafovitch, I.A., Montgomery, S.W., Dibene II, J.T., Mamishev, A.V., CFD Analysis of Electrostatic Fluid Accelerators for Forced Convection Cooling, IEEE Trans. on Dielectr. Electr. Insul., 15 6 (2008) 1745 – 1753 Jewell-Larsen, N.E., Parker, D.A., Krichtafovitch, I.A., Mamishev, A.V., Numerical Simulation and Optimization of Electrostatic air Pumps, 2004 Annual Report Conference on Electrical Insulation and Dielectric Phenomena , (2004) 106 -109
Jewell-Larsen, N.E., Ran, H., Zhang, Y., Schweibert, M.K., Honer, K.A., Mamishev, A.V., Electrohydrodynamic (EHD) Cooled Laptop, 25th IEEE SEMI-THERM Symposium, (2009) 261 – 266
Jewell-Larsen, N.E., Tran, E., Krichtafovitch, I.A, Mamishev, A.V., Design and Optimization of Electrostatic Fluid Accelerators, IEEE Trans. on Dielectr. Electr. Insul., 13 1 (2006) 191 – 203
June, M.S., Kribs, J., Lyons, K.M., Efficiency of Electrostatic Air Moving Devices, J. Electrostat, 68 (2010) 419-423
Kim, C., Park, D., Noh, K.C., Hwang, J., Velocity and Energy Conversion Efficiency Characteristics of Ionic Wind Generator in a Multistage Configuration, J. Electrostat. 68 (2010) 36-41
Komeili, B., Chang, J.S., Harvel, G., Ching, C.Y., Brocilo, D., Flow Characteristics of Wire-Rod Type Electrohydrodynamic Gas Pump Under Negative Corona Operations, J. Electrostat. (2008) 342 – 353
99 Kroll, J., Gerhart, P.M., Jorgensen, R., A Comparison of Two Alternate Methods for Defining Fan Performance, J. Eng. Power, 104 (1982) 177-183
Lawton, J., Weinberg, F., Electrical Aspects of Combustion, Clarendon Press, Oxford, 1969
Maxwell, J.C., Treatise on Electricity and Magnetism, London, England, pp. 52-54, 1873. Moreau, E., Airflow Control by Non-Thermal Plasma Actuators, J. Phys. D: Appl. Phys. 40 (2007) 605-636
Moreau, E., Touchard, G., Enhancing the Mechanical Efficiency of Electric Wind in Corona Discharges, J. Electrostat. 66 (2008) 39-44
Moreau, E., Leger, L., Touchard, G., Effect of a DC Surface-Corona Discharge on a Flat Plate Boundary Layer for Air Flow Velocity up to 25 m/s, J. Electrostat. 64 (2006) 215-225
Newton, I., Opticks, London, England, pp. 315-316, 1718.
Peek, F.W., Dielectric Phenomena in High Voltage Engineering, McGraw-Hill, New York, (1929)
Rickard, M., Dunn-Rankin, D., Weinberg, F., Carleton, F., Characterization of ionic wind velocity, J. Electrostat. 63 (2005) 711
Rickard, M., Dunn-Rankin, D., Weinberg, F., Carleton, F., Maximizing ion-driven gas flows, J. Electrostat. 64 (2006) 368
Rickard, M., Dunn-Rankin, D., Numerical simulation of a tubular ion-driven wind generator, J. Electrostat. 65 (2007) 646
Robinson, M., A History of the Electric Wind, Am. J. Phys. 30 (1962) 366.
Robinson, M., Movement of Air in the Electric Wind of the Corona Discharge, Trans. Am. Inst. Elec. Eng. 80 (1961) 143
Saito, M., Arai, T., Arai, M., Control of Soot Emitted from Acetylene Diffusion Flames by Applying an Electric Field, Combustion and Flame, 119 (1999) 356