Abstract
YU, XIANG. Statistical Methods for the Analysis of Genetic Marker and Microarray Data (under the direction of DR. BRUCE S. WEIR)
With the advent of high-throughput technologies in genomics study, a large volume of data has been accumulated, leaving the challenge for bioinformaticists on how to manage,
analyze, and interpret the data. Analysis of genetic marker and microarray data are two important aspects in current bioinformatics studies. In this dissertation work, we tend to explore some statistical issues for such problems. We discuss two extensions of the EM algorithm to infer haplotypes from genotype data, each for a particular sampling scenario.
The first one applies to a random sample of both diploid and haploid individuals from the population, in which the haplotype information from the haploid individuals is incorporated into the estimation process. The second one applies to a sample of parent-offspring trios, in which the dependencies between the parental and the parent-offspring
genotypes are correctly handled in the analysis. We show that these two modified EM algorithms perform better than the usual one when applied to their corresponding specific samples, respectively. We study the experimental designs in two-color microarray experiments and resolve some of the outstanding issues that are controversial on the use
of different experiment designs. We show that the loop and balanced block designs analyzed in a mixed model are more efficient that the reference designs from a statistical point of view. We also provide general guidelines on how to optimize experimental resources to get maximal efficiency using these designs. We present an application of the
regulatory structures in Sacchromyces cerevisiae using microarray experiments. We demonstrate the mixed model that pools the observations across all experiments to be a
STATISTICAL METHODS FOR THE ANALYSIS OF GENETIC
MARKER AND MICROARRAY DATA
by
XIANG YU
A dissertation submitted to the Graduate Faculty of NORTH CAROLINA STATE UNIVERSITY
in partial fulfillment of the requirements for the Degree of
Doctor of Philosophy
BIOINFORMATICS
RALEIGH 2004
APPROVED BY:
Bruce S. Weir
Chair of Advisory Committee
Dahlia M. Nielsen
Co-chair of Advisory Committee
BIOGRAPHY
Xiang Yu was born in Ganzhou, Jiangxi Province in P. R. China on June 6, 1976. He received a B.S. in bioscience from University of Science and Technology of China, Hefei,
P. R. China in 1999. In August 1999, he was admitted to Department of Cell Biology, Albert Einstein College of Medicine of Yeshiva University in Bronx, New York where he received one year’s PhD training in molecular and cellular biology. In June 2000, he transferred to the bioinformatics program at North Carolina State University and started
working towards a PhD in bioinformatics. In May 2003 he received a Master’s degree in bioinformatics. From June 2000 to May 2001, he worked at the Bioinformatics Research Center (BRC) at North Carolina State University as a research assistant and software developer in statistical genetics on a joint-internship with Cimarron Software Inc. in Salt
ACKNOWLEDGEMENT
My sincere gratitude goes to my advisor, Dr. Bruce S. Weir for his support, guidance and encouragement throughout my graduate study. His enthusiasm and deep insights in
bioinformatics not only provided direction for my dissertation work but also broadened my knowledge in both statistics and bioinformatics. I have been so fortunate to have had his instructions for my dissertation work. I would like to thank the members of my advisory committee, Dr. Dahlia M. Nielsen, Dr. Gregory Gibson and Dr. Russell D.
Wolfinger, for all their healthy discussions and encouragement throughout the years. They have been a great resource for me to get ideas and advice on my research work as well as helpful comments on refining my thesis.
Special thanks to Dr. Tzu-Ming Chu and Dr. Shibing Deng at SAS Institute Inc., who spent a lot of time discussing with me on research problems as well as helping me revise my SAS programs.
I am also deeply grateful to many people at BRC, in particular, Ms. Debra Hibbard, Ms. Juliebeth Briseno, Ms. Alex Rogers for their assistance on all the administrative work to keep me on track, and Dr. Kejun Liu and Mr. Jiaye Yu for their helpful discussions and
suggestions on my work.
Contents
List of Tables……….………...………viii
List of Figures………..………...ix
1. Introduction………1
1.1 Genetic marker haplotype…. ………2
1.2 DNA microarray experiments………5
1.3 References...………..8
2. On the use of the EM algorithm for haplotype estimation with samples consisting of both haploid and diploid individuals……….11
2.1 Introduction………..12
2.2 Materials and Methods……….13
2.3 Results………..………16
2.4 References…..………..18
3. An EM algorithm for haplotype frequency estimation using parent-offspring trios………...….20
3.1 Abstract………..………..21
3.2 Introduction………..…22
3.3 Materials and Methods.………25
3.3.1 Method of Excoffier and Slatkin……….…………..25
3.3.2 Method of Rhode and Fuerst…..……….…………..25
3.3.3 The trioEM algorithm……..……….…………..26
3.3.4 Partial data………..………..…………27
3.4 Results………..31
3.5 Discussion..………..33
3.6 Acknowledgement …..………36
3.7 References....……….37
4. Why loop and balanced block designs are better than reference designs in two-color microarray experiments………44
4.1 Abstract………..………..45
4.2 Introduction………..………46
4.3 Results.………...………..48
4.3.1 Mixed model for two-color microarray experiments………..……..48
4.3.2 Reference design……….………..50
4.3.3 Levels of replication..….. ………51
4.3.4 Loop design……...……….…………52
4.3.5 Balanced block design……….………53
4.3.6 Comparison of loop and reference design……….…..…………54
4.3.7 Power and sample size calculations…..……….……….……….57
4.3.8 Optimization of experimental cost……..……….………....58
4.4 Discussion………..………...61
4.6 Appendix……….………....64
4.8 References.……..………73
4.9 Figure legends………..………....…...79
5.1 Abstract………..………..87
5.2 Introduction………..………88
5.3 Results.………...………..91
5.3.1 Experimental design and data………...………..……..91
5.3.2 Data quality inspection..……….………..91
5.3.3 Mixed model normalization and analysis.………92
5.3.4 Identification of transcriptional regulatory motifs……...………..96
5.4 Discussion………..………....102
5.5 Acknowledgements.………...106
5.6 References……..………107
List of Tables Page
Table 2.1 Comparison of four methods for haplotype estimation using diploid-haploid
mixture data..………..………..…….19 Table 3.1: Comparisons of similarity index for the five algorithms……….41 Table 3.2: Comparisons of error rate for the five algorithms...………….………42 Table 3.3: Comparisons of switch accuracy for the five algorithms …...……….………43
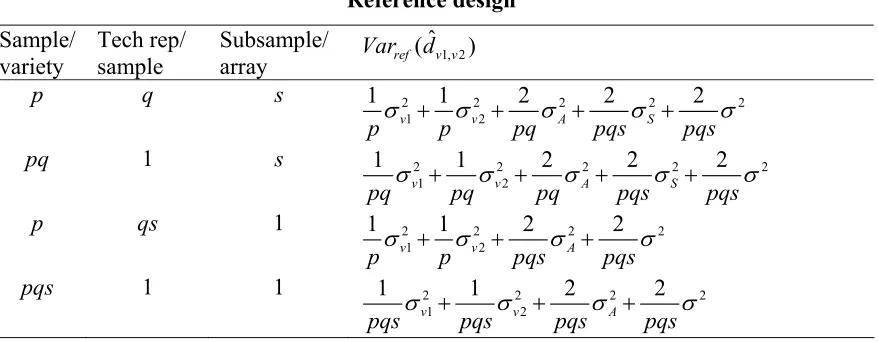
Table 4.1: Effects of three different replication levels on the variance of the estimated
difference dˆv v1, 2….……….………75 Table 4.2: Analytical solutions of Var d(ˆv v1, 2)in a loop design for v = 2 to 7………76 Table 4.3: Optimal number of samples and arrays for the reference design and the loop
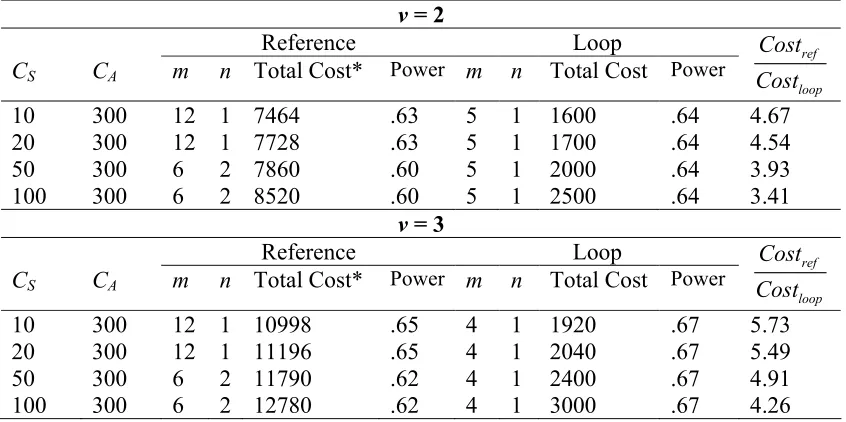
design for a given power..………..………77 Table 4.4: Optimal number of samples and arrays for the reference design and the loop design for a given budget..……….………..78 Table 5.1: Multiple-testing adjustment and the effect of p-value threshold on the number
List of Figures Page
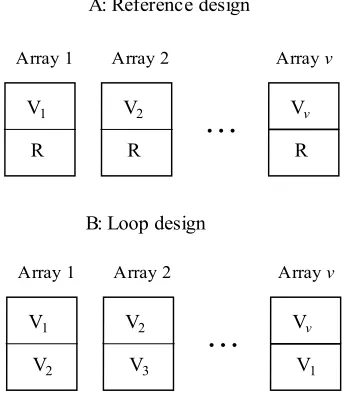
Figure 4.1: Layout of a reference design and a loop design using v arrays for v
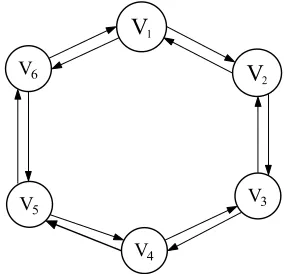
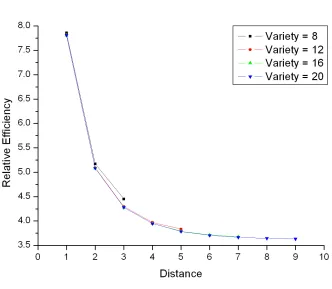
varieties………..81 Figure 4.2: A simplified diagram of a loop design for v = 6 varieties…...………....82 Figure 4.3: Relative efficiency of the loop design vs. the reference design for different number of varieties v = 8, 12, 16 and 20…………..……….………83
Figure 4.4: Relative efficiency (RE) of the loop design vs. the reference design for different values of the random components and different numbers of varieties …….…..84 Figure 4.5: Power curve for the loop design vs. the reference design when the total number of arrays is 4v………85
Figure 5.1: Scatter plot of block 21, 22, 25 and 26 of array 3997 for transcription factor Zap1 with its two replicates (array 3998 and array 3999). ……….114 Figure 5.2: Pseudo image of array 3997 and its replicate 3998 from transcription factor Zap1…..………...115
Figure 5.3: Scatter plot of array 3997 with its two replicates (array 3998 and array 3999) before (left panel) and after (right panel) removal of four dubious blocks……….116 Figure 5.4: Histogram of R2 values for the 6,279 genes from the mixed model …..…..117 Figure 5.5: Comparison of negative log10 p-values from the mixed model and the error
Chapter One
Genetic marker haplotype
Gene-marker association tests have been largely used in mapping genetic traits in which a genetic marker serves as a physical anchor to locate linked genes that affect the traits. A
haplotype is the combination of marker alleles from different loci on one chromosome. Haplotypes can bear more information than a single marker in that several linked loci are transmitted together from the parent to the offspring and that several different loci may contribute synergistically to a particular trait. In recent years, much attention has been
paid to haplotype-based association tests. A haplotype can be treated as a superior marker and used in regular contingency-table based single-marker tests. Schaid et al. (2002) developed a generalized score test between traits and estimated haplotypes and Zaykin et al. (2003) proposed a similar regression approach that models a quantitative or
categorical trait on estimated probabilities of haplotypes. Tests based on similarities between haplotypes in cases and controls have also been proposed and prove powerful under some conditions (van der Meulen and te Meerman 1997; Tzeng et al. 2003). Haplotype-based tests can sometimes be more powerful than a single-marker approach
(Martin et al. 2000; Fallin et al. 2001) whereas some argue that the controversy holds that single-marker analysis performs better than haplotype-based ones (Long and Langley 1999; Kaplan and Morris 2001). Nielsen et al. (2004) discussed the effects of two- and three-locus linkage disequilibrium (LD) on the power of these two approaches and find a
haplotype-based test to be more powerful when the three-locus LD is strong.
remains a question without involving a much more complicated haplotyping procedure. Because molecular haplotyping technique is time- and cost-consuming, people tend to
infer haplotypes from genotype data using statistical methods. Depending on whether the data are collected from large, collateral families or from randomly sampled individuals from the population, different statistical methods can be applied accordingly. Of those methods, the EM algorithm is the most popular one that works on population data (Hill
1974; Weir and Cockerham 1979; Excoffier and Slatkin 1995). The EM algorithm starts with compiling a list of compatible haplotypes and assigning initial frequency to each one, evaluates relative probabilities of all combinations of possible haplotype pair for each individual and then updates frequencies for each haplotype, and repeats the evaluation
and updating steps until convergence is reached. The EM algorithm has proven accurate in practice by a number of researchers either through phase-known data (Tishkoff et al. 2000) or from extensive simulation studies (Fallin and Shork 2000). The weakness of the EM algorithm is its exponential complexity since the number of possible haplotypes
grows exponentially with the number of marker and each haplotype needs to be evaluated at each expectation-maximization step. An alternative would be the Bayesian method (Stephens et al. 2001; Lin et al. 2002) that incorporates the coalescent theory in to a Markov Chain Monte Carlo (MCMC) technique. In the Bayesian algorithm, a Gibbs
sampler is used to assign a haplotype-pair to each individual and reassignment at each step is calculated based on the current haplotype frequencies as well as the population mutation rate estimated using the coalescent theory. Because it eliminates the need to evaluate every haplotype, the complexity of the Bayesian algorithm is linear and it can
The EM algorithm assumes Hardy-Weinberg equilibrium (HWE) so that the genotype
frequency in the population can be calculated as the product of haplotype frequencies. In a random sample of diploid individuals, haplotypes are unknown and must be estimated. When a sample of both diploid and haploid individuals is collected, for instance in genotyping both males and females on the X chromosome, haplotypes are known for
some individuals and can thus provide information in estimating the unknowns. The usual EM algorithm works on the diploid individuals and does not take advantage of haploid ones. In chapter 2 we discuss an extension of the usual EM algorithm that can be applied to a mixture of both diploid and haploid samples. We show that the new EM
algorithm improves the accuracy of the haplotype frequency estimates by appropriately incorporating the additional information from the known haplotypes. In another scenario, genotypic data from parent-offspring trios are collected and haplotypes are to be estimated. The usual EM algorithm encounters the difficulty that the samples are not
necessarily independent. Only the parents can be regarded as randomly sampled from the population and the offspring genotype depends on its parental genotypic configurations. In addition, because the parental genotype determines which haplotype can be possibly transmitted to the offspring, extra information of haplotypes is embedded in the data on
the offspring. In chapter 3 we discuss a new EM algorithm to estimate haplotype frequencies that handles and takes advantage of the dependency between the related samples when parent-offspring trios are collected. The new EM algorithm is superior to the conventional EM algorithm that uses only the independent parents in the sample or
conventional EM algorithm applied to a sample of independent individuals with an equivalent size.
DNA microarray experiments
Over the past decade, a number of high-throughput technologies have been developed and applied to the study of genomic science, of which microarray is a most popular one. The microarray technique was first introduced by Brown’s lab in 1995 (Schena et al.
1995) in the form of spotted cDNA arrays and then as oliogo-nulceotide chips in 1996 (Lockhart et al. 1996). By planting the sequences from thousands of genes on a small glass slide followed by hybridization of the extracted RNA to that slide, microarray can measure the transcription level of those genes simultaneously. Despite its recent
emergence, microarray technology has brought about great opportunities in functional genomics studies as well as challenges to draw solid statistical inferences from the typically high-dimension yet few-replication microarray data.
One of the basic questions for microarray experiments is to identify which genes are differentially expressed. In statistical term, this is equivalent to testing the null hypothesis that the levels of RNA transcription are equal between the two samples to be compared. Traditionally, biologists evaluate the amount of RNA in a treatment sample and a
distribution assumption for p-value calculation owing to the factor that the sample size for each gene is usually small and that the normality assumption may not hold for all
genes. By pooling all observations from the data and finding sources of variation that contribute to the transcriptional measurements and formulating a hypothesis test for each gene, the ANOVA model has proven a powerful and flexible method to detect differentially expressed genes (Kerr et al. 2000; Wolfinger et al. 2001). A bonus of the
ANOVA model is that it can also control for other covariates that may affect the gene expression level.
As important as data analysis in a microarray study is design of the experiment. Variation
in microarray experiments comes from multiple sources including but not limited to spot size, dye-incorporation and hybridization efficiency. These sources of variation should be accounted for when designing a microarray experiment so that the effect of interest is not confounded with ancillary effects as well maximizing the information obtained while
minimizing the overall cost. Traditionally, biologists use a reference design in which the RNA samples from a variety of interest and a common reference are hybridized to the same array. The intensity ratio of the variety vs. the reference is then used to assess differential gene expression. Such a reference design “wastes” half of the observations on
the reference sample which is typically of no interest. In their study, Kerr and Churchill (2001) discussed the inefficiency of the reference design and proposed a loop design as an alternative that eliminates the need for the reference sample. Dobbin and Simon (2002), however, came up with a somehow controversial conclusion and recommended a
resolve this controversy. We compare the loop and the reference design from a mixed model perspective and show that the loop design and balanced block design are better
than the reference design in terms of statistical efficiency and overall cost. We also provide some general guidelines on how to optimize experimental resources using these designs in practice.
Microarray technology has been widely used but not limited to identify differentially expressed genes or to classify gene clusters based on their expression profiles. In chapter 5, we discuss an experiment designed to identify protein-DNA interactions simultaneously for thousands of genes on a microarray platform (Lee et al. 2002). We
discuss an application of the log-linear mixed model to draw proper statistical inferences from the so called “genome-wide location analysis” experiment in which thousands of chromatin immunoprecipitations are conducted at the same time on a microarray platform. We also demonstrate how to assemble transcriptional regulatory motifs based on pairs of
transcription factors and gene promoters identified by the mixed model to be directly interacting with each other. The results show that a gene-by-gene mixed model that pools observations across all transcription factors to assess each gene for each transcription factor is much more powerful than a t-test that uses only few observations of that gene for
References
Chu TM, Weir BS, Wolfinger RD (2002) A systematic statistical linear modeling approach to oligonucleotide array experiments. Math Biosci 176:35-51
Dobbin K, Simon R (2002) Comparison of microarray designs for class comparison and class discovery. Bioinformatics 18:1438-1445
Excoffier L, Slatkin M (1995) Maximum-likelihood estimation of molecular haplotype frequencies in a diploid population. Mol Biol Evol 12:921-927
Fallin D, Cohen A, Essioux L, Chumakov I, Blumenfeld M, Cohen D, Schork NJ (2001) Genetic analysis of case/control data using estimated haplotype frequencies: application to APOE locus variation and Alzheimer’s disease. Genome Res 11:143-151
Fallin D, Schork NJ (2000) Accuracy of haplotype frequency estimation for biallelic loci,
via the expectation-maximization algorithm for unphased diploid genotype data. Am J Hum Genet 67:947-959
Hill WG (1974) Estimation of linkage disequilibrium in randomly mating populations. Heredity 33:229-239
Kaplan N, Morris R (2001) Issues concerning association studies for fine mapping a susceptibility gene for a complex disease. Genet Epidemiol 20:432-457
Kerr MK, Churchill GA (2001) Experimental design for gene expression microarrays. Biostatistics 2:183-201
Lee TI, Rinaldi NJ, Robert F, Odom DT, Bar-Joseph Z, Gerber GK, Hannett NM et al. (2002) Transcriptional regulatory network in Sacchromyces cerevisiae. Science
298:799-804
Lin S, Cutler DJ, Zwick ME, Chakravarti A (2002) Haplotype inference in random population samples. Am J Hum Genet 71:1129-1137
Lockhart DJ, Dong H, Byrne MC, Follettie MT, Gallo MV, Chee MS, Mittmann M,
Wang C, Kobayashi M, Horton H, Brown EL (1996) Expression monitoring by hybridization to high-density oligonucleotide arrays. Nat Biotechnol 14:1675-1680
Long AD, Langley CH (1999) The power of association studies to detect the contributions of candidate genetic loci to variation in complex traits. Genome Res
9:720-731
Martin ER, Lai EH, Gilbert JR, Rogala AR, Afshari AJ, Riley J, Finch KL, Stevens JF, Livak KJ, Slotterbeck BD, Slifer SH, Warren LL, Conneally PM, Schmechel DE, Purvis I, Pericak-Vance MA, Roses AD, Vance JM (2000) SNPing away at complex diseases:
analysis of single-nucleotide polymorphisms around APOE in Alzheimer disease. Am J Hum Genet 67:383-394
Nielsen DM, Ehm MG, Zaykin D, Weir BS. 2004. Effect of two- and three-locus linkage disequilibrium on the power to detect marker/phenotype associations. Submitted
Schaid DJ, Rowland CM, Tines DE, Jacobson RM, Poland GA (2002) Score tests for association between traits and haplotypes when linkage phase is ambiguous. Am J Hum Genet 70:425-434
Schena M, Shalon D, Davis RW, Brown PO (1995) Quantitative monitoring of gene
Stephens M, Smith NJ, Donnelly P (2001) A new statistical method for haplotype reconstruction from population data. Am J Hum Genet 68:978-989
Tishkoff SA, Pakstis AJ, Ruano G, Kidd KK (2000) The accuracy of statisitical methods for estimation of haplotype frequencies: an example from the CD4 locus. Am J Hum Genet 67:518-522
Tzeng JY, Devlin B, Wasserman L, Roeder K (2003) On the identification of disease
mutations by the analysis of haplotype similarity and goodness of fit. Am J Hum Genet 72:891-902
van de Meulen MA, te Meerman GJ (1997) Haplotype sharing analysis in affected individuals from nuclear families with at least one affected offspring. Genet Epidemiol
14:915-920
Weir BS, Cockerham CC (1979) Estimation of linkage disequilibrium in randomly mating populations. Heredity 42:105-111
Wolfinger RD, Gibson G, Wolfinger ED, Bennett L, Hamadeh H, Bushel P, Afshari C,
Paules RS (2001) Assessing gene significance from cDNA microarray expression data via mixed models. J Comp Biol8: 625-637
Zaykin DV, Westfall PH, Young SS, Karnoub MA, Wagner MJ, Ehm MG (2002) Testing association of statistically inferred haplotypes with discrete and continuous traits in
Chapter Two
On the Use of the EM Algorithm for Haplotype
Estimation with Samples Consisting
of both Diploid
Introduction
Inferring haplotypes from phase unknown genotype data is a common problem in genetic data analysis. The EM algorithm (Hill 1974; Weir and Cokerham 1979; Excoffier and
Slatkin 1995) is the most popular method for haplotype inference that utilizes randomly sampled diploid individuals. In some situations we might have haploid and diploid mixture data, for example, when we sample markers on the X chromosome from both females and males. In such a case, the normal EM algorithm can only be applied to
females with a pair of X chromosomes, resulting in under-utilization of data and a biased estimate of the population haplotype frequency. One way to utilize all diploid and haploid data might be to first estimate haplotype frequencies using the diploid individuals and then calculate the pseudo counts of each haplotype by first multiplying the inferred
haplotype frequency with chromosome counts from the diploid data and then add the real counts of haplotypes from the haploid data. Such a method ignores the information we might have gained from the haploid data while estimating the diploids. Here we propose a modified EM algorithm for estimation of such mixture data that correctly utilizes all
information from the data. Simulation studies showed that this new algorithm performs better than one that applies the EM algorithm to the diploid data only and then calculates the pseudo count of each haplotype. Improvement in the accuracy of haplotype estimates is gained from the new algorithm over the normal EM algorithm applied to a diploid
Materials and Methods
1. The EM algorithm
Let gi denote the ith genotype observed (gi could be either haploid or diploid), i = 1, 2, …, n. Assume randomly mating, the likelihood of observing the data is then
1
( ) n
i i
L p g
=
=
∏
We say that a haplotype h is compatible with a diploid genotype gd if there exists
another haplotype hc such that the gametic union of h and hc can constitute d
g . Here
c
h is the complementary haplotype of h with respect to the diploid genotype gd .
Obviously, if h is compatible with gd, then hc is also compatible with d
g . We use
d
h⊗g to denote that h is compatible with gd and h⊗gd otherwise. If gd has missing
alleles, then we define h⊗gd if there exists another haplotype 'h and the union of h and
'
h differs from gd only at the missing alleles. Similarly, we can define compatibility of a
haplotype h and a haploid genotype gh as h⊗gh if h and gh have the same allele at all
loci except for missing alleles.
Let hk denote the kth haplotype in the compatible haplotype set Hj of the genotype gj. If gj is haploid, then we have Hj ={ }gj for a gj that bears no missing alleles or
{ | and have the same allele at all non-missing loci}
j j
H = h h g when gj has missing
alleles. Under the assumption of random union of gametes, we can construct an EM
algorithm as follows:
( ) ( ) ( )
( )
( ) ( ) , if diploid ( )
( ) , if haploid j
j
t c t
k k j
k H t
j t
k j
k H
f h f h g
p g
f h g
∈ ∈ =
∑
∑
where ( )( )t k
f h is the frequency of haplotype hk at the tth iteration.
1b. M-step: let nd denote the number of diploids and nh denote the number of haploids in
the sample, new haplotype frequency can be obtained from the genotype frequencies.
( ) ( ) ( )
( 1)
( ) ( )
is diploid is haploid
( ) ( ) ( ) ( )
1 ( )
2 j ( ) j ( )
t c t t
jk k k k j k
t
k t t
g g
d h j j
m f h f h I h H f h
f h
n n p g p g
+ = + ∈
+
∑
∑
where mjk =0 if h⊗g; mjk =1 if hk ⊗gj and c
k k
h ≠h (that is, gj is heterozygous with
respect to hk) ; mjk =2 if hk ⊗gj and gj is homozygous with respect to hk. 2. Simulations
We performed simulations to verify the adequacy of our EM algorithm. The simulations are based upon empirical haplotype frequency data. Haplotype frequencies at a 20Kb
region on the X chromosome in Drosophila melanogaster that includes two genes, zeste and tko, are obtained by direct counting of 27 isogenic X chromosome lines from the Texas population (Aguade et al. 1989). The zeste-tko region carries 10 restriction site and 4 insertion/deletion polymorphisms. In each sample, we generate n diploid individuals
and n haploid ones. We first sampled 3n haplotypes based on their frequencies and then
randomly paired two gametes from 2n of them to generate n dipoid individuals. The
sample of 2n individuals thus has n diploids with known phase and n haploids. The
first one uses a two-stage approach by first estimating haplotypes from the diploid data and then calculating pseudo counts of haplotypes and adding real counts of haplotypes
from the haploids, which we label as EMts. The second one uses only the diploid data to get haplotype frequencies and we label it EMd and the third one calculates haplotype frequencies by counting only the haploid data and is labeled EMh*. For each approach, we then used the estimated haplotype frequencies to assign the most probable haplotype pair
to each diploid individual. EMh* is marked by a * because it does not actually use an EM algorithm to estimate haplotype frequencies. However, to determine the best phase assignment for diploid individuals, the same calculations as the other three methods are performed in the EMh* approach to get the probabilities of a genotype being resolved to a
particular haplotype pair based on estimated haplotype frequencies. For the fourth one, we generated an additional data set consisting of diploid individuals but with an equivalent number of chromosomes. For example, if we generate n diploid individuals
and n haploid ones for a mixture data set, we will generate another data set with 1.5n
Results
We performed 1,000 independent simulations and recorded the average of the three summary statistics for the four methods in Table 2.1.
The results show an improvement in overall accuracy of haplotype frequency estimates, measured by similarity index, when EMm is used as compared to EMts. The improvement becomes more significant when the sample size is small, or there exists missing genotypes in the data set. When error rate and switch accuracy are compared, the two
methods appear to give the same results since their haplotype frequency estimates tend to be similar in terms of both the range of each individual haplotype frequency and the distribution of frequencies for all haplotypes. Therefore, the probability of a genotype having a particular haplotype pair tends to be close as well, resulting in the same
assignment. The results imply that the two-stage EM algorithm might be a good approximation at a first trial in practice though correct inference should be drawn from the EM algorithm that appropriately incorporates the haploid data into analysis.
The improvement of EMm for all three measures over the other two methods, EMd and
EMh*, however, turns out to be quite significant because those two methods fail to utilize all information from the data. Note that when there exists missing data, the error of EMh* is greatly inflated because any haplotype bearing one or more missing alleles is excluded from haplotype counting.
Overall, we found the accuracy of haplotype frequency estimates can be improved by this modified EM algorithm suitable for the special case where both haploid and diploid
References
Aguade M, Miyashita N, Langley CH (1989) Restriction-map variation at the zeste-tko region in natural populations of Drosophila melanogaster. Mol Biol Evol 6:123-130 Excoffier L, Slatkin M (1995) Maximum-likelihood estimation of molecular haplotype frequencies in a diploid population. Mol Biol Evol 12:921-927
Hill WG (1974) Estimation of linkage disequilibrium in randomly mating populations. Heredity 33:229-239
Lin S, Cutler DJ, Zwick ME, Chakravarti A (2002) Haplotype inference in random
population samples. Am J Hum Genet 71:1129-1137
Table 2.1: Comparison of four methods for haplotype estimation using diploid-haploid mixture data. Results are from 1,000 simulations.
Method No. Diploids No. Haploids Percent Missing (%)
Similarity Index
Error Rate Switch Accuracy
EMm 20 20 0.00 0.964 0.0540 0.967
EMts 20 20 0.00 0.917 0.0540 0.967
EMd 20 20 0.00 0.852 0.0800 0.952
EMh* 20 20 0.00 0.795 0.0130 0.990
EMe 30 0 0.00 0.942 0.0630 0.962
EMm 20 20 5.00 0.934 0.114 0.941
EMts 20 20 5.00 0.866 0.114 0.941
EMd 20 20 5.00 0.815 0.165 0.913
EMh* 20 20 5.00 0.659 0.743 0.495
EMe 30 0 5.00 0.909 0.125 0.932
EMm 100 100 0.00 0.988 0.0190 0.987
EMts 100 100 0.00 0.962 0.0190 0.987
EMd 100 100 0.00 0.936 0.0330 0.979
EMh* 100 100 0.00 0.898 0.0150 0.988
EMe 150 0 0.00 0.980 0.0230 0.985
EMm 100 100 5.00 0.979 0.0670 0.969
EMts 100 100 5.00 0.940 0.0670 0.969
EMd 100 100 5.00 0.928 0.0830 0.959
EMh* 100 100 5.00 0.836 0.714 0.517
Chapter Three
An EM Algorithm for Haplotype Frequency Estimation
Abstract
Inferring haplotypes from genotype data is generally accomplished with the EM algorithm for samples of unrelated individuals or by examination of parent-offspring
transmissions in pedigrees. The EM algorithm can not be used when there are dependencies among individuals, and pedigree methods are hampered when multiple loci are heterozygous. We propose a modified EM algorithm under the assumption of Hardy-Weinberg equilibrium (HWE) to infer the maximum likelihood estimates of haplotype
frequencies using parent-offspring trios, so that we combine the advantages of unrelated samples and family data. By considering only the haplotypes that could possibly have been transmitted from parent to offspring, our EM algorithm can appropriately take into account the family dependencies. This new EM algorithm also handles the common
Introduction
A haplotype, being a natural organization of alleles located at different polymorphic loci on one chromosome, carries more information than single markers that comprise it and
may directly reflect inheritance patterns and evolution history (Judson et al. 2000). Inference on haplotypes is always of interest and haplotype analysis has become a particularly important tool in human disease studies. It has been postulated that haplotype-based tests are more powerful than the single-marker association tests in many
cases. A haplotype may directly harbor the unobserved disease locus and thus act as a superior marker, or several loci each with a small phenotypic effect could act synergistically to cause the disease. Therefore, it might be more powerful to examine the properties of multi-locus haplotypes in disease gene mapping. The study of association of
Alzheimer’s disease (AD) and SNPs in the APOE gene region (Martin et al. 2000; Fallin et al. 2001) found that a haplotype-based approach was sensitive in finding disease-predisposing SNPs, whereas standard single marker mapping failed to detect associations for some of the SNPs. Haplotypes have also been shown to provide valuable information
in locating disease susceptibility genes in Crohn’s disease (Rioux et al. 2001), finding a gene responsible for human lipoprotein lipase (Clark et al. 1998).
Haplotypes can be determined with certain molecular laboratory techniques such as long-range PCR (Michalatos-Beloin et al. 1996), heteroduplex analysis (Chang and Kidd 1997)
and sperm-crossover analysis (Jeffreys et al. 2001) etc, but those approaches are usually time- and cost-prohibitive for large scale studies. Statistical methods such as the Expectation-Maximization (EM) algorithm (Hill 1974; Weir and Cockerham 1979) can
When family data are collected, haplotype configurations can be obtained by tracing parent-offspring gamete transmissions. However, not all haplotypes can be resolved
without ambiguity owing to the fact that both the parents and their offspring may be heterozygous at more than one locus. As noted by Hodge et al. (1999), the extent of phase ambiguity increases quickly with the number of loci. Genotyping of additional relatives could reduce the ambiguity, yet it could still be very significant even with a
moderate number of loci. To resolve phase with ambiguities, one simple approach might be to first get all unambiguous genotypes and then assign a “best guess” haplotype pair to an ambiguous one based on how frequent these haplotypes are observed from the unambiguous data. The parsimony algorithm proposed by Clark (1990) is an analogous
one applied to population data that assigns a single haplotype pair to an ambiguous genotype based upon the currently available haplotype list. Stochastic techniques for haplotype reconstruction have been established for pedigrees that use either simulated annealing with random walk of pedigree sampling (Sobel and Lange 1996) or Hidden
Markov Models (HMM) to choose an optimal inheritance vector (Kruglyak et al. 1996). The likelihood based EM algorithm is widely adopted for inferring haplotypes and it is suitable for unrelated individuals where family structures are not incorporated into the analysis. When there are related individuals in the sample, one has to select only the
independent ones in order to comply with the conditions of the EM algorithm, resulting in a loss of information. It would be better to combine the population sample with additional information provided by relatives. Boehnke (1991) described a method to estimate allele frequencies that makes use of all available information while correctly
an EM algorithm for solving maximum likelihood estimates for two-locus haplotypes when both siblings and their parents are used in the sample. Rohde and Fuerst (2001)
suggested including only the parents in the expectation-maximization steps but their offsprings are used to eliminate unlikely transmissions, assuming the loci are tightly linked and no recombination occurs. Here we extend these studies and propose a modified EM algorithm for haplotype inference that is suitable for parent-child trio
Materials and methods
Let gif, gim, gio denote the father, mother and offspring observed in the ith trio, i = 1,
2, …, n. Assuming random mating and independent sampling of trios from the population, the likelihood of observing the data, following the general framework of pedigree data analysis (Elston and Stewart 1971) is
1
( | , ) ( ) ( ) n
io if im if im
i
L p g g g p g p g
=
=
∏
.Method of Excoffier and Slatkin (1998)
For two-locus haplotypes, assuming there is no recombination, Excoffier and Slatkin (1998) considered all family members jointly and wrote the likelihood for each family as
i fj mj j
j
L =
∑
g g s ,where the summation is taken over all possible genotype combinations of the members
for family i. sj is the Mendelian segregation probability of the offspring’s genotype
combination j. Under the assumption of Hardy-Weinberg equilibrium, the genotype
frequencies of gfj and gmj can be written as product of haplotype frequencies for each
possible haplotype pairs (h h1f, 2f) and (h h1m, 2m). The segregation probability sj =1/ 4 if the offspring’s genotype is consistent with one of the four possible gametic compositions
1 1 1 2 2 1 2 2
{h h h hf m, f m,h h h hf m, f m} and sj =0 otherwise. The EM algorithm starts with some
calculate haplotype frequencies from nuclear families but discards uninformative families (without any affected offspring) and families that have too many possible combinations.
Method of Rhode and Fuerst (2001)
The algorithm described by Rhode and Fuerst (2001) uses only the parents from the sample in the conventional expectation and maximization steps. However, the offspring is used to eliminate impossible combinations of parental genotypes where it fails to
inherit one gamete from each parent, assuming no recombination occurs in the loci studied.
The trio EM algorithm
For a genotype g, we define a haplotype hg to be compatible with g if there exists
another haplotype c g
h such that the gametic union of hg and c g
h can constitute g. Here
c g
h is the complementary haplotype of hg with respect to genotype g. Obviously, if hg
is compatible with g, then c g
h is also compatible with g. We use h⊗g to denote that a
haplotype h is compatible with g and h⊗g otherwise.
For an offspring, not only should a haplotype h be compatible with the offspring, but
also h and its complementary haplotype c g
h should be transmitted from its parents and
therefore be compatible with at least one of these parents. Compatibility of haplotype h
with an offspring genotype g and the corresponding parental genotypes gf and gm, is
then defined as:
(
)
( , , ) if and either , c or , c
f m f g m m g f
h⊗ g g g h⊗g h⊗g h ⊗g h⊗g h ⊗g
1. E-step: the probability of observing a genotype g is
( ) ( ) ( )
( ) ( ) ( , , )
( ) ( ) , if is a parent ( )
( ) ( ) , if is an offspring and and are the parents f m
t c t
g h g
t
t c t
g f m
h g g g
f h f h g
p g
f h f h g g g
⊗ ⊗ =
∑
∑
where f h( )( )t is the frequency of haplotype h at the tth iteration. For an offspring g, the
summation is taken over all haplotype pairs h and c g
h that can be possibly transmitted
from its parents gf and gm.
1. M-step: for each haplotype h, new haplotype frequency can be obtained from the
genotype frequencies. ( ) ( ) ( 1) ( ) ( ) ( ) 1 ( )
2 ( )
t c t
h h g
t
t g
m f h f h
f h
n p g
δ
+ =
∑
where mh is the number of times h appears in genotype g. mh =0 if h⊗g; mh =1 if
h⊗g and c g
h h≠ (that is, g is heterozygous with respect to h) ; mh =2 if h⊗g and g
is homozygous with respect to h. δh is an indicator variable defined as
1, if is a parent or if is an offspring and ( , , ) 0, otherwise
f m
h
g g h g g g
δ = ⊗
Partial data
An individual’s k-locus genotype is called partial if not all alleles at the k loci are scored. The EM algorithm maintains a list of all possible haplotypes that can be obtained from the genotype data and these haplotypes are fully scored with no missing alleles. During the iterations, a partial genotype or haplotype is handled by considering all possible
constitute genotypes differing from g only at the missing alleles. Correspondingly, in the
M-step, a haplotype h that is compatible with a partial genotype may bear some missing
alleles. Such a haplotype is not considered as a new haplotype, but rather all existing haplotypes with alleles identical to the non-missing ones of h and are compatible with
observed parent-offspring structure will get updated. Simulations
Simulations were performed to verify the adequacy of this EM algorithm. The
simulations are based upon empirical haplotype frequency data. Haplotype frequencies at the D4S10 locus in 3 different populations, African American, Finn and Maya, were downloaded from the ALFRED web site (Osier et al. 2001). The D4S10 locus carries 5
restriction site polymorphisms spanning over 15.3Kb. In order to generate N trios, we first sampled 4n haplotypes based on their frequencies and randomly paired two gametes
to generate 2n individuals with phase known genotypes. The 2N individuals were then
randomly paired and each of the pairs generated one offspring. The N parents-offspring
trios were recorded as our input data. We assumed no recombination across the five sites during the mating and generate samples of 25 or 100 trios.
We first use the similarity index, If, to measure the overall accuracy of the haplotype
frequency estimates (Excoffier and Slatkin 1995).
0
1 ˆ
1 | |
2
f i i
i
I = −
∑
f − f ,where ˆfi is the estimated haplotype frequency of the ith haplotype and f0i is the sample frequency. The summation is taken over all true and inferred haplotypes and If takes a
haplotype frequencies and the estimates are equal. If measures the overall absolute
deviations of the estimates from their true frequencies. Similar measurement has been used in several other studies (Stephens et al. 2001; Single et al. 2002).
To assess the accuracy of haplotype reconstruction for each of the individuals, we assigned the most probable haplotype pair to each individual and compared the assignment to its true gamete phase. Similar studies have been adopted by Stephens et al. (2001) and Zhang et al. (2001). Once the EM algorithm has arrived at MLEs for the
haplotype frequencies, the probability that a genotype g consists of a particular
compatible haplotype h and its complementary haplotype c g h is:
2 Pr( , | )
Pr( ) h h m c g c g hh h h g
g
δ =
where 0 if c
h g
m = h h= and 1 if c
h g
m = h h≠ indicates if g is heterozygous with respect to
h and δh is another indicator variable showing if h can be transmitted from either
parent. The quantity δh is defined as:
(
)
0, if is an offspring and either , or , 1, otherwise
m f f m
h
g h g h g h g h g
δ = ⊗ ⊗ ⊗ ⊗
For each individual, all compatible haplotype pairs are evaluated and the one with the largest probability is assigned. The error rate for phase identification is then recorded as the proportion of individuals with incorrect phase assignment.
For a large number of markers, the exact linkage phases are less likely to be correctly
1 1
n sw
SA n
− − =
−
n is the number of heterozygous sites and sw is the number of crossover events between neighboring heterozygous sites needed to recover the true gamete phases. The switch
accuracy we reported is the average over all individuals in the data set.
For each data set, we employed our trio EM algorithm, the usual EM algorithm with only the parents, the usual EM algorithm using all data. We also implemented the algorithm of Rhode and Fuerst (2001) and extended it to be able to handle partial data. We applied this
algorithm to our data set, as well. For each simulation, another data set with equal size of independent individuals was generated and the usual EM algorithm was applied on it. Partial data were generated by randomly omitting a given proportion of genotypes uniformly across all markers. We performed 100 independent simulations for each
Results
In the following discussion, we use EMT to denote our trio EM algorithm, EMP for the usual EM algorithm that uses only the sample of independent parents, EMA for the usual
EM algorithm using all individuals but ignoring parent-child dependency, EMP* for the Rhode and Fuerst (2001) algorithm, and EME for the usual EM algorithm with an equivalent sample of independent individuals.
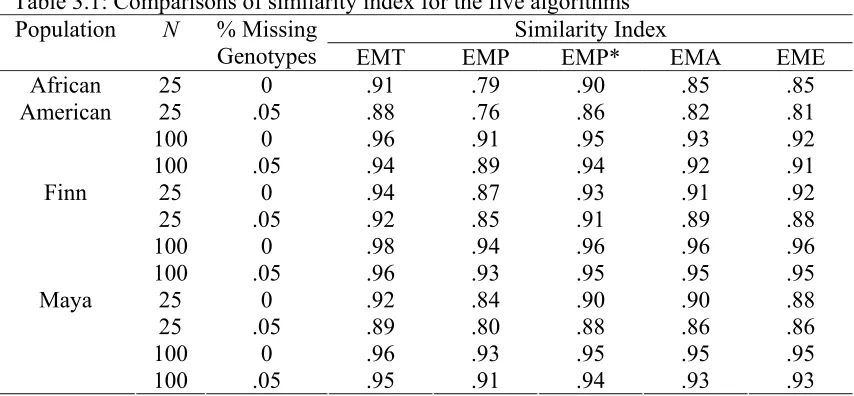
The similarity index values are summarized in Table 1. It can be seen that, in general, our
EMT algorithm improves accuracy for haplotype frequency estimates over all four other methods. The slight improvement of EMT over EMP* is due to a larger sample size that results from using all information. Although EMA performs similarly to EME, it has a slightly larger variance due to inappropriate incorporation of dependent relatives (data
not shown). Among the three populations, the accuracy is worst for African American and best for Finnish and that of Mayan falls between those two. This is because African American is the most diversified population. There are 16 different haplotypes for the five markers and five of them have frequencies above 0.05. The most abundant haplotype
has a frequency of 0.453. The Finnish sample population has only 10 haplotypes, four of which have frequencies 0.05> and the most abundant one is 54.2%. The diversity of the
Mayan population is between African American and Finns with 14 distinct haplotypes and six of which 0.05> . We can see that the accuracy of haplotype estimates tends to
decrease when the true frequency becomes more evenly distributed, as discussed by Fallin and Schork (2000).
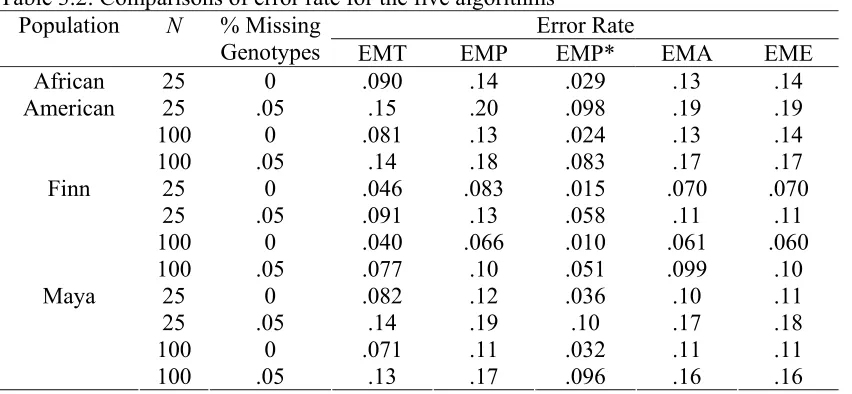
Comparisons of phase reconstruction error rates are shown in Table 2. Among the five
cases. However, it should be noted that EMP* uses information from the offspring to reconstruct the parental phases but the error rate was calculated based solely on parental
phases. The error rate is expected to be larger if the offspring’s phase were to be assigned thereafter. Comparison of EMT to EMP* shows a higher error rate for EMT, which is due to allowance of recombination in the loci studied but no crossover happens when we generate the data. The discrepancies between EMT and EMP* will be smaller if all
individuals were phased accordingly with the EMP* method. For the remaining four methods, EMT gives the best result. EME performs similarly to EMA but the latter has a slightly larger variance (data not shown). The result that EMA performs similarly or even slightly better than EME may be an artifact due to overestimation of information resulted
from the sampling process. When trios are sampled, the genotype of the child tends to be similar to those of the parents and thus more weight will be given to the over-represented haplotypes among the trios when their phases are reconstructed. However, the improvement of EMT over EME turns out to be significant. This is due to the
employment of related individuals that provide more information on gamete transmissions. The patterns for the three populations are the same as similarity index, that is, African American has the largest error rate and Finnish has the smallest.
The switch accuracies are recorded in Table 3. The results are similar to the error rate.
Discussion
The well known EM algorithm (Excoffier and Slatkin 1995; Hawley and Kidd 1995; Long et al. 1995) for the ML solution of haplotype frequencies was first introduced by
Hill (1974) by extending the gene counting procedure (Ceppellini et al. 1955) to multi-locus chromosome counting. Weir and Cockerham (1979) gave analytical solutions of the EM algorithm for two-locus haplotypes. The computation intensity of the EM algorithm grows exponentially when more loci are involved and numerical results are not easy to
obtain without fast computers. The EM algorithm, while widely adopted for haplotype inferences, is suitable only for population data. In this study, we have proposed an EM algorithm for reconstruction of haplotypes from parent-offspring trios. The parent-child dependency is taken into consideration by restricting a gamete to be compatible with both
parent and child. As a comparison, the usual EM algorithm has to select only the unrelated individuals from each family or treat the samples as if they are unrelated, both being unable to appropriately incorporate all information from the samples.
In this EM algorithm, the evaluation of compatibility allows recombination to occur
when parents are forming their gametes. In our simulation study we assumed no recombination when we generate trios using the D4S10 data set. As a result, the most probable phase assignment for the offspring may indicate that a recombination event has occurred for its father or mother or both, which turns out to be an incorrect assignment.
performs better than the usual EM algorithm with an equivalent sample size of unrelated individuals.
There is no single measurement to evaluate the performance of the EM algorithm. Three different metrics, the similarity index, the haplotype reconstruction error rate and the switch accuracy are used to assess the performance of the algorithm. Overall, we found our trio EM algorithm gives the best results in frequency estimates and performs well in
phase assignment, as well. For the three different populations, African American, Finnish and Mayan, the patterns for all three measures are similar, with Finnish yielding the best results due to lowest diversity.
Although the current framework for the EM algorithm is designed for parent-child trios,
we can adopt it to more complex family structure by a similar consideration of compatibilities between a haplotype pair and an individual’s as well as its parents’ genotypes. Another direct extension will be to samples consist of both unrelated individuals and related ones, in which the usual expectation-maximization iterations are
taken over unrelated individuals whereas in each EM step, more stringent compatibility assessments are applied to individuals whose parents are also ascertained.
Several previous studies (Excoffier and Slatkin 1998; Clayton 1999; Rhode and Fuerst 2001) have also addressed the problem in estimation of haplotypes when relatives are
included in the sample. All of these methods assume no recombination and consider the combination of all parental and offspring genotypes in each family jointly. In so doing, the expectation and maximization steps are very laborious when more markers are included and/or the degree of polymorphisms increases at each marker because the
Consider an example trio where both the parents and the offspring are heterozygous at k
biallelic loci, the number of possible haplotypes is thus 2k for each of them. At each expectation and maximization step, the total combination of haplotypes that needs to be
considered for this family will be 2 *2 *4 2k k = 2k+2. In our algorithm, the parents are
treated the same way as the usual EM algorithm and compatibility assayed twice more for each offspring (with its parents) in each EM step. For the above example, the total
number of haplotypes to be traversed for this family is 2k +2k +2k =3*2k. Note that
extra evaluation steps for compatibility are required for the 2k part of the offspring, but that is not the bottleneck of the computation. Therefore, practically, the complexity remains the same as the usual EM algorithm but the sample size is inflated. Since it is the number of markers (in essence the number of possible haplotypes which grows
Acknowledgements
We thank the Kidd group in Yale University School of Medicine for publishing their data in the ALFRED data base. This research was supported in part by National Institutes of
References
ALFRED website, http://alfred.med.yale.edu/alfred/index.asp
TRANSMIT program, http://www-gene.cimr.cam.ac.uk/clayton/software
Boehnke M (1991) Allele frequency estimation from data on relatives. Am J Hum Genet 48:22-25
Ceppellini R, Siniscalco M, Smith CAB (1955) The estimation of gene frequencies in a random mating population. Ann Eugen 20:97-115
Chang F-M, Kidd K (1997) Rapid molecular haplotyping of the first exon of the human dopamine receptor D4 gene by heteroduplex analysis. Am J Med Genet 74:91-94
Clark AG (1990) Inference of haplotypes from PCR-amplified samples of diploid populations. Mol Biol Evol 7:111-122
Clark AG, Weiss KM, Nickerson DA, Taylor SL, Buchanan A, Stengard J, Salomaa V, Vartiainen E, Perola M, Boerwinkle E, Sing CF (1998) Haplotype structure and population genetic inferences from nucleotide-sequence variation in human lipoprotein lipase. Am J Hum Genet 63:595-612
Daly MJ, Rioux JD, Schaffner SF, Hudson TJ, Lander ES (2001) High-resolution haplotype structure in the human genome. Nature Genet 29:229-232
Excoffier L, Slatkin M (1995) Maximum-likelihood estimation of molecular haplotype frequencies in a diploid population. Mol Biol Evol 12:921-927
Fallin D, Cohen A, Essioux L, Chumakov I, Blumenfeld M, Cohen D, Schork NJ (2001) Genetic analysis of case/control data using estimated haplotype frequencies: application
to APOE locus variation and Alzheimer's disease. Genome Res 11:143-151
Hawley ME, Kidd KK (1995) HAPLO: a program using the EM algorithm to estimate the frequencies of multi-site haplotypes. J Heredit 86:409-411
Hill WG (1974) Estimation of linkage disequilibrium in randomly mating populations.
Heredity 33:229-239
Hodge SE, Boehnke M, Spence MA (1999) Loss of information due to ambiguous haplotyping of SNPs. Nature Genet 21:360-361
Jeffreys AJ, Kauppi L, Neumann R (2001) Intensely punctate meiotic recombination in
the class II region of the major histocompatibility complex. Nature Genet 29:217-222 Kruglyak, Daly, Reeve-Daly, Lander ES (1996) Parametric and nonparametric linkage analysis: a unified multipoint approach.Am J Hum Genet 58:1347-1363
Lin S, Cutler DJ, Zwick ME, Chakravarti A (2002) Haplotype inference in random
population samples. Am J Hum Genet 71:1129-1137
Long JC, Williams RC, Urbanek M (1995) An E-M algorithm and testing strategy for multiple-locus haplotypes. Am J Hum Genet 56:799-810
Martin ER, Lai EH, Gilbert JR, Rogala AR, Afshari AJ, Riley J, Finch KL, Stevens JF,
Michalatos-Beloin S, Tishkoff SA, Bentley KL, Kidd KK, Ruano G (1996) Molecular haplotyping of genetic markers 10 kb apart by allele-specific long-range PCR. Nucleic
Acids Res 24:4841-4843
Osier MV, Cheung KH, Kidd JR, Pakistis AJ, Miller PL, Kidd KK (2001) ALFRED: an allele frequency database for diverse populations and DNA polymorphisms-an update. Nucleic Acids Res 29:317-319
Rioux JD, Daly MJ, Silverberg MS, Kinland K, Steinhart H, Cohen Z, Delmonte T et al. (2001) Genetic variation in the 5q31 cytokine gene cluster confers susceptibility in Crohn disease. Nature Genet 29:223-228
Single RM, Meyer D, Hollenbach JA, Nelson MP, Noble JA, Erlich HA, Thomson G
(2002) Hapltoype frequency estimation in patient populations: the effect of departures from Hardy-Weinberg proportions and collapsing over a locus n the HLA region. Genet Epidemiol 22:186-195
Sobel E, Lange K (1996) Descent graphs in pedigree analysis: applications to
haplotyping, location scores, and marker-sharing statistics. Am J Hum Genet 58:1323-1337
Stephens M, Smith NJ, Donnelly P (2001) A new statistical method for haplotype reconstruction from population data. Am J Hum Genet 68:978-989
Tishkoff SA, Pakstis AJ, Ruano G, Kidd KK (2000) The accuracy of statisitical methods for estimation of haplotype frequencies: an example from the CD4 locus. Am J Hum Genet 67:518-522
Weir BS, Cockerham CC (1979) Estimation of linkage disequilibrium in randomly
Zhang S, Pakistis AJ, Kidd KK, Zhao H (2001) Comparisons of two methods for haplotype reconstruction and haplotype frequency estimation from population data. Am J
Table 3.1: Comparisons of similarity index for the five algorithms Similarity Index Population N % Missing
Genotypes EMT EMP EMP* EMA EME
25 0 .91 .79 .90 .85 .85
25 .05 .88 .76 .86 .82 .81
100 0 .96 .91 .95 .93 .92
African American
100 .05 .94 .89 .94 .92 .91 25 0 .94 .87 .93 .91 .92
25 .05 .92 .85 .91 .89 .88
100 0 .98 .94 .96 .96 .96 Finn
100 .05 .96 .93 .95 .95 .95
25 0 .92 .84 .90 .90 .88
25 .05 .89 .80 .88 .86 .86
100 0 .96 .93 .95 .95 .95
Maya
Table 3.2: Comparisons of error rate for the five algorithms
Error Rate Population N % Missing
Genotypes EMT EMP EMP* EMA EME
25 0 .090 .14 .029 .13 .14 25 .05 .15 .20 .098 .19 .19 100 0 .081 .13 .024 .13 .14 African
American
100 .05 .14 .18 .083 .17 .17 25 0 .046 .083 .015 .070 .070 25 .05 .091 .13 .058 .11 .11 100 0 .040 .066 .010 .061 .060 Finn
100 .05 .077 .10 .051 .099 .10 25 0 .082 .12 .036 .10 .11 25 .05 .14 .19 .10 .17 .18 100 0 .071 .11 .032 .11 .11 Maya
Table 3.3: Comparisons of switch accuracy for the four algorithms Switch Accuracy Population N % Missing
Genotypes EMT EMP EMP* EMA EME
25 0 .90 .84 .97 .85 .84 25 .05 .87 .81 .93 .82 .82 100 0 .90 .85 .97 .85 .84 African
American
100 .05 .88 .83 .94 .83 .83 25 0 .96 .92 .98 .93 .93 25 .05 .93 .90 .97 .91 .91 100 0 .96 .93 .99 .94 .94 Finn
100 .05 .95 .92 .97 .92 .92 25 0 .95 .92 .98 .93 .92 25 .05 .92 .89 .95 .90 .90 100 0 .95 .93 .98 .93 .93 Maya
Chapter Four
Why Loop and Balanced Block Designs are Better than
Reference Designs for Two-Color Microarray
Abstract
Experimental design is an important aspect in microarray studies and maximal efficiency can be obtained from a properly designed experiment. Traditionally a cDNA microarray
experiment uses a reference design in which the RNA samples from a variety of interest and a common reference are hybridized to the same array. Reference designs are biologically intuitive when fold-change of intensity is used to assess differentially expressed genes. Loop designs and balanced block designs have been recently proposed
as more efficient alternatives. In this study we compare the efficiency of these designs under a mixed model framework and provide general guidelines on how to use these designs in practice. The loop design analyzed in a mixed model context is shown to be superior to a reference design in terms of statistical efficiency and power as well as
Introduction
With its capability to assess the expression profiles of thousands of genes simultaneously, microarray technology has become an increasingly important tool in genetical studies
(Brown and Botstein, 1999). Microarrays have been used in a wide variety of problems such as to identify whether the gene expression profiles differ among different classes (Jin et al. 2001), to discover clusters of genes that are co-regulated (Chu et al. 1998; Eisen et al. 1998; Spellman et al. 1998), and to predict the class of new samples based
upon the similarity of their expression profiles with a precompiled multi-gene discriminant (Golub et al. 1999).
Microarray studies are factorial experiments in which several different factors contribute to the variation of the fluorescence intensities measured at each spot. These factors
should be taken into account accordingly when analyzing the data and an appropriate experimental design can maximize the information obtained from the experiment while minimizing the cost. A traditional microarray experiment applies two RNA samples labeled with different dyes, one from a treatment of interest and the other from a common
reference that serves as a baseline, to the same array on which thousands of different genes are spotted. In such a reference design, fold-change in the transcriptional level of the treatment vs. the reference is used to assess whether a gene is differentially expressed. The reference design is biologically intuitive but lacks efficiency since half observations
are from the reference that is typically of no interest. Kerr and Churchill (2001) studied experimental designs in microarrays under an ANOVA model (Kerr et al. 2000) and pointed out the reference design being inefficient and proposed a loop design as an
allowed gene-to-gene variability to be different and compared the efficiencies of different experimental designs when the purpose of the microarray experiment is to identify
differentially expressed genes or to profile genes into clusters according to their expression patterns. In spite of some efficiency loss, they recommend a reference design so some controversy still exists. This paper attempts to resolve some of the outstanding issues.
For a large number of microarray experiments, our main interest is to compare gene expression levels in v varieties and to find out which genes are differentially expressed in which varieties, aka class comparison. Replication of a microarray experiment helps obtain reliable estimates of the expression differences (Lee et al. 2000). There are
typically three levels of replication that appear in a microarray experiment (Churchill 2003). The first level is biological replication where different samples or different batches within the population of a variety are drawn. The second level is technical replication where each sample is subdivided into different aliquots and each applied to a
different array. The third level is subsampling of each gene on the same array. Each level of replication has its own variation and this variation should be taken into account appropriately in design and analysis of a microarray experiment. In this study we follow the gene-by-gene mixed model framework from Wolfinger et al. (2001) and Chu et al.