ABSTRACT
MULKEY, STEVEN EDWARD. SSR Development and Mapping of Gray Leaf Spot Resistance Genes in St. Augustinegrass. (Under the direction of Dr. Susana Milla-Lewis).
St. Augustinegrass [Stenotaphrum secundatum (Walt.) Kuntze] is a widely used turfgrass in the southern United States. Development and application of molecular tools in
the species have lagged behind other warm season grasses. The present investigation was
conducted in order to increase our understading of levels of genetic diversity and to develop
molecular tools that could facilitate selective breeding.
To assess the genetic diversity and ploidy variation present within the the University
of Florida (UF) St. Augustinegrass germplasm collection, a large pool of variation for the
species, a combination of amplified fragment length primers (AFLPs) and flow cytometry
were used. Four ploidy levels were designated based on flow cytometry results with most
accessions falling into the diploid and proximal tetraploid categories. Unweighted pair
group method with arithmetic averaging (UPGMA) cluster and principal coordinate (PCO)
analyses grouped accessions largely by ploidy level. Among diploid accessions one cluster
was identified that was unrepresented by any cultivars or plant introductions. These findings
indicate that the UF St. Augustinegrass germplasm collection contains significant, untapped
pools of diversity at diploid and polyploid levels and could be a great asset for cultivar
development.
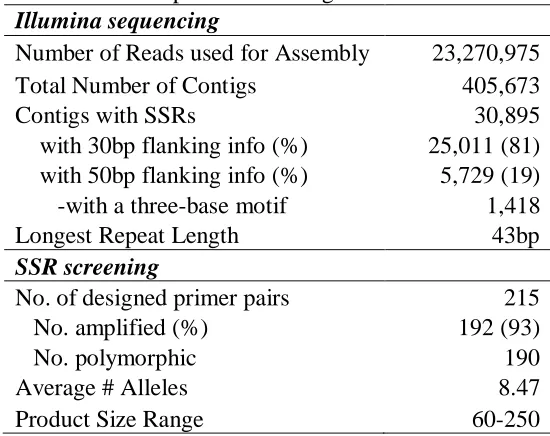
Illumina genomic sequencing data was used to develop simple sequence repeat
(SSR) markers for St. Augustinegrass. Polymorphism was observed in 190 of 215 designed
primer pairs among a panel of eight diverse germplasm accessions. Of these, 94 were
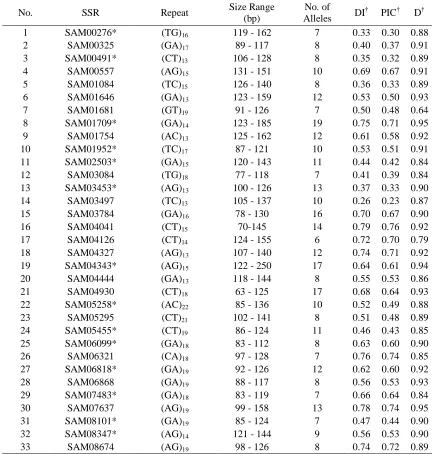
germplasm. Levels of polymorphism were high, with number of alleles amplified per loci
ranging from 5 to 23 (=10) and with polymorphic information content (PIC) values
ranging from 0.09 to 0.83 ( =0.54). Analysis of population structure identified six
subpopulations with some admixture present among them. Additionally, the ability of these
newly developed SSRs to uniquely identify specific cultivars was assessed. A set of five
primers were capable of producing unique banding patterns for all but two cultivars. These
markers, the first developed for the species, should be useful for linkage mapping, diversity
and pedigree analysis, accurate varietal identification, and marker assisted selection in St.
Augustinegrass.
Genetic linkage maps of St. Augustinegrass were constructed for quantitative trait
loci (QTL) analysis of resistance to gray leaf spot using a total of 107 AFLP fragments and
36 SSRs on a pseudo F2 population of 77 progeny. Twenty two linkage groups were
identified, covering 1216.8 cM. Ten linkage groups were ascribed to the susceptible
maternal cultivar, ‘Raleigh’, nine linkage groups to the resistant paternal accession,
PI410353, and three groups were found to be homologous. The Raleigh (67 markers) and
PI410353 (39 markers) maps covered 525.3 cM and 394.8 cM, respectively, while the
homologous linkage groups consisted of 37 markers covering 296.5 cM. The average
marker density across all groups was 8.5 cM/marker. Four putative QTL were identified
through interval and composite interval mapping. These results represent the first linkage
map produced for St. Augustinegrass, providing a template for further genetic mapping.
Additionally, markers linked to the QTL identified in this study can be used by breeders to
transfer resistance to gray leaf spot from unadapted germplasm to elite breeding lines and
© Copyright 2013 by Stephen Edward Mulkey
SSR Development and Mapping of Gray Leaf Spot Resistance Genes in St. Augustinegrass
by
Steven Edward Mulkey
A thesis submitted to the Graduate Faculty of North Carolina State University
in partial fulfillment of the requirements for the Degree of
Master of Science
Crop Science
Raleigh, North Carolina
2013
APPROVED BY:
____________________________ ____________________________
Rongda Qu, PhD Lane Tredway, PhD
____________________________ ____________________________
ii
DEDICATION
To my mom, for being the pillar of strength and steady rock I could build my life upon. To
my family and friends for all the understanding, excitement, and joy you bring to my life.
iii
BIOGRAPHY
Steve was born in 1985 and grew up in Sebastian, Florida. As a child he spent much
of his time running through the woods, building forts, avoiding alligators, and getting poison
ivy. For most of his youth Steve went to school at the Kashi Ashram, where he developed a
deep love of nature and respect for all forms of life. He also learned to accept people from
all walks of life and to help those in need.
Steve went to Cornell University for his undergraduate education, for which he is
eternally grateful. There he learned about love, life, and… Science! The knowledge and
work ethic battered into him there have proven invaluable. The friendships he acquired
there, forged through mutual struggle and shared optimism for the future, transformed his
life and continue to brighten it to this day. Steve also had the opportunity to get first hand
exposure to the wide world of plant research in the labs of Dr. Wolfe, Dr. Mohler, and Dr.
Earle. Steve spent a year following graduation learning about molecular markers and
playing with toxic chemicals in Dr. Mark Sorrells’ lab.
When he isn’t sitting in front of a computer counting ones and zeros, or pipetting
reagents into tiny tubes, Steve likes to spend his time enjoying good food, good beer, and
good friends. He enjoys home brewing, and has his sight set on some excellent hop varieties
iv
ACKNOWLEDGEMENTS
I would like to start by thanking Dr. Susana Milla-Lewis for all of the time and
resources invested in me, opportunities afforded to me, and the faith that I was worth it.
You allowed me to get my life back on track. Your strength and resolve are awe inspiring,
as is your patience with an occasionally turtle-paced graduate student.
To my committee members, Dr. Rongda Qu, Dr. Lane Tredway, and Dr. Consuelo
Arellano, thank you for your patience, insights, and technical support throughout this
process. I would also like to thank Dr. Kevin Kenworthy at the University of Florida for
providing access to the enormous St. Augustinegrass germplasm at his disposal, as well as
his input on papers; the lab of Dr. Jennifer Schaff for providing bioinformatics support; Dr.
Bangya Ma for training me in the ways of pathogenic fungi; everyone at the Phytotron for
their logistical support; and everyone who has generously donated their time to review my
papers and provide feedback.
I would like to thank two of my childhood teachers, Ramayana and Kali, for
providing an environment where my passion for math and science could flourish. Thanks to
my best friends from my Florida years, for helping to shape who I am today. Laksman,
Indra, Subhadra, Devi, Vinny, you will always be in my heart.
I’d like to give a special thanks to Dr. Mahmoud Zeid and everyone in Dr. Mark
Sorrells’ lab for turning a greenhorn plant science graduate into a quasi-competent research
v
A very special thanks to everyone in my lab, without whom I certainly would have
failed: Caro, for keeping me on track; Bessy for her help generating crosses; Esdras for
picking up all my slack; and Casey for Bojangles, Flying Saucer indulgances, and endless
hilarious movie quotes (‘Radio? Who needs a radio?!’). Jenny ‘patchouli bomb’ Kimball,
there is no way to thank you enough for your help with virtually every step of all my
projects, and keeping me sane throughout.
Finally I’d like to thank all of my family and friends for their support and patience.
You all have taken the brunt of my ‘phone-phobia’. Becca, Bo, Justin, Emily, Rebecca,
Sara, Bethany, Jason, Sarah, Glenn, and Carolyn, you’ve kept me going and made life great.
To my mom, the paragon of perseverance, I owe all that I am to you. To my brother’s,
thanks for always watching out for me and keeping me on the straight and narrow. To their
vi
TABLE OF CONTENTS
Page
LIST OF TABLES ... viii
LIST OF FIGURES ...x
CHAPTER I. Literature Review ... 01
General Overview of Turfgrass Production and Economic Importance in North Carolina ... 02
Genetics, Morphology, and Pathology of St. Augustinegrass... 05
Germplasm Characterization ... 08
Molecular Marker Development and Application in Plant Breeding ... 10
Linkage Mapping and Analysis of Quantitative Trait Loci ... 14
References ... 19
CHAPTER II. Genetic Analysis of a St. Augustinegrass Germplasm Collection Using AFLP Markers ... 35
Abstract ... 36
Introduction ... 38
Materials and Methods ... 41
Plant Materials ... 41
Flow Cytometry and Ploidy Estimation ... 42
DNA Extraction and Quantification ... 42
Amplified Fragment Length Polymorphism (AFLP) Genotyping ... 42
Genetic Data Analysis ... 43
Results ... 45
Ploidy Levels ... 45
AFLP Marker Diversity ... 45
Genetic Diversity and Population Structure ... 46
Analysis of Molecular Variance ... 48
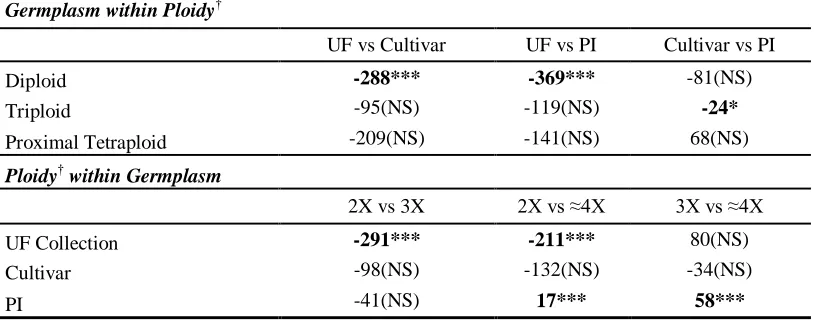
Comparison of Levels of Variation among Ploidies ... 49
Discussion ... 50
References ... 55
CHAPTER III. Development and Characterization of Simple Sequence Repeat (SSR) Markers for St. Augustinegrass [Stenotaphrum secundatum (Walt.) Kuntze] ... 71
Abstract ... 72
Introduction ... 74
Materials and Methods ... 77
vii
Genomic Sequencing and Primer Design ... 79
SSR Screening ... 79
Germplasm Characterization ... 80
Data Analysis ... 81
Results ... 82
Sequencing Results and Microsatellite Discovery ... 82
Germplasm Characterization, Cultivar Identification, and Transferability .... 82
Genetic Similarity and Population Structure ... 84
Discussion ... 87
References ... 91
CHAPTER IV. Resistance to Gray Leaf Spot in St. Augustinegrass: Characterization and QTL Mapping ... 112
Abstract ... 113
Introduction ... 115
Materials and Methods ... 118
Plant Materials ... 118
Fungal Strains and Production of Conidia ... 119
Inoculation and Phenotypic Analysis ... 119
Genotypic Analysis ... 121
Data Analysis ... 121
Linkage Mapping ... 122
QTL Analysis ... 122
Results ... 123
Phenotypic Analysis ... 123
Marker Analysis ... 124
Linkage Mapping ... 125
QTL Identification ... 126
Discussion ... 127
References ... 130
viii
LIST OF TABLES
CHAPTER II. Genetic Analysis of a St. Augustinegrass Germplasm Collection Using AFLP Markers
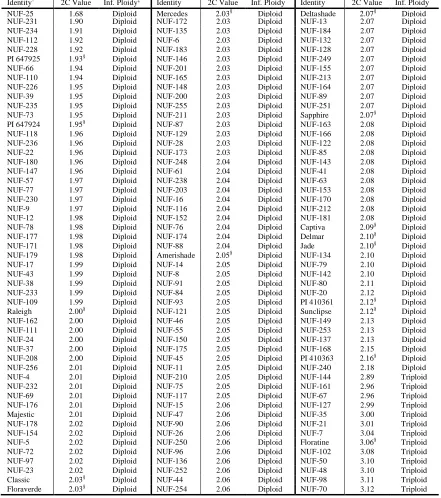
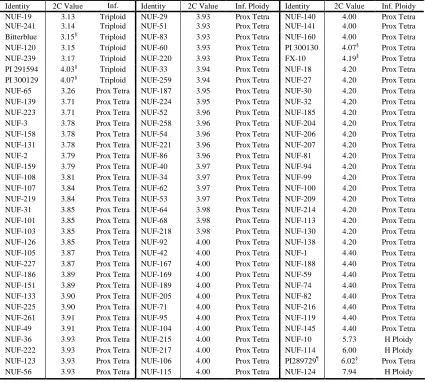
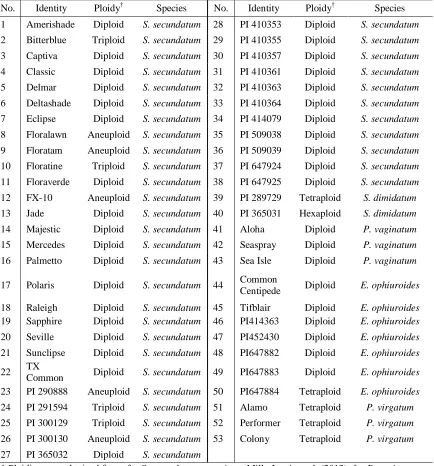
Table 2.1 List of Stenotaphrum accessions used in assessment of molecular diversity with AFLP markers organized by nuclear DNA content and inferred ploidy level based on flow cytometry. ... 62
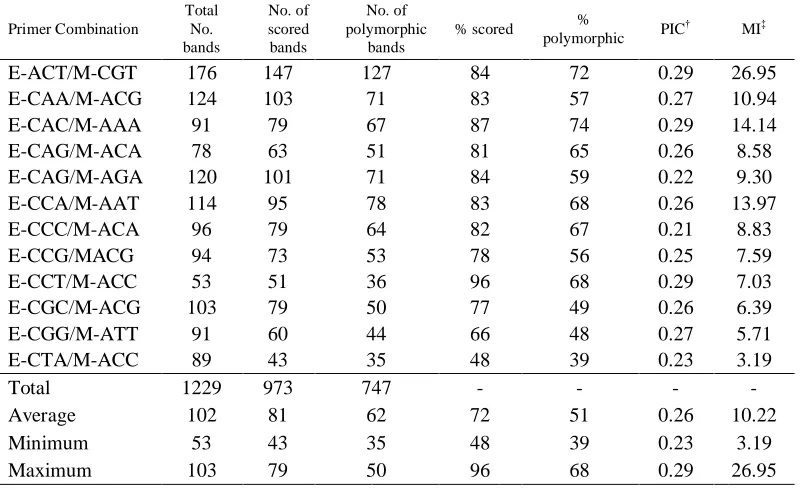
Table 2.2 Standard statistics for AFLP primer combinations used to study molecular diversity within the University of Florida St. Augustinegrass collection ... 64
Table 2.3 Average genetic similarity values (GS) within and between groups of
St. Augustinegrass materials studied for amplified fragment length polymorphism (AFLP) diversity organized according to ploidy level or germplasm type ... 65
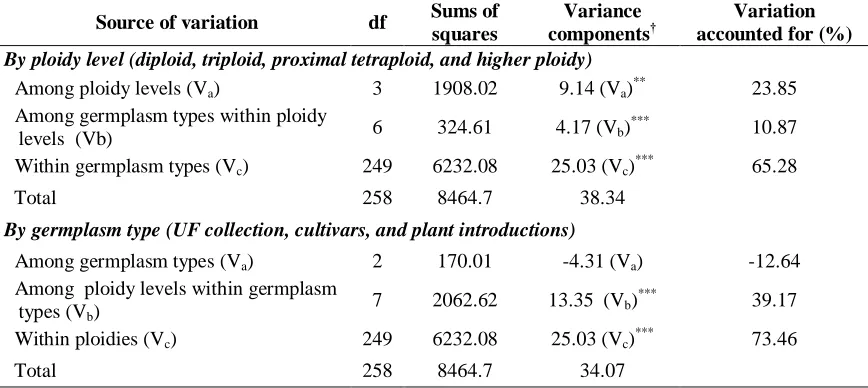
Table 2.4 Results of the analysis of molecular variance for St. Augustinegrass accessions analyzed for amplified fragment length polymorphism (AFLP) diversity grouped by ploidy level and germplasm type ... 65
Table 2.5 Pair-wise differences in allelic counts among St. Augustinegrass accessions belonging to four ploidy levels using FPTest (Fu, 2010) . 66
Table 2.6 Pair-wise differences in allelic counts among St. Augustinegrass accessions grouped by germplasm type within ploidy level and by ploidy level within germplasm type ... 66
CHAPTER III. Development and Characterization of Simple Sequence Repeat (SSR)
Markers for St. Augustinegrass [Stenotaphrum secundatum (Walt.) Kuntze]
Table 3.1 List of Stenotaphrum germplasm, including their ploidy level, used for assessing molecular diversity with simple sequence repeat (SSR) markers. Accessions of other genera tested in the present study for SSR transferability are also included. ... 102
ix
Table 3.3 Summary statistics for 94 ST Augustinegrass SSRs used to assess molecular diversity and population structure between accessions of
Stenotaphrum. Sequences for all primer pairs are provided in the Appendix section ... 104
Table 3.4 Average genetic similarity values (Sij) within and between groups of Stenotaphrum accessions based on 94 SSR markers, organized according to ploidy level or STRUCTURE-defined groups. ... 107
Table 3.5 Results of the analysis of molecular variance for Stenotaphrum
accessions based on 94 SSRs, organized according to ploidy level of STRUCTURE-defined groups. ... 107
Table 3.6 Pair-wise differences between Stenotaphrum groupings according to Fst values based on 94 SSR makers. ... 108
CHAPTER IV. Resistance to gray leaf spot in St. Augustinegrass: Characterization and QTL mapping
Table 4.1 Average values of disease incidence, mean lesion length, AUDPC, and AULEC across both experimental evaluations. ... 138
Table 4.2 Analysis of variance for AULEC and AUDPC.. ... 138
Table 4.3 List of AFLP primer combinations and SSR primer pairs producing mappable fragments across the population ... 139
x
LIST OF FIGURES
CHAPTER II. Genetic Analysis of a St. Augustinegrass Germplasm Collection Using AFLP
Markers
Figure 2.1 Unweighted pair group method with arithmetic averaging (UPGMA)
dendrogram of 258 Stenotaphrum genotypes constructed using 747 amplified fragment length polymorphism (AFLP) markers. Inferred ploidy levels are based on flow cytometry results for each sample are indicated by color in the column to the right. ... 67
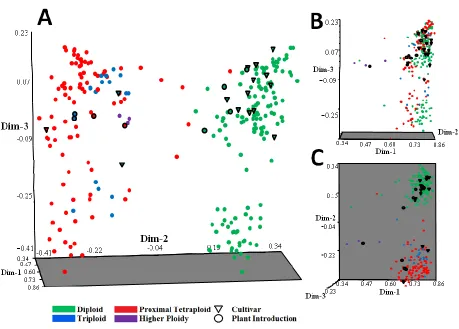
Figure 2.2 Three dimensional principal coordinate plot of 250 Stenotaphrum
accessions estimated with 747 amplified fragment length
polymorphism (AFLP) markers. a) separation of accessions across the 2nd and 3rd dimensions, b) plot rotated 90°, c) plot from overhead. .. 69 Figure 2.3 Distribution of AFLP fragment frequencies and ploidy levels in 258
Stenotaphrum accessions evaluated for genetic diversity ... 70
CHAPTER III. Development and Characterization of Simple Sequence Repeat (SSR)
Markers for St. Augustinegrass [Stenotaphrum secundatum (Walt.) Kuntze]
Figure 3.1 Polyacrylamide gel image of Stenotaphrum genotypes amplified using SSR marker SAM28482. This primer amplified a total of 16 alleles and had the highest discriminatory power (D=0.97). As observed on the picture, nine cultivars (indicated with arrows) produced unique banding patterns ... 109
Figure 3.2 Genetic analysis of 40 Stenotaphrum accessions based on 94 SSR markers. a) UPGMA cluster analysis with bootstrapping. Bars on the right indicate cluster number. Dotted line denotes genetic similarity at which clusters were called. b) Principal coordinate (PCO) plot of 40
Stenotaphrum genotypes for the first three principal coordinates estimated with 982 SSR alleles. Colors correspond to STRUCTURE groupings and shapes to ploidy levels. c) Separation of Stenotaphrum
xi
CHAPTER IV. Resistance to gray leaf spot in St. Augustinegrass: Characterization and QTL mapping
Figure 4.1 Histograms showing the population distribution for each of the four measured parameters: day seven disease incidence, day seven mean lesion length, area under the disease pressure curve (AUDPC), and area under the lesion expansion curve (AULEC). Blue and red lines indicate average values for the resistant (PI410353) and susceptible (Raleigh) parents. For day seven disease incidence and mean lesion length, values used were the average across all reps and runs. LS means calculated with SAS were used for AUDPC and AULEC. A square root transformation was applied to the AULEC data. ... 140
Figure 4.2 A genetic linkage map of the female parent (R: Raleigh), male parent (P: PI 410353), and homologous linkage groups (R/P) generated from 77 pseudo F2 progeny. Numbers on the left indicate genetic distances in centiMorgans (cM) calculated using the Kosambi function. Numbers on the right indicate marker names. Markers underlined and in red indicate correlation with putative quantitative trait loci. . ... 141
1
-CHAPTER I-
2
General Overview of Turfgrass Production and Economic Importance in North
Carolina
Throughout history humans have sought to change the world around them, adapting
the environment to meet their needs while selectively breeding plants and animals to
increase their utility and productivity. Beyond this we have purposely molded nature,
making trusting companions and sculpting plants and landscapes to fulfill emotional and
spiritual needs. To this end turfgrasses have been developed and cultivated across the globe,
with just a handful of species chosen for their ability to thrive despite the extreme stresses
(abiotic and biotic) found in recreational areas.
In this process, two primary groups of turfgrasses have arisen based on the climates
in which they were domesticated. Cool-season turfgrasses are long-day plants belonging to
the Pooideae subfamily of grasses (Poaceae). They typically use C3 carbon fixation for
photosynthesis and grow most vigorously during spring and fall. Examples include
bentgrasses (Agrostis spp.), bluegrasses (Poa spp.), ryegrasses (Lollium spp.), and fescues (Festuca spp.). Warm-season turfgrasses are generally short-day or day-neutral and grow aggressively during late-spring and summer. They are found largely in the Chloridoideae
and Panicoideae subfamilies and utilize C4 photosynthesis. Examples include bermudagrass
3
In the United States, cool-season turfgrasses are widely used in the cool northern
latitudes to which they are adapted, ranging from the Northeast to the Pacific Northwest.
Conversely, warm-season grasses do well in the hotter climates of the South, spanning from
Florida to California. In between these two extremes lies the transition zone, an area with
highly variable seasons ranging from cold bitter winters to hot, dry summers. This region,
spanning from North Carolina and Virginia into the Midwest, poses a unique challenge for
turf. While both cool- and warm-season turf types can be grown in the transition zone,
neither is ideally adapted.
Warm-season lawns are generally established through sprigging and sod. These
grasses are readily propagated through rhizomes and stolons, allowing them to more
effectively compete against weeds and recover from damage in high traffic areas.
Unfortunately, warm-season grasses have little cold or freezing tolerance and go dormant in
the winter, a feature that many growers find undesirable. Most cool-season grasses are
propagated through seed, providing a more economical method for lawn establishment than
sod. These grasses can produce lush stands of high quality, fine textured turf, but struggle
with heat and drought stress in the summer. This can lead to thin, patchy turf without a high
level of maintenance. A common method to overcome these difficulties is to overseed
warm-season turf with cool-season grasses annually in the fall, thus taking advantage of the
strength of both seasonal types for a lush turf year-round.
The production and maintenance of turf is an important industry for North Carolina.
4
million acres of turf (North Carolina Dept. of Agriculture and Consumer Services, 1999).
An additional $700 million was spent on renting or procurement of the equipment used for
turf maintenance. With a population growth of over 20% in the last decade (based on
2001-2011 population census data, North Carolina Office of State Budget and Management) these
numbers can be expected to have increased significantly. Single family homes accounted for
a vast majority of North Carolina land devoted to turf at 1.47 million acres, followed by
roadsides and commercial properties at 0.35 and 0.12 million acres, respectively (North
Carolina Dept. of Agriculture and Consumer Services, 1999). Golf courses, schools,
churches, airports, parks, cemeteries, and other institutions composed the remainder.
Similarly, single family homes, commercial properties, and golf courses spent the most on
turf maintenance.
The most commonly used species overall were Kentucky 31 tall fescue (36.1%),
centipedegrass (16.3%), bermudagrass (10.8%), bluegrass/fescue mix (7%), tall fescue (4.7),
and bahiagrass (4.3). Ryegrass, zoysiagrass, and St. Augustinegrass together made up an
additional four percent. Despite these overall usage rates, the actual topography of turfgrass
usage varied depending on the sector analyzed, reflecting the ability of different turfgrasses
to meet a variety of needs. For example, Kentucky 31 is among the most drought tolerant
cool-season grasses (Huang and Gao, 1999), providing homeowners and commercial sites
with a balance between turf quality and ease of maintenance. The ability of bermudagrass to
maintain quality under high traffic made it the preferred turfgrass for golf courses and
5
and in parks and cemeteries, reflecting their hardiness and low maintenance requirements.
Other grasses are used in specific contexts, such seashore paspalum (Paspalum vaginatum
Swartz) or St. Augustinegrass, which are known for their high salinity and shade tolerances,
respectively.
Genetics, Morphology, and Pathology of St. Augustinegrass
St. Augustinegrass is a widely used warm season turfgrass known for its tolerance to
weed infestation (Busey, 2003; Long and Bashaw, 1961) and shade (Busey, 1995; Peacock
and Dudeck, 1993). The species is characterized by broad leaves and rapid stoloniferous
growth, producing lush stands on a wide range of soil types (Busey et al., 1982). Its
adaptation to tropical and subtropical climates makes it a preferred turfgrass for home lawns
and commercial landscapes throughout the Southern U.S. In Florida, St. Augustinegrass sod
production expanded from 3,100 hectares in 1974 (Florida Department of Agriculture and
Consumer Services, 1976) to over 52,000 acres in 2007 (Hodges and Stevens, 2010),
accounting for the majority of sod produced in the state. While its usage is more limited in
North Carolina, the versatility and potential for breeder-driven improvement of St.
Augustinegrass ensures its continued importance in the turf profile of the state.
The genus consists of seven species indigenous to coastal areas along East Africa,
6
found on all continents excluding Antarctica, though its exact origin is not known (Busey,
2003). The most plausible explanation may be a pre-colonial era transoceanic dispersal
originating from Indian Ocean coastal areas, as multiple naturalized and divergent
populations of St. Augustinegrass have been found in the Caribbean, the Southern U.S., and
elsewhere. St. Augustinegrass does show some level of interspecific hybridization, and it is
believed that the cultivar FX-10 arose from a cross between S. secundatum and S. dimidiatum (Busey, 1993).
Morphologically, accessions of St. Augustinegrass have been clustered into ‘demes’
(Sauer, 1972) or ‘groups’ and ‘races’ based on floral features such as spikelet length and
number or stigma color (Busey et al., 1982, Busey, 1986). These clusters are largely
parsimonious with geographic distribution, and have also been shown to correspond well
with ploidy (Busey, 1995; Green et al., 1981). Polyploidy is common within Stenotaphrum
germplasm. Triploids, tetraploids, and aneuploids have all been described (Busey, 1993;
Milla-Lewis et al., 2013; Sauer, 1972), and it has been proposed that multiple instances of
auto- and/or allo-polyploidy have led to the genetic diversity in the genus (Busey, 2003).
St. Augustinegrass is susceptible to a number of pests and diseases. One of the most
important insect pathogens of St. Augustinegrass is the southern chinch bug [Blissus insularis Barbar]. Excessive feeding by nymphs can weaken and damage plants (Baker, 1982). During peak summer months this can be exacerbated due to drought stress, resulting
in the death of large patches of turf. Fungal diseases of St. Augustinegrass include dollar
7
[Magnaporthe grisea (T.T. Hebert) Yaegashi & Ugadawa]. Under ideal conditions these pathogens can potentially devastate large swaths of turf.
Magnaporthe is a common pathogen throughout the grass family, causing blast disease in rice, wheat, and barley, as well gray leaf spot in tall fescue and ryegrass. Because
of its widespread prevalence in important food crops, the disease has been widely
researched as a model for host-pathogen interactions in rice (Liu et al., 2010). Consequently
many resistance genes have been identified in this species (Yang et al., 2009). In addition to
these single genes which typically confer complete but race specific resistance, QTL
conferring partial resistance have been identified in rice (Fukuoka and Okuno, 2001; Xu et
al., 2008), ryegrass (Curley et al., 2005), and barley (Sato et al., 2001).
Control of GLS in most crops relies on the use of fungicides, making management of
this disease costly and difficult for St. Augustinegrass in most home lawn and public use
settings. Active breeding efforts in rice have managed to produce varieties with durable
resistance (Skamniotie and Gurr, 2009; Wang et al., 1994). Incorporation of host resistance
into planted cultivars would present an ideal alternative for the management of GLS is St.
Augustinegrass. Specifically, the incorporation of quantitative trait loci, which are
commonly associated with durable modes of resistance (Boyd, 2006; Kou and Wang, 2010),
would present an ideal alternative to reliance upon fungicide for control of the disease.
A significant amount of variation has been observed for a number of important traits
8
gray leaf spot, and other diseases (Atilano and Busey, 1983; Flor et al., 2010; Reinert and
Dudeck, 1974). ‘Raleigh’ is considered the most cold tolerant of St. Augustinegrass
accessions, and ‘Seville’ displays a lower growth habit and good tolerance to shade.
Unfortunately, much of the disease resistance that has been observed is located within
polyploid germplasm. This presents a problem for breeders as many commonly used
varieties are diploid and cannot be readily crossed with polyploid material. Despite these
obstacles, a number of cultivars have been released. Polyploids such as ‘Bitterblue’ and
‘Floratam’ were released for their finer leaf texture and resistance to chinch bugs,
respectively.
Germplasm Characterization
Though progress has been made in identifying morphological variation within
subsets of St. Augustinegrass germplasm, our understanding of levels of genetic variation in
the overall genus remains limited. Furthermore, only a handful of accessions are publicly
available in the USDA’s National Plant Germplasm System. While The University of
Florida maintains the largest St. Augustinegrass germplasm collection in the U.S., many of
the accessions remain uncharacterized. This germplasm represents an enormous asset for
breeders as a reservoir for novel traits and disease resistance genes. In order to make use of
such a resource, breeders must first understand the extent of variation available and where
9
to generate worthy genetic combinations for improvement of traits of interest such as
disease resistance and abiotic stresses alongside turf quality traits.
Germplasm characterization within turfgrasses has generally focused on
inflorescence characteristics (Hanna and Burton, 1978; Liu et al., 2003) and traits
corresponding to turf quality, such as leaf width and density, internode length, color, spring
green-up, etc. (Anderson, 2000; Murphy et al., 1997; Taliaferro, 1995). Susceptibility to
disease and abiotic stresses (Bertrand et al., 2009; Huang and Gao, 1999) can also be
included in this regard as sick and damaged turf is usually rated poorly for quality.
However, morphological analysis provides only a broad picture of the diversity within a
germplasm, and cannot always provide an accurate understanding of the underlying genetic
variability (Mba and Tohme, 2005). Some morphological traits can be difficult or time
consuming to accurately measure and can vary over time and with different environmental
conditions. Additionally, closely related accessions often cannot be distinguished from each
other using morphological observations alone. Such problems have been observed in
zoysiagrass, where continuous variation in a number of traits made separation of accessions
into distinct species difficult (Kimball et al., 2012; Patton and Reicher, 2007).
These problems can be overcome with the use of DNA-based molecular markers,
which are insensitive to environmental influences. Additionally, molecular markers can
generally identify polymorphism between even closely related accessions. Molecular
10
reproducibility, ease of assay, and ability to reliably detect high resolution genotypic
variability (Arif et al., 2010; Kalia et al., 2011).
Molecular Marker Development and Applications in Plant Breeding
A number of DNA-based molecular marker systems have been applied towards the
plant sciences, including Restriction Fragment Length Polymorphisms (RFPLs) (Saiki et al.,
1985), Randomly Amplified Polymorphic DNA (RAPDs) (Williams et al., 1990), Amplified
Fragment Length Polymorphisms (AFLPs) (Vos et al., 1995), Simple Sequence Repeats
(SSRs) (Jacob et al., 1991), and Single Nucleotide Polymorphisms (SNPs). Molecular
markers can be used to uniquely identify cultivars, assess levels of relatedness between
various individuals, and analyze diversity within a germplasm pool. Additionally, analysis
of segregation patterns of markers between related progeny can facilitate the construction of
linkage maps, which, when combined with phenotypic data, can allow genes controlling
important traits to be mapped. Markers closely linked to these traits can be utilized by
breeders in marker assisted selection (MAS) to select progeny carrying genes of interest.
Each marker system has its own advantages and weakness, making some better suited for
certain tasks than others.
The earliest of these marker systems to receive widespread attention was RFLPs,
which were important in developing the first DNA-based linkage maps for many crops,
11
location of genes for numerous traits of interest (Louie et al., 1991; Ottaviano et al., 1991;
Wang et al., 1994). Among turfgrasses, RFLPs have been used to analyze diversity in
perennial ryegrass (Charmet et al., 1997), tall fescue (Busti et al., 2004), and zoysiagrass
(Yaneshita et al, 1997). Early protocols for RFLPs required digestion of DNA fragments
with restriction endonucleases, separation of the bands by size, and eventually visualization
using X-rays. Because of the large amount of DNA required, relative difficulty of the
process, and issues with reproducibility, RFLPs were rapidly replaced when polymerase
chain reaction (PCR)-based marker systems were developed. In addition to requiring less
DNA, PCR-based systems can incorporate fluorescently labeled primers for automation.
Some techniques have been developed to combine the advantages of PCR with RFLPs
(CAPS: Konieczny and Ausubel, 1993; TRFLP: Liu et al., 1997), but application of these
systems has largely been limited to certain contexts.
RAPDs make use of short, non-specific primers to amplify random fragments.
Similar to RFLPs, variations at or between primer sites lead to different banding profiles
between individuals when using the same ‘random’ primers (Powell et al., 1996). The key
advantage of this system is that no prior sequence information of the species being assayed
is needed, making it especially useful for species with limited genetic resources. RAPDs
have been used to some extent in turfgrasses for cultivar identification (Wu and Lin, 1994)
and diversity studies (Al-Humaid and Motawei, 2004; Curley and Jung, 2004). Because of
issues with reproducibility this system was later replaced by AFLPs (Mba and Tohme,
12
AFLPs make use of a combination of digestion by restriction enzymes with rare and
common recognition sites, followed by ligation with adapters to allow for primer binding
and PCR amplification. As with RAPDs, AFLPs do not require a priori sequence information. Additionally, AFLPs commonly show a high degree of polymorphism and are
highly reproducible, making them very useful for germplasm characterization (Meudt and
Clark, 2007; Mueller and Wolfebarger 1999). Unfortunately both RAPDs and AFLPs are
dominant marker systems and cannot readily distinguish between homozygosity and
heterozygosity at a locus, resulting in some limitations for phylogenic and linkage analysis.
Additionally, the occurrence of homoplasy, in which two or more loci produce fragments of
the same size, can increase error rates and confound results. Despite this, AFLPs have been
used extensively among turfgrasses for germplasm characterization and linkage mapping.
Even among warm-season grasses, which lag behind in DNA marker development and
application, examples can be seen in bermudagrass (Anderson et al., 2009; Wu et al., 2006),
carpetgrass (Wang et al., 2010), St. Augustinegrass (Milla-Lewis et al., 2013), and
zoysiagrass (Cai et al., 2004; Kimball et al., 2012),
Simple sequence repeats (also known as microsatellites) are composed of tandemly
recurring nucleotide patterns of one to six base pairs long which are repeated as many as
100 times. Primers roughly 20-25 base pairs long are designed to flank these regions and
polymorphism within and between accessions arise as a result of differences in the number
of repeats. Compared to other molecular markers, SSRs show high rates of mutation per
13
Gemmell, 2006). This mutation rate appears to be controlled by the complex interaction of
a number of factors including slippage during replication, mismatch repair mechanisms,
recombination during meiosis, point mutations, and retrotransposition (Ellegren, 2002; Kalia
et al, 2011; Li et al, 2002; Temnykh, 2001; Wang et al, 2009;). Generally it has been
observed that higher mutation rates are associated with longer microsatellites (Kruglyak et
al, 1998) resulting in greater levels of polymorphism.
Traditionally, flanking sequence information needed to design primers for new SSRs
has been obtained by isolating genomic DNA and subsequently screening thousands of
clones through hybridization with SSR-containing probes (Kalia et al, 2011). This process
can be extremely inefficient and labor intensive, leading some to develop new techniques
for microsatellite discovery and characterization. Next generation sequencing (NGS;
alternatively, ‘second generation sequencing’) platforms such as the Roche 454 or
Illumina’s Genome Analyzer IIx allow for whole genomes to be cheaply sequenced directly
from isolated genomic DNA, eliminating the need to transform and sequence numerous
libraries. These platforms are capable of producing up to 1.2 and 100 million reads,
respectively, in a matter of days (Zalapa et al., 2012) through a process known as
‘sequencing by synthesis’ (reviewed in: Mardis, 2008; Varshney et al., 2009). Next
generation sequencing technology is increasingly being applied towards de novo sequencing (Garg et al., 2011; Hyten et al., 2008; Jun et al., 2011) and microsatellite isolation (Lu et al.,
14
As a marker system, SSRs are highly polymorphic, reproducible, easy to use,
codominant, and evenly distributed in most genomes (Kalia et al., 2011) making them ideal
for cultivar identification, analysis of germplasm diversity, linkage mapping, and
quantitative trait loci (QTL) discovery (Powell et al., 1996). In turfgrasses, SSRs have been
recently used in the construction of linkage maps and QTL analysis for bermudagrass
(Harris-Schultz et al., 2010), creeping bentgrass (Rotter et al., 2009) perennial ryegrass
(Jones et al., 2002; Yamada et al., 2004), and zoysiagrass (Cai et al., 2005; Li et al., 2009).
Microsatellites have also been used in turfgrass for germplasm characterization (Liu et al.,
1995; Tsuruta et al., 2005; Wang et al., 2010b), comparative genomics (Saha et al., 2006;
Sim et al., 2009; Wang et al., 2006), and cultivar identification (Jones et al., 2001; Wang et
al., 2010c).
Single nucleotide polymorphisms (SNPs) have gained significant attention recently
in light of advances in NGS technology. Based on single nucleotide changes (insertions,
deletions, substitutions) in DNA sequence between two individuals, these markers are
codominant, highly amenable to automation, and extremely abundant throughout all
genomes (Vignal et al., 2002). Taking advantage of their abundance and automation,
however, requires significant genetic resources (i.e. genome sequence) for the species being
assayed, and consequently applications of this technology have largely been limited to
model species and major crops (Varshney et al., 2009).
15
Linkage mapping is a tool that has been used by geneticists for roughly a century to
understand gene organization within different organisms and identify associations between
various traits. The basic concept of linkage mapping is that segregation patterns for various
traits among related individuals with known pedigree can be analyzed to determine where
the genes controlling them are located in relation to each other within an organism’s genome
(Laird and Lange, 2011). In addition to purely academic pursuits, linkage mapping can be
applied towards the identification of markers closely linked to important traits such as
disease resistance or yield (Collard et al., 2005). These, in turn, can be used in MAS by
breeders to expedite breeding programs.
Early in the process of linkage mapping researchers relied upon morphological
markers such as flower color, wing shape, etc. The advent of molecular genetic markers
greatly improved this process, allowing researchers to readily assay numerous individuals
and with greater numbers of markers (Young, 2000). Genetic markers have the added
benefits of being free from environmental interactions and widely distributed throughout
most genomes. Because of advances in marker technology, linkage mapping has become
one of the most ubiquitous aspects of genetic research and a key part of most crop
improvement programs. A similar approach, association mapping, has become popular
recently due to its ability to locate target genes and QTL with greater accuracy and
sensitivity (Laird and Lange, 2011). However, association mapping requires much larger
16
SNPs have made this possible for some crops, linkage mapping will remain the focus for
most.
The first consideration for developing a linkage map is the mapping population. A
number of schemes have been developed in plants, including F2, backcross, and
recombinant inbred lines (RILs) (Young, 2000). These populations are created by crossing
two inbred parents and then selfing the progeny for one or more generations. Though they
take more time and effort to produce, for most crops RILs make ideal populations as F2s and
early backcrosses cannot be maintained over time (Zhang, 2012). Many turfgrasses can be
maintained perennially through clonal propagation, providing a unique advantage for F2
populations. Unfortunately, many forage and turfgrass species are naturally outcrossing,
making the creation of inbred parental lines difficult. The creation of a ‘pseudo testcross’ or
‘pseudo F2’ population to overcome this problem has been discussed (Alves et al., 2010;
Jansen, 2005; Lu et al., 2004; Maleipaard et al., 1997; Wu et al., 1992). These populations
take advantage of the highly heterozygous nature of outcrossing species by examining
segregation patterns within the F1 generation. To accomplish this, markers that are
heterozygous in at least one parent and share a maximum of one allele with the other can be
selected for analysis among the progeny. This method has been used in a wide range of
crops, including oil palm (Billotte et al., 2010), apple (Maleipaard et al., 1998), cassava
(Okagbenin et al., 2008), and perennial ryegrass (Jones et al., 2002).
After a suitable mapping population has been developed and characterized, a linkage
17
somewhat dependent on the number of markers used, population size, and computing power
available (Young, 2000). Because earlier mapping populations were smaller and fewer
markers were used, a two-point analysis was commonly used. In this method the
recombination frequencies for each pair of markers are tested directly with a chi-square test.
This process can become cumbersome as more markers and progeny are analyzed, leading
to the development of multi-point analysis. Most linkage mapping programs utilize this
method, which uses a logarithm of odds (LOD) score to test marker order (Laird and Lange,
2011). Additionally, programs such as Mapmaker (Lander et al., 1987) and JoinMap (van
Ooijen and Voorrips, 2001) have developed algorithms and procedures to create primary
marker groupings and accelerate the mapping process. Following this, the map distance is
calculated. Several mapping functions have been developed to convert recombination
frequencies into centiMorgans (cM) (Mather, 1938; Morgan, 1928; Haldane, 1919;
Kosambi, 1994), all of which yield similar results when markers are reasonably close to
each other and recombination frequencies are low.
Once a linkage map has been assembled, it can be compared against phenotypic data
for a trait of interest. Similarly to linkage mapping, earlier research used single marker
analysis where t-tests, analysis of variance (ANOVA), or linear regression were used to test
for linkage between a marker and the trait (Collard et al., 2005). Newer methods, such as
composite interval mapping (CIM) use hypothetical locations (‘intervals’) between markers
18
or QTL. These functions are commonly employed in QTL analysis software such as QTL
Cartographer (Basten et al., 2001), MapManager QTX (Manly et al., 2001), and others.
Discovery of QTL can be confounded by a number of factors (Asins, 2002; Collard
et al., 2005). A small mapping population means fewer recombination events to compare
against, creating error in linkage mapping and possibly producing artificial associations
between markers unlinked to putative QTL. A lack of marker density can lead to
underestimation of the number of QTL involved and an overestimation of their effect.
Genotyping errors and missing data can lead to false marker assignment (Hackett, 2002).
Finally, estimation of QTL can be susceptible to environmental influences, either inflating
the signal or dampening it (Lindhout, 2002; Paterson et al., 1991)
The application of molecular markers towards linkage mapping and QTL analysis
for turfgrasses has been gaining ground in recent years. The majority of studies have
focused on cool season grasses such as colonial bentgrass (Rotter et al., 2009), perennial
ryegrass (Jones et al., 2002), and tall fescue (Saha et al., 2005), but warm season grasses are
beginning to receive attention as well (Karaca et al., 2002; Cai et al., 2005). To date few
turfgrass breeding programs have made use of such work for marker assisted selection
(Roldan-Ruiz and Kolliker, 2010). Continued development of NGS technologies, dropping
sequencing costs, and sustained marker development are likely to turn this around in the
19
REFERENCES
Al-Humaid, A. and M. Motawei. 2004. Molecular characterization of some turfgrass
cultivars using randomly amplified polymorphic DNA (RAPD) markers. Journal of
food, agriculture, and environment. 2:376-380.
Alves, A.A., L.L. Bhering, C.D. Cruz, and A.C. Alfenas. 2010. Linkage analysis between
dominant and codominant markers in full-sib families of out-breeding species. Genet.
Mol. Biol. 33:499-506.
Anderson, S. 2000. Taxonomy of Zoysia (Poaceae): Morphological and Molecular
Variation. Ph.D. dissertation. Texas A & M University, College Station, TX.
Arif, I.A., M.A. Bakir, H.A. Khan, A.H. Al Farhan, A.A. Al Homaidan, A.H. Bahkali, M.
Al Sadoon, and M. Shobrak. 2010. A brief review of molecular techniques to assess
plant diversity. Int. J. Mol. Sci. 11:2079-2096.
Asins, M., 2002. Present and future of quantitative trait locus analysis in plant breeding.
Plant Breed 121: 281–291.
Atilano, R.A., and P. Busey. 1983. Susceptibility of St. Augustinegrass germplasm to
Pyricularia grisea. Plant Disease 67(7):782-783.
Baker, J.R. 1982. Insects and other Pests Associated with Turf. AG-268. NC Agr. Ext. Serv.
Raleigh.
Basten, C., B. Weir, Z.-B. Zeng, 2001. QTL Cartographer. Department of Statistics, North
20
Bertrand, A., Y. Castonguay, J. Cloutier, L. Couture, T. Hsiang, J. Dionne, and S. Laberge.
2009. Genetic diversity for pink snow mold resistance in greens-type annual bluegrass.
Crop Sci. 49:589-599.
Billotte, N., M.F. Jourjon, N. Marseillac, A. Berger, A. Flori, H. Asmady, B. Adon, R.
Singh, B. Nouy, F. Potier, S.C. Cheah, W. Rohde, E. Ritter, B. Courtois, A. Charrier, B.
Mangin.2010. QTL detection by multi-parent linkage mapping in oil palm (Elaeis guineensis Jacq.). Theor. Appl. Genet. 120-1673-1687.
Boyd, L. 2006. Can the durability of resistance be predicted? J. Sci. Food. Agric.
86:2523-2526.
Buschiazzo, E., and N.J. Gemmell. 2006. The rise, fall, and renaissance of microsatellites in
eukaryotic genomes. BioEssays 28:1040-1050.
Busey, P. 1986. Morphological identification of St. Augustinegrass cultivars. Crop Sci.
26:28-32.
Busey, P., R. M. Giblin-Davis, and B. J. Center. 1993. Resistance in Stenotaphrum to the sting nematode. Crop Sci. 33:1066-1070.
Busey, P. 1995. Genetic diversity and vulnerability of St. Augustinegrass. Crop Sci.
35:322-327.
Busey, P. 2003. St. Augustinegrass, Stenotaphrum secundatum (Walt.) Kuntze pp 309-329 In: M.D. Casler and R.R. Duncan, Turfgrass Biology, Genetics, and Breeding, John
21
Busey, P., R. M. Giblin-Davis, and B. J. Center. 1993. Resistance in Stenotaphrum to the sting nematode. Crop Sci. 33:1066-1070.
Busey, P., T.K. Broschat, and B.J. Center. 1982. Classification of St. Augustinegrass. Crop
Sci. 22:469-473.
Busti, A., M. Caceres, O. Calderini, S. Arcioni, and F. Pupilli. 2004. RFLP markers for
cultivar identification in tall fescue (Festuca arundinacea Schreb.). Gen. Res. and Crop
Eva. 51:443-448.
Cai, H.W., M. Inoue, N. Yuyama, and S. Nakayama. 2004. An AFLP-based linkage map of
zoysiagrass (Zoysia japonica). Plant Breed 123:543–548.
Cai, H.W., M. Inoue, N. Yuyama, W. Takahashi, M. Hirata, and T. Sasaki. 2005. Isolation,
characterization, and mapping of simple sequence repeat markers in zoysiagrass
(Zoysia spp.) Theor Appl Genet 112:158–166.
Charmet, G., C. Ravel, and F. Balfourier. 1997. Phylogenetic analysis in the Festuca-Lolium
complex using molecular markers and ITS rDNA. Theor Appl Genet 94:1038.
Collard, B.C.Y., M.Z.Z. Jahufer, J.B. Brouwer, and E.C.K Pang. 2005. An introduction to
markers, quantitative trait loci (QTL) mapping and marker-assisted selection for crop
improvement the basic concepts. Euphytica 142:169-196.
Curley, J. and G. Jung. 2004. RAPD-based genetic relationships in Kentuckey bluegrass:
comparison of cultivars, interspecific hybrids and plant introductions. Crop Science
22
Curly, J., S. C. Sim, S. Warnke, S. Leong, R. Barker, and G. Jung. 2005. QTL mapping of
resistance to gray leaf spot in ryegrass. Theor. Appl. Genet. 111:1107-1117.
Ellegren, H. 2002. Microsatellite evolution: a battle between replication slippage and point
mutation. Trends Genet 18:70
Florida Department of Agriculture and Consumer Services. 1976. Florida Turfgrass Survey
1974. Florida Dep. Agr. Consumer Serv., Florida Crop Livestock Rep. Serv., Orlando.
Flor, N.C., P.F. Harmon, L.E. Datnoff, and R.N. Raid. 2010. Screening of St.
Augustinegrass (Stenotaphrum secundatum) germplasm for brown patch and large patch resistance. Phytopathology 100:S36.
Fukuoka, S., and K. Okuno. 2001. QTL analysis and mapping of pi21, a recessive gene for field resistance to rice blast in Japanese upland rice. Theor. Appl. Genet. 103:185-190.
Garg R., R.K. Patel, A.K. Tyagi, and M. Jain. 2011. De novo assembly of chikpea transcriptome using short reads for gene discovery and marker identification. DNA
Research 18: 53-63.
Green, R.L., A.E. Dudeck, L.C. Hannah, and R.L. Smith. 1981. Isoenzyme polymorphism in
St. Augustinegrass, Stenotaphrum secundatum. Crop Sci. 21:778-782.
Hackett, C., 2002. Statistical methods for QTL mapping in cereals. Plant Mol Biol 48: 585–
599.
Haldane, J.B.S. 1919. The combination of linkage values and the calculation of distances
23
Hanna, W. and G. Burton. 1978. Cytology, reproductive behavior and fertility
characteristics of centipedegrass. Crop Sci. 18:835-837.
Harris-Schultz, K., B. Schwartz, W. Hanna, and J. Brady. 2010. Development, linkage
mapping, and use of microsatellites in Bermudagrass. J Amer Soc Hort Sci
135(6):511-520.
Helentjaris, T. 1987. A genetic linkage map for maize based on RFLP’s. Trends Genet.
3:217-221.
Hodges, A., and J. Stevens. 2010. Economic Contributions of the Turfgrass Industry in
Florida. University of Florida, Institute of Food and Agricultural Sciences, Food and
Resource Economics Department. Gainesville, FL.
Huang, B., and H. Gao. 1999. Physiological responses of diverse tall fescue cultivars to
drought stress. HortScience 34:897–901.
Hyten D.L., Q. Song, I. Choi, M. Yoon, J.E. Specht, L.K. Matukumalli, R.L. Nelson, R.C.
Shoemaker, N.D. Yound, and P.B. Cregan. 2008. High-throughput genotyping with the
GoldenGate assay in the complex genome of soybean. Theor Appl Genet 116: 945-952.
Jacob, H., K. Lindpaintnesr, E. Kusumir, K. Bunkery, I. Mao, D. Gantenv, J. Dzau, and E.
Lander. 1991. Genetic mapping of a gene causing hypertension in the stroke-prone
spontaneously hypertensive rat. Cell 67:213-224.
Jansen, J. 2005. Construction of linkage maps in full-sib families of diploid outbreeding
species by minimizing the number of recombinations in hidden inheritance vectors.
24
Jones, E., M. Dupal, R. Kölliker, M. Drayton, and J. Forster. 2001. Development and
characterization of simple sequence repeat (SSR) markers for perennial ryegrass
(Lolium perenne L.). Theor Appl Genet 102:405-415.
Jones, E., M. Dupal, J. Dumsday, L. Hughes, and J. Forester. 2002. An SSR-based genetic
linkage map for perennial ryegrass (Lolium perenne L.). Theor Appl Genet 105:577-584.
Jun T, A.P. Michel, and M.A. Mian. 2011. Development of soybean aphid genomic SSR
markers using next generation sequencing. Genome 54:360-367.
Kalia, R.K., M. Rai, S. Kalia, R. Singh, and A.K. Dhawan. 2011. Microsatellite markers: an
overview of the recent progress in plants. Euphytica 177:309-334.
Kimball, J.A., M.C. Zuleta, K.E. Kenworthy, V.G. Lehman, and S. Milla-Lewis. 2012.
Assessment of genetic diversity in Zoysia species using amplified fragment length polymorphism markers. Crop Sci. 52:360-370.
Konieczny, A., and F.M. Ausubel. 1993. A procedure for mapping Arabidopsis mutations using co-dominant ecotype-specific PCR-based markers. Plant J. 4:403-410.
Kosambi, D.D. 1994. The estimation of map distance from recombination values. Ann
Eugen. 12:172-175.
Kou, Y., and S. Wang. 2010. Broad-spectrum and durability: understanding of quantitative
25
Kruglyak, S., R. T. Durrett, M. D. Schug, and C. F. Aquadro. 1998. Equalibrium
distributions of microsatellite repeat length resulting from a balance between slippage
events and point mutation. Proc Natl Acad Sci USA 95:10774-10778.
Kubik, C., J. Honig, W. Meyer, and S. Bonos. 2009. Genetic diversity of creeping bentgrass
cultivars using SSR markers. International Turfgrass Society Research Journal Volume
11.
Laird, N., and C. Lange. 2011. The fundamentals of modern statistical genetics. Springer
Science+Business Media, LLC. New York, New York.
Lander, E.S., P. Green, J. Abrahamson, A. Barlow, and M. J. Daly. 1987. MAPMAKER:
an interactive computer package for constructing primary genetic linkage maps of
experimental and natural populations. Genomics 1: 174-181.
Li, M., N. Yuyama, M. Hirata, J. Han, Y. Wang, and H. Cai. 2009. Construction of a
high-density SSR marker-based linkage map of zoysiagrass (Zoysia japonica Steud.). Euphytica 170:327-338.
Li, Y., A. Korol, T. Fahima, A. Beiles, and E. Nevo. 2002. Microsatellites: genomic
distribution, putative functions and mutation mechanisms: a review. Mol Ecol
11:2453-2465.
Lindhout, P., 2002. The perspectives of polygenic resistance in breeding for durable disease
resistance. Euphytica 124: 217–226.
Liu, J., W. Hanna, and E. Elsner. 2003. Morphological and seed set characteristics of
26
Liu, J., X. Wang, T. Mitchell, Y. Hu, X. Liu, L. Dai, and G.-L. Wang. 2010. Recent
progress and understanding of the molecular mechanisms of the rice-Magnaporthe oryzae interaction. Mol. Plant Pathol. 11(3):419-427.
Liu, W.-T., T.L. Marsh, H. Cheng, and L.J. Forney. 1997. Characterization of microbial
diversity by determining terminal restriction fragment length polymorphisms of genes
encoding 16S rRNA. Appl. Env. Micro. 63:4516-4522.
Long, J.A., and E.C. Bashaw. 1961. Microsporogenesis and chromosome numbers in St.
Augustinegrass. Crop Sci. 1:41-43.
Loui, R., W.R. Findley, J.K. Knoke, and M.D. McMullen. 1991. Genetic-basis of resistance
in maize to 5 maize-dwarf mosaic-virus strains. Crop Sci. 31:14-18.
Lu, F., M. Yoon, Y. Cho, J. Chung, K. Kim, M. Cho, S. Cheong, and Y. Park. 2011.
Transcriptome analysis and SNP/SSR marker information of red pepper variety
YCM334 and Taean. Scientia Horticulturae 129:38-45.
Lu, Q., Y. Cui, and R. Wu. 2004. A multilocus likelihood approach to joint modeling of
linkage, parental diplotype and gene order in a full-sib family. BMC Genetics 5:20
Maliepaard, C., J. Jansen, and J.W. Van Ooijen. 1997. Linkage analysis in a full-sib family
of an outbreeding plant species: overview and consequences for applications. Genet.
Res. 70:237-250.
Maliepaard, C., F.H. Alston, G. van Arkel, L.M. Brown, E. Chevreau, F. Dunemann, K.M.
Evans, S. Gardiner, P. Guilford, A.W. van Heusden, J. Janse, F. Laurens, J.R. Lynn,
27
Sansavini, H. Schmidt, S. Tartarini, J. J. Verhaegh, M. Vrielink-van Ginkel, G. J. King.
1998. Aligning male and female linkage maps of apple (Malus pumila Mill.) using multi-allelic markers. Theor. Appl. Genet. 97:60-73.
Manly, K.F., H. Cudmore Robert, Jr. & J.M. Meer, 2001. Map ManagerQTX,
cross-platform software for genetic mapping. Mamm Genome 12: 930–932.
Mardis, E. 2008. Next-generation DNA sequencing methods. Annu Rev Genomics Hum
Genet 9:387-402.
Mather, K. 1938. Crossing-over. Biol Reviews Camb Phil Soc 13:252–292.
Mba, C., J. Tohme. 2005. Use of AFLP markers in surveys of plant diversity. Methods In
Enzymology 395:177-201.
McCouch, S.R., G. Kochert, Z.H. Yu, Z.Y. Wang, G.S. Khush, W.R. Coffman, and S.D.
Tanksley. 1988. Molecular mapping of rice chromosomes. Theor. Appl. Genet.
76:815-829.
Meudt, H.M., and A.C. Clark. 2007. Almost forgotten or latest practice? AFLP applications,
analysis and advances. Trends Plant Sci. 12:106-117.
Morgan, T.H. 1928. The Theory of Genes. Yale University Press, New Haven, CT.
Mueller, U. and L. Wolfenbarger. 1999. AFLP genotyping and fingerprinting. Trends in
Ecology and Evolution 14:389-394.
Milla-Lewis, S.R., M.C. Zuleta, G.A. Van Esbroeck, K.H. Quesenberry, and K.E.
Kenworthy. 2013. Cytological and molecular characterization of genetic diversity in
28
Murphy, J.A., S. Bonos, and P. Perdomo. 1997. Classification of Poa pratensis genotypes. Intl. Turf Soc. Res. J. 8:1176-1183.
North Carolina Office of State Budget and Management. Population census data online at:
http://www.osbm.state.nc.us/ncosbm/facts_and_figures/socioeconomic_data/population
_estimates/county_estimates.shtm (as of Feb, 2013).
Okogbenin, E., J. Marin, and M. Fregene. 2008. QTL analysis for early yield in a pseudo F2
population of cassava. African Journal of Biotechnology. 7:131-138.
Ottaviano, E., M. Sari Gorla, E. Pe, and C. Frova. 1991. Molecular markers (RFLPs and
HSPs) for the genetic dissection of thermotolerance in maize. Theor. Appl. Genet.
81:713-719.
Parchman, T., K. Geist, J. Grahnen, C. Benkman, and C. Buerkle. 2010. Transcriptome
sequencing in an ecologically important tree species: Assembly, annotation, and marker
discovery. BMC Genomics 11:180-195.
Paterson, A.H., S. Damon, J.D. Hewitt, D. Zamir, H.D. Rabinowitch, S.E. Lincoln, E.S.
Lander & S.D. Tanksley, 1991. Mendelian factors underlying quantitative traits in
tomato comparison across species generations and environments.
Patton, A.J. 2010. Selecting Zoysiagrass cultivars: Turf quality and stress tolerance. 2010. Golf Course Management 78:80-82,84,86,88.
Peacock, C. H. and A. E. Dudeck. 1993. Response of St. Augustinegrass cultivars
29
Philley, H.W., C.E. Watson Jr., J.V. Krans, J.M. Goatley Jr., and F.B. Matta. 1995.
Differential thermal analysis of St. Augustinegrass. HortScience 30(7):1388-1389.
Powell, W., M. Morgante, C. Andre, M. Hanafey, J. Vogel, S. Tingey, and A. Rafalski.
1996. The comparison of RFLP, RAPD, AFLP, and SSR (microsatellite) markers for
germplasm analysis. Mol. Breed. 2:225-238.
Reinert, J.A., and A.E. Dudeck. 1974. Southern chinch bug resistance is St.
Augustine-grass. J. Econ. Entomol. 67(2):275-277.
Roldan-Ruiz, I., and R. Kolliker. 2010. Marker-assisted selection in forage crops and turf: a
review. p.383-390 In: C. Huyghe (ed.), Sustainable use of genetic diversity in forage
and turf breeding. Springer Science+Business Media, New York, New York.
Rotter, D., K. Amundsen, S. Bonos, W. Meyer, S. Warnke, and F. Belanger. 2009.
Molecular genetic linkage map for allotetraploid colonial bentgrass. Crop Sci
49:1609-1619.
Saha, M., J. Cooper, M. Mian, K. Chekhovskiy, and G. May. 2006. Tall fescue genomic
SSR markers: development and transferability across multiple grass species. Theor
Appl Genet 113:1449-1458.
Saiki, R.K., S. Scharf, F. Faloona, K.B. Mullis, H.A. Erlich, and N. Arnheim. 1985.
"Enzymatic amplification of beta-globin genomic sequences and restriction site
analysis for diagnosis of sickle cell anemia". Science 230: 1350–1354.
Sato, K., T. Inukai, and P. M. Hayes. 2001. QTL analysis of resistance to the rice blast
30
Sauer, J.D. 1972. Revision of Stenotaphrum (Gramineae: Paniceae) with attention to its historical geography. Brittonia 24: 202-222
Sim, S-C., J. Yu, Y. Jo, M. Sorrells, and G. Jung. 2009. Transferability of cereal EST-SSR
markers to ryegrass. Genome 52:431-437.
Skamnioti, P., and S. J. Gurr. 2009. Against the grain: safeguarding rice from rice blast
disease. Trends Biotechnol. 27:141-150.
Taliaferro, C.M. 1995. Diversity and vulnerability of Bermuda turfgrass species. Crop Sci.
35:327-332.
Temnykh, S., G. DeClerck, A. Lukashova, L. Lipovich, S. Cartinhour, and S. McCouch.
2001. Computational and experimental analysis of microsatellites in rice (Oryza sativa
L.): frequency, length variation, transposon associations, and genetic marker potential.
Genome Res 11:1441-1452.
Tsuruta, S., M. Hashiguchi, M. Ebina, T. Matsuo, T. Yamamoto, M. Kobayashi, M.
Takahara, H. Nakagawa, and R. Akashi. 2005. Development and characterization of
simple sequence repeat markers in Zoysia japonica Steud. Grassl Sci 51:249–257.
Van Ooijen, J.W., and R.E. Voorrips. 2001. JoinMap 3.0, Software for the calculation of
genetic linkage maps. Plant Research International. Wageningen, The Netherlands.
Varshney RK, Nayak SN, May GD, Jackson SA. 2009. Next-generation sequencing
technologies and their implications for crop genetics and breeding. Trends in
31
Vergara, G. and S. Bughrara. 2004. Genetic differentiation of tetraploid creeping bentgrass
and hexaploid redtop bentgrass genotypes by AFLP and their use in turfgrass breeding.
Crop Science 44:884-890.
Vignal, A., D. Milan, M. SanCristobal, and A. Eggen. 2002. A review on SNP and other
types of molecular markers and their use in animal genetics. Genet. Sel. Evol.
34:275-305.
Vos, P., R. Hogers, M. Bleeker, M. Reijans, T. van de Lee, M. Hornes, A. Frijters, J. Pot, J.
Peleman, M. Kuiper, and M. Zabeau. 1995. AFLP: a new technique for DNA
fingerprinting. Nucleic Acids Res. 23:4407–4414.
Wang, G.L., D.J. MacKill, J.M. Bonman, S.R. McCouch, M.C. Champoux, and R.J. Nelson.
1994. RFLP mapping of genes conferring complete and partial resistance to blast in a
durably resistant rice cultivar. Genetics 136:1421-1434.
Wang, M.L., Z.B. Chen, N.A. Barkley, M.L. Newman, Q. Kim, P. Raymer, and G.A.
Pederson. 2006. Characterization of seashore paspalum (Paspalum vaginatum Swartz) germplasm by transferred SSRs from wheat, maize and sorghum. Genet. Resour. And
Crop Evol. 53:779-791.
Wang, M., N. Barkley, and T. Jenkins. 2009. Microsatellite markers in plants and insects.
Part I. Applications of Biotechnology. Genes Genomes Genomics 3:54-67.
Wang, Z., B. Fang, J. Chen, X. Zhang, Z. Luo, L. Hunag, and X. Chen. 2010a. De novo
32
sequencing and development of cSSR markers in sweetpoatato (Ipomoea batatas). BMC
Genomics 11:726-739.
Wang Z., K. E. Kenworthy, and Y. Wu. 2010b. Genetic diversity of common carpetgrass
revealed by amplified fragment length polymorphism markers. Crop Science 50:
1366-1374.
Wang Z., Y. Wu, D. Martin, H. Gao, T. Samuels, and C. Tan. 2010c. Identification of
vegetatively propegated turf bermudagrass cultivars using simple sequence repeat
markers. Crop Science 50: 2103-2111
Williams, J.G.K., A.R. Kubelik, K.J. Livak, J.A. Rafalski, and S.V. Tingey. 1990. DNA
polymorphism amplified by arbitrary primers are useful as genetic markers. Nucleic
Acids Res 18:6531-6535.
Wu, K., W. Burnquist, M.E. Sorrells, T. Tew, P. Moore & S.D.Tanksley, 1992. The
detection and estimation of linkage in polyploids using single-dose restriction fragments.
Theor Appl Genet 83: 294–300.
Wu, L., and H. Lin. 1994. Identifying buffalograss [Buchloe-dactyloides (Nutt) Engelm] cultivar breeding lines using random amplified polymorphic DNA (RAPD) markers. J.
AM. Soc. Hortic. Sci. 119:126-130.
Wu Y.Q., C.M. Taliaferro, G.H. Bai, D.L. Martin, J.A. Anderson, M.P. Anderson, and R.M.
33
Xu, X., H. Chen, T. Fujimura, and S. Kawasaki. 2008. Fine mapping of a strong QTL of
Weld resistance against rice blast, Pikahei-1(t), from upland rice Kahei, utilizing a novel resistance evaluation system in the greenhouse. Theor. Appl. Genet. 117:997-1008.
Yamada, T., E. Jones, N. Cogan, A. Vecchies, T. Nomura, H. Hisano, Y. Shimamoto, K.
Smith, M. Hayward, and J. Forster. 2004. QTL analysis of morphological,
developmental, and winter hardiness-associated traits in perennial ryegrass. Crop Sci.
44:925–935.
Yaneshita, M., R. Nagasawa, M.C. Engelke, and T. Sasakuma. 1997. Genetic variation and
interspecific hybridization among natural populations of Zoysiagrasses detected by
RFLP analyses of chloroplast and nuclear DNA. Genes Genet Syst 72:173-179.
Yang, Q.Z., F. Lin, S.J. Fegn, L. Wang, and Q.H. Pan. 2009. Recent progress on molecular
mapping and cloning of blast resistance genes in rice (Oryza sativa L.). Sci. Agric. Sin. 42:1601-1615.
Young, N.D. 2000. Constructing a plant genetic linkage map with DNA markers. p.31-47
In: R.L. Phillips and J.K. Vasil (eds.), DNA-Based markers in plants. Kluwer Academic
Publishers, Netherlands.
Zalapa, J., H. Cuevas, H. Zhu, S. Steffan, D. Senalik, E. Zeldin, B. McCown, R. Harbut, and
P. Simon. 2012. Using next-generation sequencing approaches to isolation simple