1 ABSTRACT
OZCAM, ALI EVREN. Modification and Characterization of Polymeric Surfaces for Targeted Functionality. (Under the direction of Jan Genzer and Richard J. Spontak.)
We have investigated the surface modification of polymeric materials as a viable means by which to create novel functional surfaces for use in a wide range of (nano)technologies, including the development of nanocomposites.
Improvement of the barrier properties of rPET is the overarching theme of this project. It is known that inorganic fillers introduced into a polymer matrix tend to decrease gas permeation by increasing the diffusive path length of penetrant species through the material. Nanoclays as filler materials are ideal for this purpose because of the high aspect ratio of the clay platelets. Therefore, we have sought to generate rPET/clay nanocomposites by two different protocols in this study: attachment of natural clay platelets on functionalized rPET surface, and mechanical alloying of rPET flakes with natural clay platelets.
We have shown that PET surfaces can be chemically modified while avoiding chemical degradation. Specifically, we find that brief exposure of PET substrates to ultraviolet/ozone (UVO) generates a large surface concentration of hydrophilic moieties.
poly(ethylene-co-octene) to perform PEI and clay adsorption multiple times and thus adjust the concentration of clay platelets in the polymer matrix. The presence of clay platelets results in a decrease in O2 and CO2 permeabilities, which compares favorably with calculations from the Neilsen model. In addition, the thermal stability of the nanocomposites increases with increasing clay loading due to the presence of the inorganic platelets.
Electrospun PET fiber surfaces have also been chemically functionalized with polymer brushes composed of poly(N-isopropyl acrylamide) (PNIPAAm), poly(dimethylaminoethyl methacrylate) (PDMAEMA) and poly(hydroxyethyl methacrylate) (PHEMA) via surface-initiated polymerization. These fibers can be used as functional filters to 1) capture metal salts or cyanide ions from water, 2) prepare antibacterial or antifouling fibers, and 3) produce fibers responsive to temperature or pH.
We have also investigated the formation of rPET/clay nanocomposites via mechanical alloying by using high-energy ball milling as an alternative route to melt processing. Solid-state mechanical alloying was conducted using natural clay and rPET at ambient temperature. Specifically, polymer and clay powders were mixed in a steel vial in the presence of steel balls designed to induce considerable and repeated shear, fracture and welding and thus exfoliate the clay platelets in the rPET matrix. The molecular weight of mechanically milled rPET and virgin-PET is found to decrease with increasing milling time, reaching 45% of their original values after 16 h of milling. Characterization of the resulting nanocomposites by x-ray diffractometry and transmission electron microscopy confirm exfoliation of clay platelets irregardless of milling time.
hydrosilylation. The resultant PVMS-TCS coating can be deposited as a functional organic layer on a variety of substrates ranging from hydrophobic to hydrophilic. Spin-coating PVMS-TCS onto a substrate yields a uniform coating layer and exposing the coating to minute amounts of moisture generates a large density of surface-bound hydroxyl groups. Moreover, treating the PVMS-TCS substrates with UVO further increases the density of hydroxyl groups on the surface. The elastic modulus of the coating can be regulated by adjusting the TCS concentration. Several case studies demonstrating the remarkable properties of these PVMS-TCS functional coatings are presented.
Decreasing supplies of fresh water and increasing population necessitate the development of water cleaning technologies that would expedite the removal of pollutants. To assist water purification processes, we have synthesized functionalized macromolecules that contribute to decontamination by scavenging detrimental chemicals. Epitomizing this role, the thioimide unit enables chemical flexibility that facilitates reversible catch-release of the ions on the basis of subtle reduction-oxidation environmental changes. Chemical tunability of the thioimide moiety enables synthesis of thioimide-based monomers and post-polymerization modification agents. Two distinct synthetic pathways, polymerization and post-polymerization modification, have been explored, leading to functional thioimide-based macromolecules. The presence of thioimide units on macromolecular chains decreases the concentration of cyanide ions in water from 24 to 3 ppm in less than 1 h.
Trichlorosilane
PVMS
PVMS-TCS
1
Surface Modification and Characterization of Polymeric Materials for Targeted Functionality
by
Ali Evren Özçam
A dissertation submitted to the Graduate Faculty of North Carolina State University
in partial fulfillment of the requirements for the degree of
Doctor of Philosophy
Chemical Engineering Raleigh, North Carolina
2011
APPROVED BY:
Richard J. Spontak Chair of Advisory Committee
Jan Genzer
Co-chair of Advisory Committee
Saad A. Khan Orlin D. Velev
ii
DEDICATION
iii
BIOGRAPHY
Ali Evren Özçam was born on September 30th, 1982 in Izmir, Turkey. He attended Buca Anadolu Lisesi for high school and upon graduation he started his undergraduate studies at Department of Chemical Engineering at Middle East Technical University.
He graduated from Department of Chemical Engineering as the 1st ranking student among 102 graduates in 2005. He joined the Department of Chemical and Biomolecular Engineering at Norh Carolina State University in August 2005 to pursue a philosophy of doctorate degree in polymer science.
He worked as a PhD intern at Global Chemical Technology Division for Procter and Gamble Company in 2007 summer. Evren spent his 2008 and 2010 summers as a guest researcher in the research group of Jiri Srogl at the Institute of Organic Chemistry and Biochemistry of the Czech Academy of Sciences, Prague Czech Republic. He worked on synthesis, polymerization, post-polymerization modification and characterization of functional thio-imide molecules for water purification technologies.
iv
ACKNOWLEDGMENTS
First and most importantly, I need to thank my advisors, Professors Jan Genzer and Richard Spontak, for their guidance, support, motivation, and teaching. I am grateful to the President and CEO of United Resource Recovery Corporation, Mr. Carlos Gutierrez, for the financial support provided throughout the course of my Ph.D. I likewise thank my committee members — Professors Saad Khan, Orlin Velev and Russell Gorga — for their guidance and comments. I particularly thank Professors Saad Khan, Wesley Henderson and Michael Dickey for letting my use analytical instruments in their laboratories. I would also like to thank Dr. Kirill Efimenko for being a friend and collaborator, as well as Dr. Jiri Srogl and Adam Henke from whom I learned valuable synthetic chemistry skills. Lastly, I need to recognize (with much appreciation) Drs. Salomon Turgman and Omer Gozen for being great friends, colleagues and partners!!
It was a genuine pleasure to work, discuss and share scientific experiences with my group members and other Ph.D. students in the Department of Chemical & Biomolecular Engineering: Dr. Arjun Krishnan, Kristen Roskov, Anand Patel, Casey Galvin, Erich Bain, Pruthesh Vargantwar, Professor Julie Willoughby, Dr. Carl Saquing, Chris Aberg, Dr. Hyun-Kwan Yang, Dr. Young Kuk Jhon, Dr. Shafi Arifuzzaman, Kiran Goli, Dr. Dave Frankowski, Dr. Josh Manasco, Dr. Xiao-Yu Sun, Dr. Michelle Bowman, Dr. Sachin Talwar, Dr. Joan Patterson, Dr. Vinayak Rastogi, Chris Bonino, Sara Arvidson and Christina Tang.
v
vi
TABLE OF CONTENTS
LIST OF TABLES ... xii
LIST OF FIGURES ... xiii
CHAPTER 1: INTRODUCTION AND MOTIVATION ... 1
1.1. BACKGROUND ... 1
1.2.SURFACE MODIFICATION OF RECYCLED POLY(ETHYLENE TEREPHTHALATE) (rPET) FLAKES ... 2
1.3. SURFACE MODIFICATION OF SILICONE ELASTOMER NETWORKS ... 10
1.4.SYNTHESIS OF FUNCTIONAL COPOLYMERS AND POST-POLYMERIZATION MODIFICATION REACTIONS FOR WATER PURIFICATION ... 14
1.5. REFERENCES ... 16
1.6. FIGURES ... 19
CHAPTER 2: MODIFICATION OF POLY(ETHYLENE TEREPHTHALATE) (PET) SURFACES WITH SELF-ASSEMBLED MONOLAYERS OF ORGANOSILANE PRECURSORS ... 24
2.1. INTRODUCTION... 24
2.2. EXPERIMENTAL ... 27
2.2.1. FILM PREPARATION ... 27
2.2.2. ULTRAVIOLET/OZONE (UVO) TREATMENT ... 28
2.2.3. SEMIFLUORINATED SELF-ASSEMBLED MONOLAYER FORMATION ... 28
2.2.4. WATER CONTACT ANGLE MEASUREMENTS ... 29
2.2.5. ATOMIC FORCE MICROSCOPY ... 29
2.2.6. ELLIPSOMETRY... 30
2.2.7. X-RAY PHOTOELECTRON SPECTROSCOPY ... 30
2.2.8. NEXAFS SPECTROSCOPY... 31
2.3. RESULTS AND DISCUSSION ... 32
2.4. CONCLUSIONS ... 42
2.5. REFERENCES ... 44
2.6. FIGURES ... 47
vii
3.1. INTRODUCTION... 58
3.2. EXPERIMENTAL ... 64
3.2.1. MATERIALS ... 64
3.2.2. THIN PET FILM PREPARATION ... 65
3.2.3. POLYELECTROLYTE AND CLAY ADSORPTION ON PET SURFACE ... 65
3.2.4. POLYELECTROLYTE AND CLAY ADSORPTION ON PDMS NETWORK AND POLY(ETHYLENE-OCTENE) SURFACE ... 66
3.2.5. ELLIPSOMETRY... 67
3.2.6. WATER CONTACT-ANGLE MEASUREMENTS ... 68
3.2.7. X-RAY PHOTOELECTRON SPECTROSCOPY ... 68
3.2.8. MELT PROCESSING OF RPET FLAKES ... 68
3.2.9. MELT RHEOLOGY ... 69
3.2.10. FOURIER TRANSFORM INFRARED SPECTROSCOPY ... 69
3.2.11. ATOMIC FORCE MICROSCOPY ... 70
3.2.12. GAS PERMEATION ... 70
3.2.12. THERMOGRAVIMETRIC ANALYSIS ... 71
3.3. RESULTS AND DISCUSSION ... 72
3.4. CONCLUSIONS ... 79
3.5. REFERENCES ... 81
3.6. TABLES AND FIGURES ... 84
CHAPTER 4: RESPONSIVE PET NANO/MICROFIBERS VIA SURFACE-INITIATED POLYMERIZATION ... 103
4.1. INTRODUCTION... 103
4.2. EXPERIMENTAL ... 106
4.3. RESULTS AND DISCUSSION ... 108
4.4. CONCLUSIONS ... 113
4.5. REFERENCES ... 115
4.6. FIGURES ... 118
CHAPTER 5: GENERATION OF FUNCTIONAL NANO/MICRO FIBERS THROUGH SURFACE-INITIATED POLYMERIZATION ... 123
5.1. INTRODUCTION... 123
5.2. EXPERIMENTAL ... 128
5.2.1. MATERIALS ... 128
5.2.2. INSTRUMENTATION ... 129
viii
5.2.4. TESTING ANTIBACTERIAL BEHAVIOR OF PET FIBERS WITH GRAFTED
PDMAEMA BRUSHES ... 132
5.2.5. TESTING PROTEIN RESISTANCE OF PET FIBERS WITH GRAFTED PHEMA BRUSHES... 132
5.3. RESULTS AND DISCUSSION ... 133
5.4. CONCLUSIONS AND FUTURE WORK ... 142
5.5. REFERENCES ... 144
5.6 TABLES AND FIGURES ... 149
CHAPTER 6: MECHANICAL ALLOYING OF POLY(ETHYLENE TEREPHTHALATE) (PET) WITH LAYERED SILICATES ... 160
6.1. INTRODUCTION... 160
6.2. EXPERIMENTAL ... 164
6.2.1. MATERIALS ... 164
6.2.2. BALL MILLING ... 165
6.2.3. SOLUTION VISCOSITY ... 165
6.2.4. DIFFERENTIAL SCANNING CALORIMETRY ... 166
6.2.5. THERMOGRAVIMETRIC ANALYSIS ... 166
6.2.6. X-RAY DIFFRACTION ... 166
6.2.7. ELECTRON MICROSCOPY ... 167
6.3. RESULTS AND DISCUSSION ... 167
6.4. CONCLUSION AND FUTURE WORK ... 171
6.5. REFERENCES ... 174
6.6. FIGURES ... 177
CHAPTER 7: UNIVERSAL COATINGS BASED ON FUNCTIONAL SILICONES 184 7.1. INTRODUCTION... 184
7.2. EXPERIMENTAL ... 192
7.2.1. MATERIALS ... 192
7.2.2. FILM PREPARATION ... 193
7.2.3. PVMS-TCS COUPLING REACTIONS AND MODIFICATIONS ... 194
7.2.4. PVMS-TCS THIN FILM FORMATION ... 196
7.2.5. WATER CONTACT ANGLE MEASUREMENTS ... 196
7.2.6. X-RAY PHOTOELECTRON SPECTROSCOPY ... 197
7.2.7. FOURIER TRANSFORM INFRARED SPECTROSCOPY... 197
7.2.8. ULTRAVIOLET/OZONE TREATMENT ... 198
ix
7.2.10. SCANNING ELECTRON MICROSCOPY ... 199
7.2.11. SPECTROSCOPIC ELLIPSOMETRY ... 199
7.2.12. NEAR-EDGE X-RAY ABSORPTION FINE STRUCTURE ... 200
7.2.13. NANOINDENTATION ... 201
7.3. RESULTS AND DISCUSSION ... 202
7.3.1. PVMS-TCS COATING ON PDMS NETWORK SUBSTRATES ... 204
7.3.2. PVMS-TCS COATING ON PET SUBSTRATES ... 210
7.3.3. SURFACE INITIATED POLYMERIZATION ON PET, PP AND SIOx SURFACES ... 219
7.4. CONCLUSION AND FUTURE WORK ... 220
7.5. REFERENCES ... 227
7.6. FIGURES ... 229
7.7. APPENDIX ... 257
7.7.1. SYNTHESIS OF PVMS ... 257
7.7.2. PREPARATION OF SILOXANE NETWORKS ... 258
CHAPTER 8: COPOLYMERIZATION STUDIES OF FUNCTIONAL THIOIMIDE MOLECULES ... 260
8.1. INTRODUCTION... 260
8.2. EXPERIMENTAL ... 263
8.2.1. MATERIALS ... 263
8.2.2. INSTRUMENTATION ... 266
8.2.3. CONTROL EXPERIMENTS WITH MODEL CONTROL-SN COMPOUND .... 267
8.2.4. POLYMERIZATION REACTIONS ... 268
8.2.4.1. COPOLYMERIZATION OF SN2P AND PHENYLACRYLAMIDE ... 268
8.2.4.2. SURFACE INITIATED COPOLYMERIZATION OF SN2P AND PHENYLACRYLAMIDE ... 269
8.2.4.3. COPOLYMERIZATION OF NIPAAM WITH SN2U, SN2P, SN3U AND SN3P ... 270
8.2.5 DEPROTECTION OF PNIPAAM-CO-SN3P COPOLYMERS FROM T-BUTYL GROUPS ... 270
8.3. RESULTS AND DISCUSSION ... 271
8.3.1. CONTROL EXPERIMENTS WITH MODEL CONTROL-SN COMPOUND .... 271
8.3.2. COPOLYMERIZATION OF SN2P AND PHENYLACRYLAMIDE IN BULK . 273 8.3.2.1. HOMOPOLYMERIZATIONS OF SN2P AND PHAAM ... 274
8.3.2.2. COPOLYMERIZATIONS OF SN2P MONOMER WITH PHAAM ... 275
x
8.3.3.1. GROWING PPHAAM AND POLY(PHAAM-CO-SN2P) BRUSHES FROM
SILICON WAFERS ... 278
8.3.4. COPOLYMERIZATION OF NIPAAM WITH SN2U, SN2P, SN3U AND SN3P 281 8.3.4.1. HOMOPOLYMERIZATION OF NIPAAM, SN3U AND SN3P MONOMERS . 281 8.3.4.2. COPOLYMERIZATION OF NIPAAM WITH SN2U, SN2P, SN3U AND SN3P MONOMERS... 283
8.3.5. DEPROTECTION OF PNIPAAM-CO-SN3P COPOLYMERS FROM T-BUTYL GROUPS ... 285
8.4. CONCLUSION AND FUTURE WORK ... 286
8.5. REFERENCES ... 291
8.6. TABLES AND FIGURES ... 292
8.7. APPENDIX ... 329
CHAPTER 9: POST-POLYMERIZATION MODIFICATION STUDIES WITH FUNCTIONAL THIOIMIDE MOLECULES ... 331
9.1. INTRODUCTION... 331
9.2. EXPERIMENTAL ... 334
9.2.1. MATERIALS ... 334
9.2.2. INSTRUMENTATION ... 336
9.2.3. POLYMERIZATION AND POST-MODIFICATION REACTIONS ... 338
9.2.3.1. POLYMERIZATION OF PDMAEMA ... 338
9.2.3.2. POLYMERIZATION OF PDMAEMA BRUSHES ... 338
9.2.3.3. POLYMERIZATION OF PROPARGYL METHACRYLATE ... 339
9.2.3.4. POST-MODIFICATION OF PDMAEMA WITH SN BASED QUARTERNIZATION AGENTS ... 340
9.2.3.5. POST-MODIFICATION OF PDMAEMA BRUSHES WITH SN BASED QUARTERNIZATION AGENTS ... 341
9.2.3.6. POST-MODIFICATION OF PPMA WITH ORGANIC AZIDES ... 341
9.2.3.7. CAPTURING OF CYANIDE IONS WITH qPDMAEMA-SN... 342
9.3. RESULTS AND DISCUSSIONS ... 342
9.3.1. POST-MODIFICATION OF PDMAEMA BRUSHES ON SILICON WAFER AND PET FIBERS WITH QSN1U VIA QUARTERNIZATION ... 342
9.3.2. POST-MODIFICATION OF PDMAEMA IN BULK WITH qSN3U VIA QUARTERNIZATION... 348
9.3.3. POST-MODIFICATION OF PPMA WITH AZIDE-SN3U VIA CLICK REACTION ... 350
9.3.4. CAPTURING OF CYANIDE IONS WITH qPDMAEMA-SN ... 351
xi
9.5. REFERENCES ... 356
9.6. TABLES AND FIGURES ... 358
9.7 APPENDIX ... 378
9.7.1. SYNTHESIS OF N-BENZYL-2-CHLORO-5-NITROBENZAMIDE ... 378
9.7.2. SYNTHESIS OF N-BENZYL-2-TERT-BUTYLSULFANYL-BENZAMIDE ... 378
9.7.3. SYNTHESIS OF 5-AMINE-N-BENZYL-2-TERT-BUTYLSULFANYL-5-NITROBENZAMIDE ... 379
9.7.4. SYNTHESIS OF N-BENZYL-2-TERT-BUTYLSULFANYL-5-(2-CHLORO-ACETYLAMINO)-BENZAMIDE ... 379
9.7.5. SYNTHESIS OF N-(2-BENZYL-3-OXO-2,3-DIHYDRO-BENZO[d]ISOTHIAZOL-5-YL)-2-CHLORO-ACETAMIDE ... 379
CHAPTER 10: SUMMARY AND OUTLOOK ... 381
10.1. SUMMARY ... 381
xii
LIST OF TABLES
Table 3.1. Classifications of layered silicate crystals ... 84
Table 5.1. Atomic concentration of PET fiber surface with grafted PDMAEMA and PHEMA brushes ... 149
Table 5.2. Atomic concentration of PET fiber surface with grafted PDMAEMA brushes after quarternization post-polymerization modification reactions ... 150
Table 5.3. Atomic concentration of PET fiber surface with grafted PHEMA brushes after fluorination post-polymerization modification reactions... 151
Table 8.1. Composition of the polymerizations performed ... 292
Table 8.2. Molecular weight and its distribution of the synthesized polymers ... 293
Table 8.3. N:C and N:S ratios of the copolymers determined with XPS ... 294
Table 8.4. Measured thickness and refractive index of polymer brushes ... 295
Table 8.5. Calculated refractive indexes of monomers ... 296
Table 8.6. Atomic percentages of PPhAAm and 9.1% SN2P polymer brush measured with XPS ... 297
Table 9.1. Thickness and optical constants of PDMAEMA brushes before and after attaching qSN1P... 358
Table 9.2. Atomic concentrations of qSN1U modified PDMAEMA brushes on silicon wafer and theoretical atomic percentages ... 359
Table 9.3. Calculated refractive indices and molecular weights of qSN1U, fluorinated thiol and THF ... 360
xiii
LIST OF FIGURES
Figure 1.1. Production rate of plastics and distribution of polymer usage areas. ... 19 Figure 1.2. CO2 retention times of the bottles produced from rPET and vPET. ... 20 Figure 1.3. The silicone backbone with the bond angles ( ) and the bond length (L)
identified. If both R groups are methyl, the polymer is referred to as
poly(dimethylsiloxane) (PDMS). ... 21 Figure 1.4. Cross-linking of silicone chains to form a silicone elastomer network (SEN). 22 Figure 1.5. Generalized structure of a thioimide compound. ... 23 Figure 2.1. Thickness of PET at various stages of surface treatment. The original thickness
decreases with increasing UVO treatment time (a) and decreases further after
subsequent sonication (b). The total amount of PET removed from the sample is shown in (c). ... 47 Figure 2.2. Static water contact angle (top), oxygen content (middle), and carbon content
(bottom) as functions of UVO treatment time immediately after UVO treatment (black squares) and after UVO followed by sonication (red triangles). The contact angle was measu red by the contact angle goniometer and the elemental compositions were
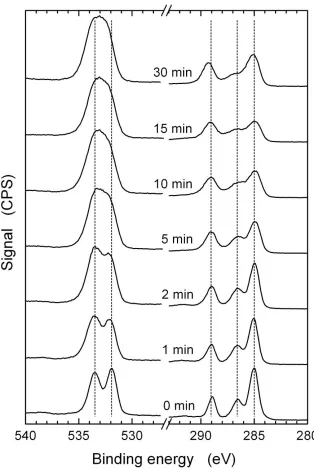
determined by XPS. ... 48 Figure 2.3. High resolution XPS spectra of PET samples in the oxygen (before break) and
carbon (after break) treated with UVO for various times. ... 49 Figure 2. 4. Atomic percentages of various chemical functionalities present in the
PET-UVO specimens, determined by XPS, as a function of the PET-UVO treatment time before (black squares) and after (red triangles) sonication. The lines are meant to guide the eye. ... 50 Figure 2.5. AFM images of PET surfaces treated with UVO for various times (in min): a) 0,
b) 2, c) 8, and d) 30. The left and right panels in parts (b)-(d) correspond to the image taken from samples before and after sonication, respectively. The height scale r ranges from 0 (dark brown) to 30 nm (white). ... 51 Figure 2.6. Water contact angles of PET-UVO/tF8H2 (squares) and SiOx/tF8H2 (triangles)
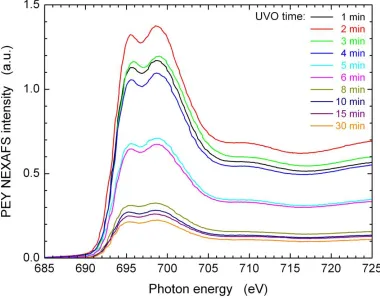
samples as function of UVO treatment time. ... 52 Figure 2.7. Fluorine K-edge PEY NEXAFS spectra collected from PET modified with UVO for various times ranging from 1 to 30 min and covered with tF8H2 SAM. ... 53 Figure 2.8. Carbon K-edge PEY NEXAFS spectra collected from PET modified with UVO
for various times ranging from 1 to 30 min and covered with tF8H2 SAM. The PEY NEXAFS spectra for samples treated for UVO times longer than 1 min have been shifted vertically by 0.3 (with respect to the preceding spectrum) on a relative intensity scale. The dotted lines below each spectrum denote the PEY NEXAFS intensity
corresponding to the pre-edge intensity signal for that spectrum. ... 54 Figure 2.9. a) PEY NEXAFS spectrum from PET-UVO (black dashed line) and PET-UVO
xiv
Difference PEY NEXAFS intensity obtained by subtracting the PET-UVO spectrum (dashed line in part a) from the PET-UVO/tF8H2 spectrum (solid line in part a). ... 55 Figure 2.10. Edge-jump in PEY NEXAFS intensity from difference spectra (cf. Figure 9)
determined at 320 eV as a function of UVO treatment time (blue triangles). Scaling coefficient (K) values as defined in the text as a function of UVO treatment time (red squares). ... 56 Figure 2.11. Normalized PEY NEXAFS spectra collected from PET-UVO/tF8H2
specimens at the carbon K-edge in two different sample orientations (defined as the angle between the surface normal and the electric vector of the incident x-ray beam): 20 (black) and 90 (red). The PET was treated with UVO for various times ranging from 2 (top) to 8 (bottom) min. ... 57 Figure 3.1. The effect aspect ratio (a, b and c) and orientation (d) on the tortuosity factor. .. 85 Figure 3.2. Chemical structure of 2:1 layered silicates.[10] ... 86 Figure 3.3. Different morphologies of polymer/clay composites.[10] ... 87 Figure 3.4. Degradation behavior of various clays in air atmosphere (C30B, C15A and C10A
are the organically modified clays of Southern Clay Products. C30B is natural montmorillonite modified with methyl, tallow, bis-2-hydroxyethyl quaternary
ammonium, C15A is natural montmorillonite modified with dimethyl, dehydrogenated tallow quaternary ammonium, C10A is natural montmorillonite modified with dimethyl, benzyl, hydrogenated tallow quaternary ammonium). The dashed line represent the range of melt processing temperature of PET... 88 Figure 3.5. The proposed starting point for rPET/clay nanocomposite formation. ... 89 Figure 3.6. Surface topography of PET soft drink bottle (a) and rPET flake (b). The scale bar
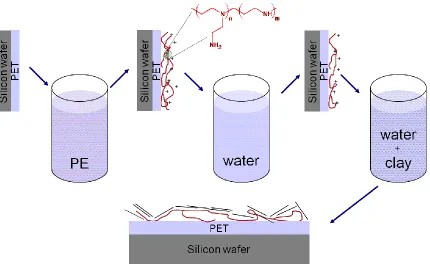
is 2 m for both images. ... 90 Figure 3.7. Schematic representation of polyelectrolyte adsorption on PET flake surface with
subsequent clay platelet adsorption. ... 91 Figure 3.8. Water contact angle of PET surface after polyelectrolyte (a) and subsequent clay
(b) adsorption as a function of polyelectrolyte deposition time for PAH (),PEI25 () and PEI60 (▲). Green and pink lines represent the water contact angle values of bare PET thin film and PET thin film exposed to clay suspension in DI water, respectively. 92 Figure 3.9. Thickness of the polyelectrolyte (a) and clay (b) layers after polyelectrolyte and
subsequent clay adsorption as a function of polyelectrolyte deposition time for PAH (),PEI25 () and PEI60 (▲). ... 93 Figure 3.10. Surface composition of rPET (a) and PEI treated rPET surface (b)... 94 Figure 3.11. Surface composition of rPET surface exposed to clay suspension (a) and PEI60
treated rPET surface exposed to clay suspension (b). ... 95 Figure 3.12. FT-IR spectra collected on a rPET flake and the inset shows the ratio of FT-IR
peak areas located at 1200 and 750 cm-1 before (red columns) and after extrusion (green columns) for rPET, rPET/PEI60 and rPET/PEI60/MMT flakes. ... 96 Figure 3. 13. Carbon dioxide () and oxygen () permeability through PDMS network as a
xv
Figure 3. 14. Percentage of remaining inorganic residue after pyrolysis modified LLDPE as a function of processing cycles for PEI60/clay () and PEI60 (). ... 98 Figure 3. 15. Oxygen (left) and carbon dioxide (right) permeabilities through LLDPE as a
function of processing cycles for PEI60/clay () and PEI60 (). ... 99 Figure 3. 16. The comparison of experimentally obtained permeabilities () of oxygen and
carbon dioxide with calculated with Nielsen model based on the inorganic residue concentration determined from TGA for the clay aspect ratios of 50 (), 100 () and 200 (Δ). ... 100 Figure 3. 17. FT-IR spectra of virgin LLDPE (black line), PEI60 (red line) and PEI60/clay
(blue line) treated and melt processed LLDPE films. ... 101 Figure 3. 18. Onset degradation temperature measured by TGA experiments for LLDPE
membrane treated with PEI60/clay () and PEI60 (). ... 102 Figure 4.1. Sequence of surface modification steps employed in this study to functionalize
electrospun PET microfibers with thermoresponsive PNIPAAm brushes. The steps require deposition and amidation of APTES (a), followed by hydrolysis of the
ethoxysilane groups on APTES to form silanol groups (b), which permit attachment of BMPUS (c) and subsequent ATRP of NIPAAm to yield PNIPAAm brushes (d). The top and bottom SEM images display PET and PET-PNIPAAm microfibers, respectively.118 Figure 4.2. FTIR spectra of (a) as-spun PET, (b) PET-SiOH and (c) PET-PNIPAAm
microfibers. Spectra arranged in the same order in the expanded views reveal the appearance of peaks associated with the formation of secondary amide moieties (dotted lines; see text for assignments). ... 119 Figure 4.3. XPS spectra of (a) PET-SiOH microfibers and (b) PET-PNIPAAm microfibers.
The survey scans confirm the presence of N upon amidation of PET by APTES in (a) and PNIPAAm brush formation in (b). The high-resolution insets show the C1s peak ( 285 eV) before (a) and after (b) PNIPAAm brush growth. ... 120 Figure 4.4. Cyclic WCA measurements of as-spun PET ( ) and PET-PNIPAAm ( )
microfibers at temperatures (in ºC) below and above the Tc of PNIPAAm in water: (a) 25, (b) 60, (c) 25, and (d) 60. The error bars correspond to one standard deviation in the data. ... 121 Figure 4.5. SEM images acquired from PET-PNIPAAm microfibers exposed to aqueous
suspensions of Au nanoparticles at temperatures (labeled) below and above the Tc of PNIPAAm. The illustrations in the insets (not drawn to scale) portray the conformation of the PNIPAAm brush at each temperature. ... 122 Figure 5.1. Surface modification and polymer brush growth steps on PET fibers. Two
polymers were grafted to the PET surface: PHEMA (R=(CH2)2OH) and PDMAEMA (R=(CH2)2N(CH3)2). ... 152 Figure 5.2. Morphology of PET fibers after PDMAEMA (a) and PHEMA (b) brush growth.
... 153 Figure 5.3. FT-IR spectra of PDMAEMA (a) and PHEMA (b) brushes on PET fibers (solid
xvi
Figure 5.4. PET fiber (a), PDMAEMA brush attached to PET fiber (b) and PHEMA brush attached to PET fiber (c). ... 155 Figure 5.5. Morphology PDMAEMA (a) and PHEMA (a) brushes on PET fibers after
quarternization and fluorination reactions, respectively. ... 156 Figure 5.6. FT-IR spectra of PDMAEMA (a) and PHEMA (b) brushes on PET fibers along
with PDMAEMA and PHEMA homo-polymers and PET fiber before and after
quarternization and fluorination reactions. ... 157 Figure 5.7. Mechanism of bacterial lysis upon interaction with quarternized PDMAEMA
(a), photos of agar plates those shows the number of colony forming units after incubation at 37 C for 18 hours (b) and number of CFUs on agar plates after exposing the bacteria to qPDMAEMA brushes on PET fibers. The red line is the initial number of E. coli exposed to qPDMAEMA brushes on PET fibers (c) (Scheme in Figure 7.a was obtained from ref. 72). ... 158 Figure 5.8. Surface nitrogen concentration on modified PET fibers and flat substrates and
corresponding thickness after fibrinogen adsorption experiments. ... 159 Figure 6.1. Fundamental principle of high-energy-mechanical-milling. ... 177 Figure 6.2. Change in molecular weight of rPET () and vPET () as a function of milling time. ... 178 Figure 6.3. Crystallinity of (a) vPET, (b) rPET, (c) vPET+5%Na+MMT and (d)
rPET+5%Na+MMT as a function of milling time. ... 179 Figure 6.4. Weight-loss of rPET and vPET, as well as vacuum-oven dried rPET and vPET
(see legend). The solid and dashed lines represent the weight loss and the derivative of the weight loss, respectively. ... 180 Figure 6.5. Summary of thermal degradation behavior of mechanically milled rPET ()
and vPET () mechanically alloyed rPET/clay () and vPET/clay ()samples: (a) residue after complete pyrolyzing all organics (b) onset degradation temperatures and (c) 2nd peak degradation temperatures. ... 181 Figure 6.6. XRD patterns of as received Na+ MMT, 5% (w/w) physical mixture of Na+
MMT and 2 hr milled rPET, 2, 5, 8 and 16 h mechanically alloyed 5% Na+ MMT and rPET mixture. ... 182 Figure 6.7. TEM micrographs of mechanically alloyed 5% (w/w) Na+ MMT and rPET for 2
hours (a) and (b) and 16 hours (c) and (d). ... 183 Figure 7.1. The silicone backbone with the bond angles and the bond length. If both R
groups are methyl the polymer is called poly(dimethylsiloxane) (PDMS). ... 229 Figure 7.2. Linking silicone chains with each other to form the silicone elastomer networks
(SENs). ... 230 Figure 7.3. Possible routes to form bi-layers of silicone networks. ... 231 Figure 7.4. Coupling of trichlorosilane (TCS) molecule to vinyl groups of PVMS via the
hydrosilylation reaction. ... 232 Figure 7.5. The chemical structure of PVMS-TCS/PVMS random copolymer (a), the
xvii
and pink dots in Figure 7.3b correspond to the optical images of the same color frame in Figure 7.3c. ... 233 Figure 7.6. The thickness on the PVMS-TCS layer as a function of the concentration of
PVMS-TCS in spin-coating solution and vinyl:TCS ratio (). The lines are meant to guide the eye. ... 234 Figure 7.7. Optical microscopy images of spin-coated PVMS-TCS on PDMS network as a
function of Vinyl:TCS ratio. ... 235 Figure 7.8. The modulus on the PVMS-TCS layer as a function of the concentration of
PVMS-TCS in spin-coating solution and vinyl:TCS ratio (). The lines are meant to guide the eye. ... 236 Figure 7.9. Oxygen permeation through the PVMS, PDMS and PVMS-TCS coated PDMS
networks. PVMS-TCS layer was 150 nm, the vinyl;TCS ratio = 7. The values reported represent the average of 3 measurements, the error bars were calculated as ―standard error‖. ... 237 Figure 7.10. Water contact angle of PVMS-TCS coated PDMS networks as a function of
vinyl : TCS ratio before (a) and after 10 minutes of UVO treatment for 0.5 (), 1 (), 3 (), and 5% () PVMS-TCS concentration in spin-coating solution. The grey and light blue rectangles are the water contact angle range for bare PDMS and PVMS, respectively before and after 10 minutes of UVO treatment. ... 238 Figure 7.11. FT-IR spectra of PDMS (thick black line), PVMS-TCS/PDMS laminates (from
0.5 (red line), 1 (blue line), 3 (dark yellow line) and 5% (purples line) PVMS-TCS copolymer in spin-coating solution) and bare PVMS (thick olive line) before (a) and after 10 minutes (b) of UVO treatment. ... 239 Figure 7.12. Surface nitrogen concentration (a) and modulus (b) of PVMS () and
PVMS-TCS () coated PDMS network after attaching thiol-terminated peptide via thiol-ene addition reaction... 240 Figure 7.13. Reaction scheme depicting the pre-modification of PVMS-TCS coating. ... 241 Figure 7.14. Chemical structure of functional coatings and their corresponding wettabilities.
... 242 Figure 7.15. FT-IR spectra of PET film (black line), PVMS network (green line), 200 nm
PVMS-TCS layer on PET film (blue line) and 1 m PVMS-TCS layer on PET film (red line). ... 243 Figure 7.16. Water contact angle of PET films (a), PVMS-TCS/PET and PVMS-TCS/SiOx
films (b) as a function of the UVO treatment time. ... 244 Figure 7.17. Atomic concentrations of oxygen (a), carbon (b) and silicon (c) for PET (),
PVMS-TCS/PET (▲) and PVMS network (□) as a function of the UVO treatment time. ... 245 Figure 7.18. HR-XPS silicon (a), oxygen (b) and carbon (c) spectra of bare PVMS (black
xviii
which are centered at the peak maximas of Si 2p, O 1s and C 1s spectra of PVMS-TCS/PET. ... 246 Figure 7.19. Surface topography of PET (a) and PVMS-TCS coated PET films (b) as a
function of the UVO treatment time. ... 247 Figure 7.20. Water contact angle of fluorinated PET (), PVMS-TCS coated PET (▲) and
silicon wafer () as a function of the UVO treatment time of PET and PVMS-TCS/PET substrates. ... 248 Figure 7.21. Carbon K-edge PEY NEXAFS spectra collected at = 50º from
PVMS-TCS/PET modified with UVO for various times ranging from 1 to 30 minutes and covered with tF8H2 SAM. The short dashed line at the post-edge coincides with the pre-edge PEY intensity. ... 249 Figure 7.22. Proposed mechanism of removal of fluorinated t-F8H2 silanes for UVO-treated PET. ... 250 Figure 7.23. NEXAFS spectra of UVO treated and fluorinated PET (a) PVMS-TCS/PET (b) films. ... 251 Figure 7.24. Wettability of different material surfaces before and after coating and 5
minutes of UVO treatment. ... 252 Figure 7.25. Coupling of azo based free radical polymerization initiator to PVMS-TCS. . 253 Figure 7.26. FT-IR spectra of TCS-azo/PP (green line), PMMA (black line),
PVMS-TCS-azo/PET-PMMA (blue line) and PVMS-TCS-azo/PP-PMMA (red line) plotted in graph (a) and surface tethered PMMA chains grown on silicon wafers from PVMS-TCS-azo coating. The thin black lines are the IR spectra of corresponding substrates (PP and PET) and the dashed lines are guide to eye for the IR peaks of PMMA... 254 Figure 7.27. Incorporation of nanoparticles in PVMS-TCS copolymer solution would
increase the hardness and barrier properties of the coating. ... 255 Figure 7.28. Bi-axial buckles formed on PDMS network via immersion of swelled PDMS
network in PVMS-TCS copolymer solution. ... 256 Figure 8.1. Polymers anchored to the surface of a fiber are endowed with thioimide
functionality. After oxidation, the ring opens up and the thioimide is ready to scavenge a heavy metal of a toxin (phosphate or cyanide). This process is associated with a color change. Capturing of heavy metals/toxins is associated with de-coloring. The
metals/toxins can be removed from the polymeric materials by mild oxidation. The system returns to the original state and can be reused in the recovery process. ... 298 Figure 8.2. Structure of SN compound. ... 299 Figure 8.3. Direct polymerization of functional polymer (a) and polymerization of
―reactive‖ polymer for post-polymerization reaction and sebsequent attachment of desired functionality... 300 Figure 8.4. Azo-based polymerization initiator for surface-initiated polymerization. ... 301 Figure 8.5. HPLC chromatogram of control-SN molecule in DMF in the presence of FRP
xix
Figure 8.6. HPLC chromatogram of control-SN molecule in DMF in the presence of SN3U monomer, FRP initiator and naphthalene at 75 ˚C for 0 hour (black like), 2 hours (red line), 3.5 hours (blue line) and 22 hours (purple line). The peaks located at 2.96, 3.09 and 3.68 minutes correspond to SN3U monomer, control-SN and naphthalene
respectively. ... 303 Figure 8.7. HPLC chromatograms of SN3U (left) and SN3P monomers (right) for 0 hour
(black line) and 40 hours (red line) in DMF at 75 ˚C. The peaks located at 2.96, 3.11, 3.49 and 3.68 min correspond to SN3U monomer, impurities in SN3U monomer, SN3P monomer and naphthalene respectively. ... 304 Figure 8.8. Polymerization scheme of SN2P and PhAAm. ... 305 Figure 8.9. Differential refractive index (DRI) and light scattering data of SN2P monomer
(black line) and dried polymerization mixture (red line). ... 306 Figure 8.10. FT-IR spectra of SN2P monomer (black line) and dried polymerization mixture of 100% SN2P (red line). ... 307 Figure 8.11. NMR spectra of dried polymerization mixture of 100% SN2P collected in
d-acetone. ... 308 Figure 8.12. NMR spectra of 9.1% SN2P copolymer measured in d-acetone. ... 309 Figure 8.13. DSC thermograms of PPhAAm (black line), 4.8% SN2P (red line) and 9.1%
SN2P (blue line) containing copolymers synthesized in DMF at 75 ˚C (exotherm is up). ... 310 Figure 8.14. Simulated values of refractive indices for SN2P (▲), PhAAm () and SN2U
() as a function of monomeric repeat units. ... 311 Figure 8.15. FT-IR spectra of 9.1% SN2P-PAAm copolymer, PPhAAm brush and their
difference. ... 312 Figure 8.16. Original (left) and normalized (right) SEC chromatograms of the
polymerization mixtures from brush growth and monomers. SN2P monomer (black line), PhAAm monomer (red line), from PPhAAm brush polymerization solution (dark yellow line), from 9.1 SN2P brush polymerization solution (blue line) and heated
PhAAm solution (olive line). ... 313 Figure 8.17. HPLC chromatograms of SN3U homopolymerization mixture in DMF at 75 ˚C
for 0 black line), 2 (red line), 4.5 (blue line) and 24 hours (purple line). The peaks located at 2.96, 3.11, 3.49 and 3.68 min correspond to SN3U monomer, impurities in SN3U monomer and naphthalene respectively. ... 314 Figure 8.18. 1H-NMR spectra of PNIPAAm (black line), 10% SN3U (red line), 30% SN3U
(blue line) containing copolymer and SN3U homopolymer (green line). ... 315 Figure 8.19. FT-IR spectra of SN3U homopolymer. ... 316 Figure 8.20. HPLC chromatograms of SN3P homopolymerization mixture in DMF at 75 ˚C
for 0 black line), 2 (red line), 4.5 (blue line) and 24 hours (purple line). The peaks located at 3.47 and 3.68 min correspond to SN3P monomer and naphthalene
respectively. ... 317 Figure 8.21. HPLC chromatograms of 10% SN3U and 90% NIPAAm polymerization
xx
line). The peaks located at 1.14, 2.98 and 2.68 minutes correspond to NIPAAm, SN3U and naphthalene respectively. ... 318 Figure 8.22. HPLC chromatograms of 10% SN3P and 90% NIPAAm polymerization
mixture for 0 (black line), 2 (red line), 4 (blue line) and 20 hours (olive line). The peaks located at 1.14, 3.47 and 2.68 minutes correspond to NIPAAm, SN3P and naphthalene respectively. ... 319 Figure 8.23. HPLC chromatogram of 30% SN3P and 70% NIPAAm polymerization
mixture for 0 (black line), 3 (red line), 7 (blue line), 10 (purple line) and 22 hours (olive line). The peaks located at 1.14, 3.47 and 2.68 minutes correspond to NIPAAm, SN3P and naphthalene respectively. ... 320 Figure 8.24. 1H-NMR spectra of 50% wt SN3P containing NIPAAm-co-SN3P copolymer
before (black line) and after (red line) deprotection reaction. ... 321 Figure 8.25. FT-IR specta of 50% SN3P containing NIPAAm-co-SN3P copolymer before
(black line) and after (red line) deprotection reaction. ... 322 Figure 8. 26. Synthesis of PAAm from aniline and acroyl chloride. ... 323 Figure 8.27. Reaction step 1. ... 324 Figure 8.28. Byproduct of reaction step 1. ... 325 Figure 8.29. Reaction step 2. ... 326 Figure 8.30. Reaction step 3. ... 327 Figure 8.31. Reaction step 4. ... 328 Figure 9.1. Free radical and atom transfer radical polymerization initiators for surface
initiated. ... 362 Figure 9.2. FT-IR spectra of 100nm PDMAEMA brush on silicon wafer (black line),
qSN1U attached to 100nm (blue line) and 200nm (red line) PDMAEMA brush on silicon wafer. ... 363 Figure 9.3. Reaction scheme of activating SN bond of qSN1U. ... 364 Figure 9.4. Differential refractive index and UV absorbance data of qSN1U (black line) and
qSN1U after attachment of fluorinated thiol (red line). ... 365 Figure 9.5. FT-IR spectra of PDMAEMA brushes on PET fibers before (black line) and
after qSN1U modification (red line). ... 366 Figure 9.6. Reaction scheme of quarternization reaction of PDMAEMA and qSN3U. ... 367 Figure 9.7. Reaction scheme of quarternization reaction of PDMAEMA and qSN3U. ... 368 Figure 9.8. 1H-NMR spectra of PDMAEMA before (black line) and after (red line)
quarternization reaction with qSN3U. ... 369 Figure 9.9. FT-IR spectra of PDMAEMA (black line) and quarternized and ion exchanged
PDMAEMA (red line). ... 370 Figure 9.10. Reaction scheme of click reaction of azide-SN3U with PPMA. ... 371 Figure 9.11. NMR spectra of propargyl methacrylate before (black line) and after click
reaction with azide-SN3U (red line). ... 372 Figure 9.12. FT-IR spectrum of PPMA before (black line) and after the click reaction with
azide-SN3U (red line). ... 373 Figure 9.13. Formation of free polymer chains (a) and polymer networks (b) and their
xxi
Figure 9.14. Possible polymer architectures that can be used to be used with
post-modification reactions. ... 375 Figure 9.15. Homo-polymer, random copolymer and block copolymer brushes for
1
CHAPTER 1: INTRODUCTION AND MOTIVATION
1.1. BACKGROUND
Surface characteristics of materials define the physical properties and performance of the final products for many advanced processes and applications involving self-cleaning, antifogging, antifouling, scratch resistance, bio-sensing devices, and improved adhesion. The characteristics of the aforementioned processes and applications can be achieved and optimized by tuning the chemistry, topography, surface modulus, charge density and mobility of the material surfaces employed. Most polymeric materials produced by and used in industry today are non-polar in nature, which renders them inherently hydrophobic. It is therefore challenging to decorate such supports with adhesives, inks, paints, or biological moieties that contain polar groups. Engineering the surface properties of materials can be achieved by introducing functional characteristics to improve performance for a specific application in mind. Therefore, polymer surface modification constitutes an increasingly important scientific and industrial step that must be developed and instituted to create targeted functional materials.
2
The most common methods in this genre include treatments with plasma, ultraviolet/ozone (UVO), flame, laser, corona, or ion beam bombardment. Chemical treatment techniques involve the introduction of new functional groups via various chemical reactions. Such methodologies include surface grafting, deposition of self-assembled monolayers (SAMs), or surface polymerization. Since most of these surface modification techniques involve polymer degradation (albeit often more controlled than exposure to physical treatment techniques), careful selection of the proper experimental conditions is imperative to achieve successful modification of the polymer surface without degrading the bulk polymer.
The overarching theme of this study is to engineer surface characteristics of polymeric materials to create novel functional surfaces and use these surfaces in different fashion, including the development of nanocomposites. Another outcome of this work is the synthesis of copolymers containing thioimide functionalities that are capable of water filtration. Recycled poly(ethylene terephthalate) (rPET) and polysiloxane networks are the main substrates utilized for the work presented in this study.
1.2. SURFACE MODIFICATION OF RECYCLED
POLY(ETHYLENE TEREPHTHALATE) (rPET) FLAKES
3
growth has been associated primarily with the highly reduced cost, facile production/ manufacture, and beneficial properties of plastics relative to other materials, including metals, ceramics, wood, and others. Currently, synthetic polymers are employed in nearly every commercial product, from cosmetics to computer parts, with the packaging industry becoming a strong leader in polymer consumption, accounting for nearly 30% of all plastics. Utilization of polymeric materials in daily life continues to increase steadily and is expected to reach 365 million tons in 2015 at an annual growth rate of 8.1%.[2] While the packaging industry is responsible for the largest share of polymer consumption, polymers used in this field are commonly discarded after single use, which promotes growing landfill concerns. The rapid surge of plastic utilization has not proved entirely beneficial, however, due to serious environmental challenges associated with waste (i.e., landfilling and incineration). Environmental considerations, coupled with the limited supply and increasing price of oil, necessitate polymer recycling on a global basis. Polymer recycling is, however, routinely accompanied by nontrivial deterioration of physical properties. Therefore, recycled polymers are frequently used as fillers or other low-value materials for mundane applications.
4
second largest market is in the production of bottle-grade resin. Of all commercially important thermoplastics and engineering polymers, PET has experienced the largest growth rate with the overall PET consumption in the world reaching 9.1 million tons in 2003[1] and expected to double by 2010 (data not yet available). Recycling of PET has attracted a lot of attention in the past, primarily because PET can, in principle, be nearly 100% recycled. With the increased production and utilization of PET anticipated in coming years, the interest in and need for efficient PET recycling will most certainly increase. Recycling of PET can be performed in three different ways: primary, secondary, and tertiary recycling.[3] In primary recycling, the scrap material in a plant is recycled without introducing contaminants and may be processed with virgin material to ensure product quality.[3] In secondary recycling, post-consumer PET is separated from other polymers or paper via grinding and washing prior to melt-processing. The products of secondary recycling are used mostly in fiber, sheet and film applications. In addition, the properties deteriorate in each stage as the molecular weight is reduced because of residual contaminants. Tertiary recycling involves the depolymerization of PET to its monomeric or oligomeric precursors, depending on the depolymerization route employed. Depolymerization of PET can be conducted via methanolysis, glycolysis, aminolysis, ammonolysis, and hydrolysis.[3] Repolymerization of oligomers or monomers after suitable purification then allows the use of rPET in food and beverage packaging in conjunction with virgin PET.
5
of a combination of secondary and tertiary recycling methods. The recycling process starts with the acquisition of bales of recycle-designated solid waste from municipalities. Bottles and containers manufactured from PET are separated from other waste in a state-of-the-art process line and then chopped into small flakes. After removal of labels and other polymers, the PET flakes are exposed to caustic solution. Chemical degradation of PET in the caustic solution is restricted to only the outermost surface of the flakes, in marked contrast to thorough degradation of PET in the presence of amines. The flakes are then decontaminated at elevated temperatures, rinsed/neutralized, dried, and packaged. This route allows selective removal of just a thin layer of PET, along with other impurities, from flakes during recycling, instead of depolymerizing entire flakes to recover monomer that can be subsequently repolymerized at a significant energy cost. The UnPET process employs multiple separation and quality-control steps to ensure food-grade rPET and reaps the benefit of high throughput and energy savings while conserving important natural resources, such as water. With this process, approximately 5% of the rPET is depolymerized and the remaining rPET flakes are suitable for producing food-grade packaging. Depolymerization of only 5% of rPET saves the additional depolymerization and separation cost (of the monomers and oligomers) and repolymerization cost.
6
1.2, the average CO2 retention times are plotted for rPET produced from different manufacturers using different virgin resins at different rPET loading levels. The tests and feedback from the customers demonstrated that the main problem was encountered when rPET was mixed and processed with ―virgin‖ PET (vPET) to yield inferior CO2 retention.[4] In this application, an important challenge is the improvement of the barrier properties of rPET, which can be achieved through the development of polymer nanocomposites consisting of nanoscale inorganic species dispersed within a polymer matrix.
7
As mentioned earlier, incorporation of impermeable flakes into the polymer matrix generates tortuous diffusion paths that must be traversed by a diffusing species. Nielsen[8] expressed the tortuosity factor ( ) as the ratio of the actual distance that a permeant travels (d') to the shortest distance that it would travel in the absence of a tortuous path (d), viz.,
=d '
d 1
L
2W f (1.1)
where L is the flake length, W is the flake thickness and f denotes the volume fraction of
filler. It can thus be shown that tortuosity affects permeation according to Pc
Pp =
p
1+ L 2W f (1.2)
where Pc and Pp represent the permeabilities of the composite and unfilled polymer,
respectively, and p is the volume fraction of polymer (= 1 f). Equations (1.1) and (1.2)
reveal that the permeation of the gas molecules in a polymer nanocomposite depends on the size, geometry, and spatial orientation of the platelets in the polymer matrix.[6, 9] Because of the high aspect ratio of clay platelets, only a small amount of clay is required to decrease the permeation through PCNs.[6, 9-11] Improvement of gas barrier properties of PCNs has been previously investigated through both experiment[6, 9, 10] and modeling.[12, 13]
8
montmorillonite.[5, 11, 14-16] In general, PCNs possessing only a minute amount of homogenously distributed clay sheets with high aspect ratios (nanometer in thickness and micrometer in lateral dimension) have been shown to exhibit improved gas barrier properties, mechanical strength, and heat distortion temperature, as well as flame retardancy, without affecting adversely polymer transparency.[5] Subsequently, other methods of fabricating PCNs have been developed, including solution intercalation and melt compounding.[5]
Numerous reports in the literature address the preparation of PET/clay nanocomposites and investigate their characteristics. Methods utilized for fabricating PCNs include: 1) in-situ interlayer polymerization[17-23], 2) solution intercalation[24-26],and 3) melt intercalation.[27, 28] The characteristics of PCNs examined include barrier[18, 21, 29], mechanical[17-19, 21, 22, 25, 26,
29-32]
and thermalproperties[17-21, 23-26, 30, 32, 33], in addition to the effect of added clay on polymer crystallization.[17, 20, 24, 27] Thus far, PET/clay nanocomposites have been formed by conventional ways (i.e., via in-situ interlayer polymerization, solution and melt intercalation) by using organically-modified clays. This class of clay includes natural clay modified with organic surfactants to improve the compatibility of the clay platelets with nonpolar polymer matrices. We plan to generate rPET/clay nanocomposites by two different protocols in this study: 1) utilizing the functional groups on the surface of rPET for the attachment of dispersed natural clay platelets, and 2) mechanical alloying of rPET flakes with natural clay.
9
clay particles, since increased electrostatic interaction will result in enhanced deposition and stronger attachment of discrete clay platelets to the rPET surface. Through the targeted use of specialty polymers and surface-initiated polymerization methods, the surface of rPET can be rendered hydrophilic, which permits attachment of various inorganic species, such as natural nanoclay (and, for that matter, non-functionalized metal or metal oxide nanoparticles), to functionalize rPET for a wide variety of high-end applications. In addition, the increase in the roughness of the rPET surface due to recycling will increase the number of sites available for clay platelet attachment. In the second approach undertaken, high-energy mechanical alloying performed at ambient temperature will be performed to disperse the clay platelets throughout rPET. In this manner, clay platelets and polymer particles will be repeatedly fractured, elongated and sheared as they collide during vibration.
10
1.3. SURFACE MODIFICATION OF SILICONE ELASTOMER
NETWORKS
11
12
facilitate the diffusion of uncross-linked PDMS oligomers to the surface, which likewise alters the initial hydrophilic state.[40-44]
In addition to plasma treatment, UVO has also been employed to increase the surface hydrophilicity of PDMS.[37, 38, 45-47] The UVO treatment involves a photosensitized oxidation process wherein the molecules of a treated material are excited and/or dissociated by the absorption of short-wavelength UV radiation. Atomic oxygen is simultaneously generated when molecular oxygen is dissociated by radiation with a wavelength ( 1) of 184.9 nm and ozone by radiation at 2 = 253.7 nm.[48] The radiation at 253.7 nm is absorbed by most hydrocarbons, as well as by ozone. The organic products of this excitation react with atomic oxygen to form simpler, volatile molecules that desorb from the surface. Therefore, when both radiation wavelengths are present, atomic oxygen is continuously generated, and ozone is continually formed and destroyed. Compared to plasma treatment, UVO treatment is a milder type of physical modification that yields similar surface changes but with an approximate order of magnitude increase in processing time. This allows for better control of surface conversion, since different degrees of hydrophilicity will be achieved for different UVO exposure times. Therefore, we intend to utilize UVO to render SENs more hydrophilic.
originally-13
soft SEN surface. While most UVO-modification studies involving SENs have been conducted with PDMS, Efimenko et al.[37] recently reported results from UVO treatment of poly(vinylmethylsloxane) (PVMS), whose higher susceptibility to UVO reduces treatment time and increases chemical tailorability to retain soft, hydrophilic SENs. They have provided experimental evidence that brief UVO treatment times (seconds to a few minutes) are sufficient to form highly hydrophilic PVMS surfaces compared to UVO treatment of PDMS, the surface of which becomes hydrophilic only after prolonged UVO exposure.
14
of the synthesized (co-)polymer results in smooth and uniform coatings on a variety of substrates, including, but not limited, PDMS-based SEN, PET, polyethylene, polypropylene, polyamide, polyimide, glass, and silica. The hydrolysis of the TCS groups in the presence of moisture produces cross-linking, which increases the stability of the coatings. The mechanical properties and thickness of such coatings can be altered by tuning the extent of TCS coupling and/or the concentration of copolymer in the spin-coating solution. Chapter 6 summarizes the design, application and characterization of functional coatings based on PVMS layers on various substrates such as PET and PDMS.
1.4. SYNTHESIS OF FUNCTIONAL COPOLYMERS AND
POST-POLYMERIZATION MODIFICATION REACTIONS
FOR WATER PURIFICATION
15
16
1.5. REFERENCES
[1] Plastic Business Data and Charts The Association of German Plastics Manufacturers,
2004.
[2] F. Pardos, Vol. 2010, http://www.pardos-marketing.com/paper_e03.htm, 2006. [3] G. P. Karayannidis, D. S. Achilias, Macromolecular Materials and Engineering
2007, 292, 128.
[4] R. Martin, The Water and Resources Action Programme, England 2006. [5] S. S. Ray, M. Okamoto, Progress in Polymer Science 2003, 28, 1539.
[6] K. Yano, A. Usuki, A. Okada, T. Kurauchi, O. Kamigaito, Journal of Polymer Science Part A: Polymer Chemistry 1993, 31, 2493.
[7] K. Masaya, Journal of Polymer Science Part A: Polymer Chemistry 2004, 42, 819. [8] N. P. Patel, A. C. Miller, R. J. Spontak, Advanced Materials 2003, 15, 729.
[9] T. Lan, P. D. Kaviratna, T. J. Pinnavaia, Chemistry of Materials 1994, 6, 573. [10] K. Yano, A. Usuki, A. Okada, Journal of Polymer Science Part A: Polymer Chemistry 1997, 35, 2289.
[11] E. P. Giannelis, Advanced Materials 1996, 8, 29. [12] R. K. Bharadwaj, Macromolecules 2001, 34, 9189.
[13] A. A. Gusev, H. R. Lusti, Advanced Materials 2001, 13, 1641.
[14] C. E. Powell, G. W. Beall, Current Opinion in Solid State and Materials Science
2006, 10, 73.
17
[17] Y. Ke, C. Long, Z. Qi, Journal of Applied Polymer Science 1999, 71, 1139. [18] Z. Ke, B. Yongping, Materials Letters 2005, 59, 3348.
[19] J. H. Chang, S. J. Kim, Y. L. Joo, S. Im, Polymer 2004, 45, 919.
[20] Y. C. Ke, Z. B. Yang, C. F. Zhu, Journal of Applied Polymer Science 2002, 85, 2677. [21] T. Y. Tsai, C. H. Li, C. H. Chang, W. H. Cheng, C. L. Hwang, R. J. Wu, Advanced Materials 2005, 17, 1769.
[22] Y. Imai, S. Nishimura, E. Abe, H. Tateyama, A. Abiko, A. Yamaguchi, T. Aoyama, H. Taguchi, Chemistry of Materials 2002, 14, 477.
[23] J. H. Chang, S. J. Kim, Polymer Bulletin 2004, 52, 289.
[24] C. F. Ou, M. T. Ho, J. R. Lin, Journal of Applied Polymer Science 2004, 91, 140. [25] J. H. Chang, D. K. Park, Polymer Bulletin 2001, 47, 191.
[26] J. H. Chang, D. K. Park, Journal of Polymer Science Part B: Polymer Physics 2001, 39, 2581.
[27] I. Y. Phang, K. P. Pramoda, T. Liu, C. He, Polymer International 2004, 53, 1282. [28] A. Sanchez-Solis, I. Romero-Ibarra, M. R. Estrada, F. Calderas, O. Manero. [29] D. J. Sekelik, E. V. Stepanov, S. Nazarenko, D. Schiraldi, A. Hiltner, E. Baer, Journal of Polymer Science Part B: Polymer Physics 1999, 37, 847.
[30] A. Sanchez-Solis, I. Romero-Ibarra, M. R. Estrada, F. Calderas, O. Manero, Polymer Engineering and Science 2004, 44, 1094.
[31] U. Gurmendi, J. I. Eguiazabal, J. Nazabal, Macromolecular Materials and Engineering 2007, 292, 169.
[32] M. T. M. Bizarria, A. L. F. D. M. Giraldi, C. M. de Carvalho, J. I. Velasco, M. A. d'Avila, L. H. I. Mei, Journal of Applied Polymer Science 2007, 104, 1839.
18
[34] A. E. Ozcam, K. Efimenko, C. Jaye, R. J. Spontak, D. A. Fischer, J. Genzer, Journal of Electron Spectroscopy and Related Phenomena 2009, 172, 95.
[35] M. J. Owen, Industrial & Engineering Chemistry Product Research and Development
1980, 19, 97.
[36] S. J. Clarson, J. A. Semlyen, R. G. Jones, W. Andåo, J. Chojnowski, - Prentice Hall polymer science and technology series.
[37] K. Efimenko, J. A. Crowe, E. Manias, D. W. Schwark, D. A. Fischer, J. Genzer, Polymer 2005, 46, 9329.
[38] K. Efimenko, W. E. Wallace, J. Genzer, Journal of colloid and interface science
2002, 254, 306.
[39] M. H. Jin, X. J. Feng, J. M. Xi, J. Zhai, K. W. Cho, L. Feng, L. Jiang, Macromolecular Rapid Communications 2005, 26, 1805.
[40] H. Hillborg, J. F. Ankner, U. W. Gedde, G. D. Smith, H. K. Yasuda, K. Wikstrom, Polymer 2000, 41, 6851.
[41] H. Hillborg, U. W. Gedde, Polymer 1998, 39, 1991.
[42] H. Hillborg, U. W. Gedde, Ieee Transactions on Dielectrics and Electrical Insulation
1999, 6, 703.
[43] H. Hillborg, S. Karlsson, U. W. Gedde, Polymer 2001, 42, 8883. [44] H. Hillborg, M. Sandelin, U. W. Gedde, Polymer 2001, 42, 7349. [45] J. Genzer, K. Efimenko, Science 2000, 290, 2130.
[46] M. Ouyang, R. J. Muisener, A. Boulares, J. T. Koberstein, Journal of Membrane Science 2000, 177, 177.
[47] M. Ouyang, C. Yuan, R. J. Muisener, A. Boulares, J. T. Koberstein, Chemistry of Materials 2000, 12, 1591.
[48] J. R. Vig, Journal of Vacuum Science & Technology A: Vacuum, Surfaces, and Films
19
1.6. FIGURES
1950 1960 1970 1980 1990 2000
0 50 100 150 200
P
ol
ym
er
produ
ct
ui
on
(
m
ill
ion
t
on
s)
Year
Other Agriculture Household goods Furniture Electrical Vehicle Construction Packaging 24.5% 9.0% 7.5% 7.0% 4.5% 2.0% 16.0% 29.5%20
21
Si
O
Si
O
O
Si
O
Si
O
R
R
R
R
R
R
R
R
=110
=143
o
o
L=
1.64 O
Figure 1.3. The silicone backbone with the bond angles ( ) and the bond length (L) identified. If both R groups are methyl, the polymer is referred to as poly(dimethylsiloxane)
22
23
R
1N
S O
R
224
CHAPTER 2: MODIFICATION OF POLY(ETHYLENE
TEREPHTHALATE) (PET) SURFACES WITH
SELF-ASSEMBLED MONOLAYERS OF ORGANOSILANE
PRECURSORS
2.1. INTRODUCTION
Since its discovery in the 1940s, poly(ethylene terephthalate) (PET) has become one of the most important and widely-used thermoplastic polymers.[1] Its high tensile and impact strength, adequate CO2 retention, chemical resistance, optical clarity, processability, and design flexibility have expedited commercial use of PET in a wide variety of applications including, but not limited to, high-value/low-cost consumables (i.e., textile fibers, beverage bottles, jars, tire cords, audio tapes, and photographic film). PET is also an ideal candidate for futuristic applications such as a substrate material for flexible electronic circuits. Among all thermoplastics and engineering polymers, PET has experienced the largest growth rate - its overall worldwide consumption reaching 9.1 million tons in 2003 - and is expected to hit nearly double this production level by 2010.[2]
25
glycolysis[7]) and physical modification (e.g., plasma[11,12], ultraviolet/ozone[12-16], flame[12], corona treatments[12,17,18], electrical discharge[19], ion beam bombardment[20], laser treatment[21], surface physical interpenetrating network formation[22], and surface graft polymerization after activation of the PET surface).[3,10] Since most of these surface modification techniques purposefully or inadvertently involve polymer degradation, careful selection of experimental conditions is imperative to the successful surface modification of PET without degrading the bulk polymer and its desirable property attributes.
26
from polymer to polymer, the concentration of hydrophilic groups, such as –COOH or –OH, at or near the surface generally increases dramatically for all polymers. In addition to these surface-anchored, high-surface-energy moieties and some volatile components (i.e., CO2), UVO treatment may "leave behind" a residual layer composed of hydrophilic low-molecular-weight organic molecules (LMWOCs). The LMWOCs represent non-volatile components that can be removed by washing the surface with an appropriate solvent, including water.[13,14]
Modification of PET surfaces by UVO treatment has been investigated previously by Walzak et al.[12-14] and Bradley et al.[15,16], who explored the effect of UVO treatment time on PET surface energy[13-16], chemical composition[13-16], topography[15,16], and aging.[13] They reported an increase in the wettability of PET surfaces that was accompanied by an increase in surface oxygen concentration and roughening with increasing UVO treatment time. In addition, they demonstrated increases in contact angle and carbon concentration after washing the UVO-treated PET specimens with water and/or aging the sample. These increases were attributed to removal of LMWOCs formed during UVO treatment and migration of hydrophilic moieties to the bulk of the sample. In this work, we modify the surface of PET by UVO treatment as a preparatory step that enables more general chemical
tailorability of PET surfaces. Specifically, UVO-modified PET surfaces are shown to exhibit
a large number of hydrophilic moieties that can serve as attachment points for organosilane
molecules (OS). We demonstrate here the applicability of this technique by attaching
27
PET substrates and report on the physico-chemical characteristics of SFOS SAMs attached to
the surface of PET films.
2.2. EXPERIMENTAL
2.2.1. FILM PREPARATION
28
2.2.2. ULTRAVIOLET/OZONE (UVO) TREATMENT
The UVO treatment of PET surfaces was performed in a commercial UVO chamber (Jelight Company, Inc., model 42). The standard fused quartz lamp, which, according to the manufacturer, emits about 65% of the total radiation at 184.9 nm and has an output of 28 mW/cm2 at a distance 6 mm away from the source, was used in this study. The PET films were placed onto glass slides, which were subsequently inserted into the UVO cleaner at a distance of about 5 mm from the UV source and exposed to UVO radiation from one side only for predetermined periods of time.
2.2.3. SEMIFLUORINATED SELF-ASSEMBLED MONOLAYER
FORMATION
29
2.2.4. WATER CONTACT ANGLE MEASUREMENTS
Contact angle measurements were performed via the sessile drop technique with DIW (the resistance was >15 M .cm) using a Ramé-Hart contact angle goniometer (Model 100-00) equipped with a CCD camera. Images were analyzed with the Ramé-Hart Imaging 2001 software. Static contact angles (S-CAs) were determined upon placement of an 8 L droplet of DIW on the specimen surface. To measure the advancing and receding contact angles (A-CAs and R-(A-CAs, respectively), a probe droplet was added (2 L, DIW advancing) or removed (4 L DIW, receding) and analyzed. Contact angles were measured on 3 to 5 independent spots on each sample and the results were averaged. The corresponding contact angle hysteresis (CAH), defined as the difference between the A-CA and R-CA, was likewise evaluated as a measure of the chemical and structural homogeneity of the surface probed.
2.2.5. ATOMIC FORCE MICROSCOPY
30
2.2.6. ELLIPSOMETRY
The thicknesses of spun-cast PET films were measured with a variable-angle spectroscopic ellipsometer (VASE) manufactured by J.A. Woollam Co. Ellipsometry measures the difference in the polarization state between the light beams incident onto and reflected from the surface thus providing information about the dielectric properties and thickness of the film. The thickness of the films was evaluated using a single layer Cauchy model (Si/SiOx/PET, index of refraction of PET was n=1.5751 at 630 nm) before and after the UVO treatment, as well as after sonication, rinsing with DIW and drying with nitrogen gas, a procedure during which LMWOC debris gets removed from the PET-UVO specimens. Unless otherwise specified, ellipsometric data were collected at an incidence angle of 70° to the surface normal at wavelengths ranging from 400 to 1100 nm in 10 nm increments.
2.2.7. X-RAY PHOTOELECTRON SPECTROSCOPY
31
2.2.8. NEXAFS SPECTROSCOPY
32
2.3. RESULTS AND DISCUSSION
As mentioned earlier, the atomic oxygen generated during UVO treatment reacts rapidly with various chemical functionalities present on the material surface and breaks polymer chains into smaller molecular fragments. While volatile species (i.e., CO2) escape readily during this process, the heavier LMWOC fractions remain as deposits on the polymer surface and can be removed by water rinsing or sonication. The sample thickness changes associated with UVO treatment and washing processes are monitored in this study by ellipsometry. In Figure 2.1, the thickness change upon UVO treatment (Figure 2.1a) and the water sonication step (Figure 2.1b) are plotted as functions of UVO treatment time. From these data, it is apparent that the amount of material removed during UVO exposure increases steadily at a rate of 4.5 nm/min. The quantity of LMWOCs removed by sonication increases with increasing UVO treatment time and saturates at around 12 min, corresponding to a thickness of 22 nm. These results reveal that the overall rate of PET removal is 6 nm/min (Figure 2.1c).
![Figure 1.1. Production rate of plastics and distribution of polymer usage areas.[1]](https://thumb-us.123doks.com/thumbv2/123dok_us/1737790.1222269/43.612.117.500.155.452/figure-production-rate-plastics-distribution-polymer-usage-areas.webp)
![Figure 1.2. CO2 retention times of the bottles produced from rPET and vPET.[4]](https://thumb-us.123doks.com/thumbv2/123dok_us/1737790.1222269/44.612.97.535.85.392/figure-co-retention-times-bottles-produced-rpet-vpet.webp)