A North Carolina Sign Study:
Sign Count Approximation Using Field Inventory
Sampling and Calculated Sign Densities: Analysis,
Improvements, and Methods
Technical Report
Department of Civil Engineering
North Carolina State University
May 2001
By
Table of Contents
LIST OF TABLES
……… iv
LIST OF FIGURES
……….. v
1.0 INTRODUCTION
……….. 11.1
Background ……… 1
1.2
Previous Work ………... 1
1.3 Purpose ……….. 2
2.0 METHODOLOGY
………. 4
2.1 Primary Route Improvements ……… 4
2.1.1 Welcome Centers .
………..…….. 4
2.1.2 Visitor Centers
………. 4
2.1.3 Rest Areas
……….. 4
2.1.4 Truck Weigh Stations
………. 6
2.2 Secondary Route Extensions ………. 7
2.2.1 Methodology
……….. 7
2.2.2 Count Verification Study
……… 10
2.2.3 Parallel Facing Signs
………. 12
2.2.4 Divided Secondary Roads
……….. 15
2.2.5 Excluded Signs
……… 16
2.2.6 Damaged Signs
……… 17
2.2.7 Split Exits
……….. 17
2.2.8 Dead Ends
………. 18
2.2.9 Urban Issues
……… 19
3.0 RESULTS
……… 20
3.1 Primary Route Improvements ………... 20
3.1.1 Rest Areas, Welcome Centers and Visitor Centers
……….. 20
3.1.2 Truck Weigh Stations
………... 21
3.2 Secondary Route Extensions ………. 22
3.2.1 Total Number of Signs
………. 24
3.2.2 Number of Signs by Color
……… 24
3.3 Count Totals of Both Studies ……….… 25
4.0 CONCLUSIONS
……… 29
4.1 Comparison of Primary and Secondary Totals ……….. 29
4.2
Primary Route Extensions ……….. 29
4.4.1 Comparison of Rural and Urban Secondary Routes
………. 30
4.4.2 Comparison of Type I Rural and Type II Rural Routes
………. 31
4.4 Sign Reflectivity Implications ……….. 31
4.4.1 Other Observations
………... 32
4.5 Summary ……….. 33
4.6 Bullet Points ………. 33
5.0 RECOMMENDATIONS
………. 34
5.1 An Alternate Sampling Approach ……….. 34
5.2 Determining a Representative Sample Size ………... 35
5.3 Geographic Coverage ………. 35
5.4 Further Extensions ………. 36
6.0 REFERENCES
……… 37
Appendix A: County Summary Table
Appendix B: Secondary Road Sign Density Tabulation Tables
Appendix C: Secondary Road Sign Count Tabulation Tables
Appendix D: Secondary Road Individual Sign Count Tables
Appendix E:
County and Statewide Secondary Road Number of Total
Signs Estimate
List of Tables
Table 2.1 North Carolina Interstate Highway Rest Area System ……….. 5
Table 2.2 North Carolina Highway Route Rest Area System ……… 6
Table 2.3 North Carolina Permanent Truck Weigh Stations ……….. 7
Table 2.4 Sign Background Color Descriptions ………. 8
Table 2.5 Examples of Sign Types by Color ………. 8
Table 2.6 County Mileages ………. 10
Table 2.7 Count Verification Study Field Data ……….. 11
Table 2.8 Count Verification Study Summary ……….. 12
Table 2.9 Secondary Road Mileages by Road Structure ……… 16
Table 3.1 Number of Signs Counted in Rest Areas by Color ……… 20
Table 3.2 Total Number of Signs Estimated in Rest Areas by Color ………. 21
Table 3.3 Number of Signs Counted at Truck Weigh Stations by Color ………... 21
Table 3.4 Total Number of Signs Estimated at Truck Weigh Stations by Color ………21
Table 3.5 County Sign Density Summary ……….. 22
Table 3.6 County Classifications ……… 23
Table 3.7 Statewide Secondary Road Estimate of Total Number of Signs ……… 24
Table 3.8 Statewide Secondary Road Sign Estimate by Color ……….. 25
Table 3.9 Color Sign Densities for Secondary Routes ………... 25
Table 3.10 Total Number of Signs in North Carolina ……… 26
Table 3.11 Total Number of Interstate Signs in North Carolina ……… 26
Table 3.12 Total Number of US Route Signs in North Carolina ……… 27
Table 3.13 Total Number of NC Route Signs in North Carolina ………... 27
Table 3.14 Total Number of Secondary Road Signs in North Carolina ………. 27
Table 3.15 Composition of Primary and Secondary Routes ……….. 27
List of Figures
Figure 2.1 Wrong Way Sign ………... 9
Figure 2.2 Parallel Signs ………. 12
Figure 2.3 Parallel Signs Continued ………... 14
Figure 2.4 One-Way Signs on Divided Primary Routes ……… 15
Figure 2.5 Hotel Signs ……… 16
Figure 2.6 Street Signs and Directional Markers ……… 17
Figure 2.7 Split Exits ……….. 18
Figure 2.8 Dead Ends ……….. 18
1.0 INTRODUCTION
1.1 Background
Road signs are an integral part of North Carolina’s roadway infrastructure. The North Carolina
Department of Transportation (NCDOT) has the primary responsibility for the design, erection,
and maintenance of these signs. Maintenance responsibilities include replacing signs that are
stolen, damaged, or deficient in some manner. One way a sign can become deficient is through
the loss of its reflective properties. Without these reflective properties, a sign is very difficult to
see during nighttime driving. This difficulty increases as the speed of the observer increases.
Virtually every sign made by the NCDOT is constructed with reflective sheeting. As a motorist
drives down the road, light from their headlights hits the sheeting and is reflected back towards
the driver’s automobile. This reflectivity enables the motorist to clearly see the sign. But over
time the reflective properties of a sign gradually diminish, making it more difficult to see the sign
during nighttime driving.
The Federal Highway Administration (FHWA) is expected to release minimum levels for sign
retroreflectivity in the near future [Vereen 2002]. The NCDOT will be responsible for adhering
to these this new standard. The purpose of this standard is to ensure that all roadway signs are
adequately visible at night, thus making nighttime travel safer. The NCDOT is therefore
concerned with performing its sign management programs in an efficient manner to both meet the
standard and promote safety. There are many strategies that the NCDOT may employ in response
to the evolving regulations, but an assessment of cost and liability cannot be made without
knowing how many signs the Department is responsible for. The NCDOT has only a general
estimate of the number of signs it maintains. The purpose of this study is to determine a more
accurate estimate of the number of NCDOT maintained signs in North Carolina.
1.2 Previous Work
A previous study, titled “Sign Count Approximation Using Field Inventory Sampling and
Calculated Sign Densities” initially undertook the sign counting effort [Kirtley 2001]. This study
estimated the number of road signs along North Carolina primary routes (Interstates, US Routes,
Due to the vast number of roadway miles, it was not logistically feasible to physically drive every
mile of roadway and individually count each sign. The study team therefore needed to develop a
sampling approach that was both feasible and accurate. It was decided that a sign density
approximation method met both of these criteria. This method counted sings along representative
sample sets of primary roads and used the number of signs and miles driven to determine a
representative sign density. Total roadway mileages are already known by the NCDOT, and all
the study needed to do was determine an average number of signs per mile.
To ensure a reasonable amount of accuracy, the Kirtley study initially anticipated that signs on
approximately 40% of Interstate, 20% of U.S. Route, and 5% of N.C. Routes would need to be
physically counted. These targets, for all intents and purposes, were met. The study actually
counted signs on 55.2% of Interstates, 12.3% of US Routes, and 5.2% of NC Routes. Once these
counts were finished, the data was compiled to find an average sign density. The study identified
road location, road structure, and road type as three factors that could possibly affect the sign
densities. Roadway sample sections were chosen as to very these factors, and thereby limit the
amount they could possibly influence the data.
The Kirtley study used sign color as the basis for identifying and counting signs. Sign color was
chosen because is an easily identifiable sign property and also relates to the sign’s intended
purpose and function. Signs of similar functions typically have the same color to aide motorists
in identifying signs and in understanding their meaning and intent. Seven color types were
identified in the Kirtley study. An eighth category was added for stop signs. Since stop signs
represent greater liability than the average road sign, they were counted separately.
1.3 Purpose
The purpose of this study is provide a more accurate total sign count by improving and extending
the previous study. Improvements on the Kirtley study essentially fill in the gaps of the previous
counts. This includes counting special areas that were not tallied in previous counts, such as rest
areas, and truck weigh stations. Extensions include counts of secondary roadways, which were
not completed in the previous study. Secondary roads are a type of roadway maintained by the
NCDOT, but are not considered Interstate, US Route, or NC Route. There are approximately
maintained by the NCDOT. This report also offers recommendations to improve the sign
2.0 METHODOLOGY
2.1 Primary Route Improvements
In order to obtain a more accurate estimate of the number of NCDOT maintained signs, it was
necessary to examine the Kirtley study to see if ways to improve the count could be discovered.
The previous sign count methodology primarily focused on road specific signs and did not
include NCDOT maintain areas supporting these roads. This includes areas such as welcome
centers, visitor centers, rest areas, and truck weigh stations. These areas were therefore visited
and included in the present study.
2.1.1 Welcome Centers
Welcome centers are part of North Carolina’s rest area system, and are located on Interstates
close to state borders. The purpose of a welcome center is to provide information resources
concerning North Carolina to travelers. There are seven welcome centers in North Carolina, and
their primary function is to provide both a resting area for motorists and statewide information to
tourists [NCDOT Rest Areas]. Signs in and near welcome centers are maintained by the
NCDOT, but these were not counted in the Kirtley study. Since welcome centers are essentially
Interstate rest areas that contain a small information office, it was assumed that their average sign
density would not be significantly different from that of an average Interstate rest area. For this
reason, signs for Interstate welcome centers were estimated as if they were Interstate rest areas.
2.1.2 Visitor Centers
Visitor centers are much like welcome centers except they are located on US Routes. There are
eight visitor centers in North Carolina [NCDOT Rest Areas]. Since they too are essentially rest
areas with a small information office, they have also been counted as if they were simply US
Route rest areas.
2.1.3 Rest Areas
Rest areas are located along Interstates, US Routes, and NC Routes. The purpose of rest areas is
to allow travelers a location to rest during their journey. In the Kirtley study, signs in rest areas
were not counted. But rest areas do contain signs maintained by the NCDOT, and therefore, they
Carolina rest areas. In Table 3.1 rest areas that contain welcome centers are also identified. In
Table 2.2, the rest areas with visitor centers are shown. In all, North Carolina has a total of 47 rest
areas, 8 welcome centers, 7 visitor centers
Milepost Milepost
I-95 Northbound Lane I-77 Southbound Lane
5 Robeson, 5mi. north of S.C. (Welcome Center) 106 Surry, at V.A. / N.C. line (Welcome Center) 47 Cumberland, 1 mi. south of Fayetteville 63 Iredell, 4 mi. north of Mooresville 99 Johnston, 2 mi. north of Selma 39 Iredell, 1 mi. south of U.S. 421
142 Nash, 1.5 mi. north of Dortches
I-40 Eastbound Lane
I-95 Southbound Lane 10 Haywood, 10.5 mi. east of T.N. (Welcome Center)
181 Northampton, 5 mi. south of V.A. (Welcome Center) 82 McDowell, 1 mi. west of Marlon 142 Nash, 1.5 mi. north of Dortches 136 Catawba, 10 mi. east of Hickory 99 Johnston, 2 mi. north of Selma 177 Davie, 18 mi. west of Winston-Salem 47 Cumberland, 1 mi. south of Fayetteville 324 Johnston, 1 mi. north of U.S. 301, near Benson
364 Duplin, at N.C. 24 near Warsaw
I-85 Northbound Lane
2 Cleveland, 2 mi. north of S.C. (Welcome Center) I-40 Westbound Lane 59 Cabarrus, 1mi. north of Concord 364 Duplin, at N.C. 24 near Warsaw 99 Davidson, 1 mi. southwest of Thomasville 324 Johnston, 1 mi. north of U.S. 301, near Benson 139 Alamance, 3 mi. west of Burlington 177 Davie, 18 mi. west of Winston-Salem 199 Granville, 6 mi. south of Oxford 136 Catawba, 10 mi. east of Hickory
82 McDowell, 1 mi. west of Marlon
I-85 Southbound Lane 10 Haywood, 10.5 mi. east of T.N.
231 Warren, 2 mi. south of V.A. (Welcome Center)
199 Granville, 6 mi. south of Oxford I-26 Eastbound Lane
139 Alamance, 3 mi. west of Burlington 10 Buncombe, 12 mi. east of Asheville
99 Davidson, 1 mi. southwest of Thomasville
59 Cabarrus, 1mi. north of Concord I-26 Westbound Lane
5 Cleveland, 2 mi. south of Kings Mountain 36 Polk, 3 mi. north of S.C. (Welcome Center)
10 Henderson, 12 mi. east of Ashville
I-77 Northbound Lane
1 Mecklenburg, 1.5 mi. north of S.C. (Welcome Center)
39 Iredell, 4 mi. north of Mooresville
72 Yadkin, 1 mi. south of U.S. 421
Table 2.1 North Carolina Interstate Highway Rest Area System [NCDOT Rest Areas]
A sign density estimation method was used to account for the total number of signs in rest areas.
Signs were counted at 7 rest areas (4 Interstate, 2 US Route, and 1 NC Route), as shown in Table
3.1. The results of these counts were complied to find an average sign density for an individual
rest area. This average density was then multiplied by the total number of rest areas in North
Table 2.2 North Carolina Highway Route Rest Area System [NCDOT Rest Areas]
Some Interstate rest areas have two separate stops at the same location, one on each direction of
travel. In these cases, the sign count methodology treated each side as a separate stop.
2.1.4 Truck Weigh Stations
The NCDOT owns, operates, and maintains truck weigh stations. A weigh station typically
consists of a set of weight scales, a staging area for inspection, an enforcement office, and a set of
entrance and exit roadways. The size and scope of each of these areas may vary based upon the
NCDOT’s needs. There are a total of 10 permanent truck weigh stations in North Carolina; 8 of
them are located along Interstates and the other 2 are located along US Routes [NCDOT Weigh
Stations]. A list of the location of these truck weigh stations is shown in Table 2.3.
It was assumed that Interstate weigh stations would be larger than those along US Routes
because of the greater volume of shipping traffic along Interstates. It was thought that the
increased weigh station size would naturally lead to an increased number of signs, thereby
making the Interstate average different from the US Route average. The number of signs at
Interstate and US Route weigh stations were therefore separately counted and estimated.
As with rest areas, a sign density estimation method was also used to account for the total number
of signs in truck weigh stations. Signs were counted at 2 Interstate and 1 US Route weigh
Route # Route #
US Routes US Routes
17 Camden, 1 mi. south of V.A. (Visitor Center) 158 Dare, at Kitty Hawk (Visitor Center) 17 Craven, 11 mi. north of New Bern 220 Richmond, 1 mi. north of Ellerbe 17 Brunswick, at Shallotte (Visitor Center) 221 Wartauga, 2 mi. west of Blowing Rock 19A/129 Cherokee, at S.R. 1388 near Andrews 221 McDowell, at S.R. 1195 (Visitor Center) 23/74 Haywood, 1 mi. north of Blue Ridge Pkwy. 258 Hertford, 1 mi. west of Blowing Rock 29 Caswell, 2 mi. south of V.A. (Visitor Center) 264 Hyde, at Englehard 64 Washington, at Plymouth 421 Sampson, 10 mi. south of Clinton 64 Tyrrell, at Columbia (Visitor Center) 421 Watauga, at Deep Gap, 8 mi. east of Boone 64/264 Dare, 2 mi. west of Manteo 441/23 Macon, 4 mi. south of Franklin (Visitor Center)
70 Craven, at S.R. 1225 near Clarks
70 Carteret, at Morehead City (Visitor Center) NC Route
158 Currituck, 1.5 mi. south of Coinjock 705 Moore, south of Westmoore
stations. The results of these counts were assumed to be representative of other North Carolina
weigh stations. Using these totals, these figures were then multiplied by the total number of signs
in weigh stations was estimated.
Table 2.3 North Carolina Permanent Truck Weigh Stations [NCDOT Weigh Stations].
2.2 Secondary Route Extensions
In addition to the Kirtley primary route study, it was necessary to perform a secondary route
survey to complete the estimate of the total number of NCDOT maintained signs. The main
contribution of this study is these secondary route results. The methodology used and the key
assumptions made during this secondary road count are detailed in this section.
2.2.1 Methodology
Color
Many of the methods used in this study are intended to mirror those of the Kirtley study so that a
reasonable comparison can be made between the results of both studies. For example, sign color
was determined to be the most efficient way to count signs in the Kirtley study. Sign color was
therefore used as the method to count signs along secondary roads.
Asheville (Buncombe County) Hillsborough (Orange County)
I-40, approximately 12 miles west of Asheville I-40 / I-85, approximately 15 miles west of Durham
Charlotte (Mecklenburg County) Kinston (Lenoir County)
I-85, approximately 10 miles southwest of Charlotte US 70 and US 258, within the city limits of Kinston
Halifax (Halifax County) Lumberton (Robeson County)
I-95, approximately 18 miles south of Roanoke I-95, approximately 10 miles north of Lumberton
Hendersonville (Henderson County) Mount Airy (Surry County)
I-26, approximately 7 miles north of Hendersonville I-77, approximately 3 miles south of the Virginia state line
Hertford (Perquimans County) Statesville (Iredell County)
US 17, approximately 7.5 miles south of Elizabeth City I-40, approximately 6 miles west of Statesville
The reason that sign color was initially used in the Kirtley study is that counting and recording
the specific nature and type of each individual sign along the roadway would be impractical.
There are hundreds of different types of signs; there are far fewer colors. Sign color was found to
be an efficient way to classify signs because it relates to the underlying function of a sign and it is
easily identifiable. Signs are grouped into color classifications based upon on their purpose,
thereby allowing motorists to determine the nature of a sign before they can actually read it.
There are currently 7 sign background colors in use by the NCDOT. These are shown in Table
2.4. To the right of each color is a brief description of the function that each type of color serves.
Background Color Description
Blue Indicates services available to road users Brown Indicates recreational and cultural facilities
Green Indicates movement permitted or gives directional guidance Orange Warns of temporary traffic conditions with a high hazard potential Red Indicates right-of-way control, prohibition, or exclusion
Yellow Indicates a law, regulation, legal requirement, or direction White Warns of a typical potential hazard
Table 2.4: Signs Background Color Descriptions [Kirtley 2001]
Characterization
Within each of these sign color classifications are a set of individual signs that serve a similar
purpose. Table 2.5 gives a brief listing of some of the different types for each respective color.
Blue Brown Green Orange Red White Yellow
Rest Area Monument Bike Route Flag Man Ahead Stop Keep Right Deer Crossing Interstate Camping Directions Men Working Wrong Way No Parking Stop Sign Ahead
Evacuation Route Historic Site Fire District Construction Zone Do Not Enter Speed Limit Pedestrian Crossing
Table 2.5: Example of Sign Types by Color [Kirtley 2001]
Background
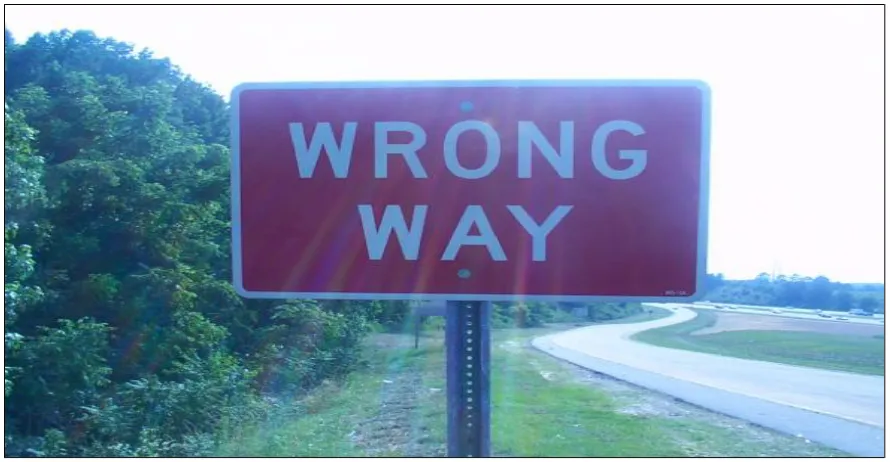
This sign classification system describes the primary color of a sign’s background. Most signs
typically consist of two colors; one for the sign’s lettering, and one for its background. The color
of a sign’s background was therefore defined to be the color which was not its lettering color. For
example, Figure 2.1 shows a “Wrong Way” sign. These signs have white lettering and a red
background. The color of a sign is taken to be opposite of the lettering. Therefore, the color of
Figure 2.1: Wrong Way Sign
Exceptions
The two exceptions to this rule are “Yield” and “Stop” signs. Due to the high level of liability that
a stop sign poses, they were counted as a separate category. All sign counts therefore have tallies
for 8 subsets: 7 for the main background colors, and one for stop signs. Stop signs were not
included in any red counts. Yield signs have red lettering, and white and red in the background.
Normally, these signs would be counted as white. Yield signs, however best fit into the red
classification in terms of their underlying meaning. Also, the majority of the background of a
yield sign is red. These signs were therefore counted as red.
Recording
The Kirtley study also determined that the most efficient way to count signs was through the use
of an audio recorder. Sign data would be recorded into the audio recorder as roads were driven,
and then compiled at a later date. It was found to be too difficult for one person to take down
written tallies while driving.
Sample Size
Wake and six surrounding counties were chosen to sample. These counties were chosen for
are defined as areas located within the city limits of municipalities whose populations are greater
than 5000 persons. Rural describes are all other areas. Table 2.7 lists each selected sample
county along with its respective rural and urban roadway mileages. Rural road samples were
taken from all seven counties, whereas urban samples were taken from only two (Wake &
Durham). This is because only Wake and Durham had large enough urban mileage totals to
allow for an efficient count.
County Secondary Road Mileages
County Rural Urban Total
Chatham 879.7 21.7 901.4
Durham 454.5 134.2 588.7
Franklin 623.8 11.9 635.7
Granville 696.8 19.6 716.4
Harnett 839.1 27.9 866.9
Johnston 1,241.6 53.2 1,294.8
Wake 1,541.1 259.3 1,800.4
Table 2.6: County Mileages [NCDOT Highway and Road]
Route Selection
Roads within each county were selected in such a manner as to achieve what was believed to be a
representative sample of roads in each county. Many factors were considered when selecting
roadways to ensure that a representative sample was in fact obtained. Roads were chosen based
upon structure (paved vs. unpaved), length, and geographical location. Attention was paid to
ensure that each set of countywide road samples had a mixture of all these characteristics. This
meant that the approach used in this study was to drive roads that were both paved and unpaved,
long and short, and from all geographic areas within the county.
2.2.2 Count Verification Study
In the Kirtley study, sign densities were based upon sign counts in one direction of travel only.
This meant that signs were counted along one side of the roadway and then multiplied by 2 to
estimate the total number of signs along that road sample. Signs densities could accurately be
calculated in this manner because primary routes are very uniform in composition along both
It was uncertain if secondary roadways had a high enough degree of uniformity to use this same
method for calculation. For this reason, a count verification study was performed using
approximately 50 miles of rural secondary roadway. In this study, signs were first counted on a
set of roads in one direction (forward direction). This same set of roads was then driven in the
opposite direction (backward direction), and signs were again counted. The total number of signs
counted were tallied for each individual direction, and compared to one another (Forward vs.
Backward).
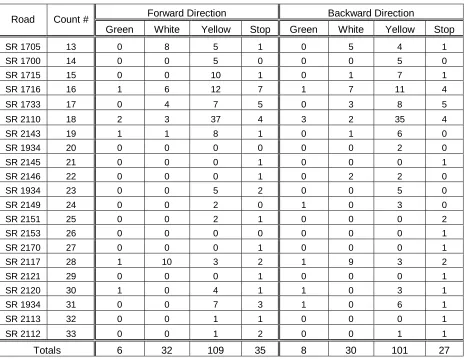
The raw data from this study is shown in Table 2.7. The road number is listed in the first column,
with the number of signs in each respective direction in the subsequent columns. The totals for
both count directions are shown in the last row of the table.
Forward Direction Backward Direction Road Count #
Green White Yellow Stop Green White Yellow Stop
SR 1705 13 0 8 5 1 0 5 4 1
SR 1700 14 0 0 5 0 0 0 5 0
SR 1715 15 0 0 10 1 0 1 7 1
SR 1716 16 1 6 12 7 1 7 11 4
SR 1733 17 0 4 7 5 0 3 8 5
SR 2110 18 2 3 37 4 3 2 35 4
SR 2143 19 1 1 8 1 0 1 6 0
SR 1934 20 0 0 0 0 0 0 2 0
SR 2145 21 0 0 0 1 0 0 0 1
SR 2146 22 0 0 0 1 0 2 2 0
SR 1934 23 0 0 5 2 0 0 5 0
SR 2149 24 0 0 2 0 1 0 3 0
SR 2151 25 0 0 2 1 0 0 0 2
SR 2153 26 0 0 0 0 0 0 0 1
SR 2170 27 0 0 0 1 0 0 0 1
SR 2117 28 1 10 3 2 1 9 3 2
SR 2121 29 0 0 0 1 0 0 0 1
SR 2120 30 1 0 4 1 1 0 3 1
SR 1934 31 0 0 7 3 1 0 6 1
SR 2113 32 0 0 1 1 0 0 0 1
SR 2112 33 0 0 1 2 0 0 1 1
Totals 6 32 109 35 8 30 101 27
The totals of both directions are further shown in Table 2.8, along with an average of the 2 tallies.
From this table, it can be seen that the totals of the two directions are relatively precise with
respect to one another. Based upon this information it was decided that roads would be driven in
one direction only, and then multiplied by 2 to arrive at a total number of signs for that sample.
This method of one-directional driving would allow for a greater coverage of secondary road
sampling, while maintaining a reasonable accuracy.
Count Direction Green White Yellow Stop
Forward Direction 6 32 109 35
Backward Direction 8 30 101 27
Average 7 31 105 31
Table 2.8 Count Verification Study Summary
2.2.3 Parallel Facing Signs
Signs along secondary roads are oriented both parallel and perpendicular to the direction of
travel. Parallel signs are a little bit trickier to count than perpendicular signs because they may be
visible from multiple roadways. This could potentially lead to a higher probability of double
counting signs. A set of stringent rules was therefore developed to ensure that parallel signs
would be only counted on one roadway. The basic premise of these rules was to develop a
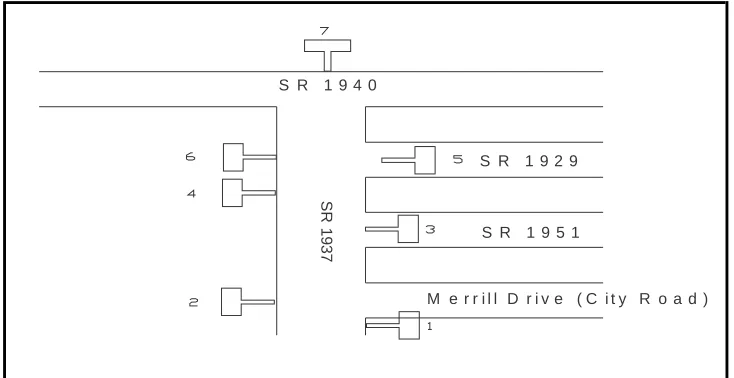
procedure that would ensure parallel signs would not be double counted. Figure 2.2 will be used
to illustrate the principles of parallel sign counting.
S R 1 9 2 9
S R 1 9 5 1
M e r r i l l D r i v e ( C i t y R o a d )
S
R
1937
S R 1 9 4 0
The purpose of this figure is to help illustrate the procedure used for counting parallel signs. In
this example the road being driven is SR 1937. The other roads shown are SR 1940, SR 1951,
SR 1929, and Merrill Drive, which is a city maintained road. Several parallel signs
configurations have been shown in the figure, and each sign has been assigned a reference
number (#1-7). The manner in which each sign will be counted is discussed below.
Sign #1 & 4: These signs represent signs that are located along SR 1937, but are not readily
visible from any other roadway. These signs would be counted as part of SR 1937’s sample
count.
Sign #6 & #7: These signs face one roadway, but are located and parallel on another. For instance
sign #7 is located on SR 1940, but faces SR 1937. In this case sign #7 would be counted as part
of SR 1937 sample count. This is because sign #7 is most easily viewed from SR 1937.
Likewise, sign #6 would be counted as part of SR 1929’s sign count totals. Therefore, the
counting rule for “T” intersections is to not count a parallel sign that faces another secondary
road. It is important to note that although sign #4 is across from SR 1929, it would be counted as
part of SR 1937’s sign count. Only sign directly across the intersection are counted in this
manner.
Sign #2: This, like Signs #1 and #4, also is a sign at a “T” intersection. The difference is this case,
however, is that Sign #2 is perpendicular to a city maintained road. If Merrill Drive was a
NCDOT maintained road, sign #2 would be counted as being part of Merrill Drive, and not SR
1937. Since Merrill Drive is city maintained, and sign #2 is state maintained, this procedure
would leave this sign uncounted. Therefore, it is necessary to include this sign as part of SR
1937’s sign count. Therefore, the rule for counting “T” intersections with a city maintained road
is to include the sign as part of the secondary road’s total.
Sign#3 & #5: These signs are both located parallel to SR 1937, at the entrances to other roads.
The method for counting these signs depends on how close they are to the edge of the roadway
entrance. In the case of sign #3, the sign is right on the edge of SR 1937. This sign would be
counted as being part of 1937’s sample data because the sign would not be easily seen when
signs would most likely be seen when turning onto SR 1929. They were therefore not include in
SR 1937’s totals, and include it as part of SR 1929’s totals.
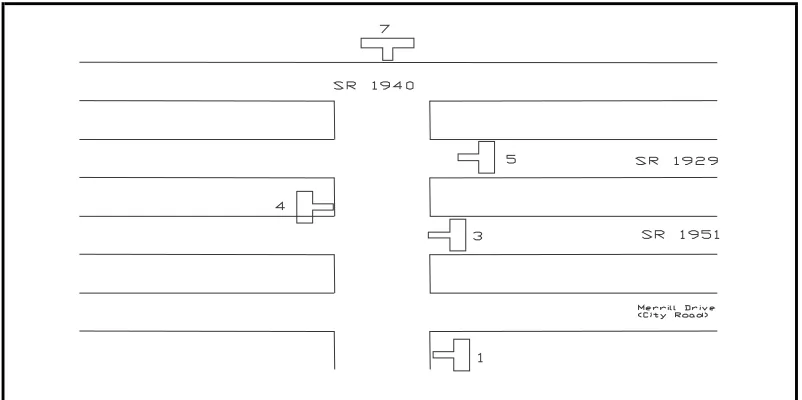
In the event that SR 1929 and SR 1951 crossed over SR 1937, signs #3 and #5 would be counted
differently. This is shown in Figure 2.1. In this case signs #3 and #5 would be counted as part of
SR 1951 and 1929, respectively. This is because they are now perpendicular to these roadways
(SR 1951 & SR 1929). So if, for example, SR 1929 was sampled sign #5 would show up as a
perpendicular sign and therefore be counted as part of SR 1929.
Figure 2.3 Parallel Signs Continued
There is also a highly specialized count methodology pertaining to divided highways which
needs to be discussed. In the Kirtley study, all visible one-way street signs were counted along
divided primary routes. To remain consistent, this study did not count any one-way signs along a
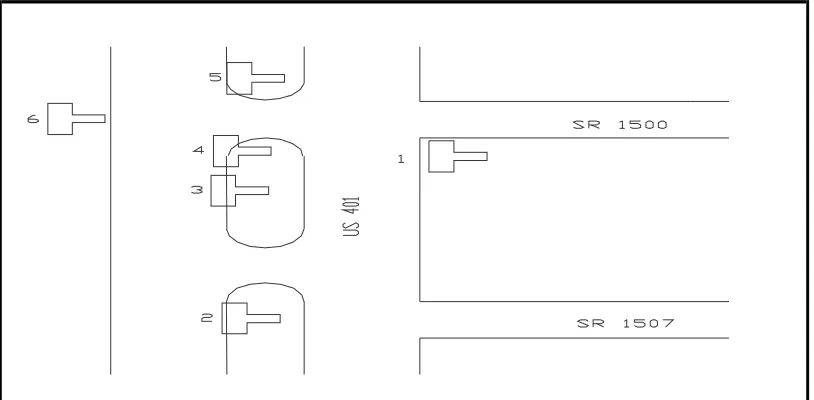
divided highway. There is one exception, however, which is illustrated in Figure 2.4.
Figure 2.4 shows a series of one-way signs (#1-6), which frequent intersections with primary
routes (US 401). Each sign has been given a reference number. In this case, if a motorist were
driving along SR 1507, no one-way parallel signs would be counted, because all of these signs
were counted in the Kirtley study. If the driver were going along SR 1500, sign #1 would be
counted. This sign actually faces towards SR 1500, with its back towards the primary route (US
form US 401, and therefore was not counted. These signs were therefore counted in the
secondary count tallies. Note that this rule only pertains to one-way signs. All other types of
signs adhere to the rules set forth in Figures 2.2 and 2.3.
Figure 2.4 One-Way Signs on Divided Primary Routes
It is important to remember the overall philosophy is to ensure that parallel signs are not double
counted. In any other highly specialized situation that may have arisen, parallel signs were
counted based on two questions:
• Is this sign NCDOT maintained?
• If so, would it be counted as part of another road?
If the answer to the second question is “yes”, the sign would not be included in the sample.
2.2.4 Divided Secondary Roads
Sometimes, a roadway has a central barrier that clearly divides the two directions of travel. A
roadway with this sort of barrier is termed “divided”, and the divisor is typically a concrete
barrier, metal railing, grass median, or some sort of vegetation. Since additional signs are needed
to help direct the flow of traffic around the barrier, a divided roadway will have a different sign
As can be seen in Table 2.9, there are 144.55 miles (133.5 + 11.0) of divided secondary roadway
in North Carolina. Since this only represent 0.2% all secondary roadways, divided roadways
were not considered statistically significant enough to count. In planning which roads to drive,
divided roadways were intentionally avoided. The structure of a road, can however, suddenly
change from undivided to divided and then back to undivided. In these cases, the entire section
of road way treated as undivided, as long as the divided portion was only a few hundred feet or
so.
Roadway Characteristic
Four Lanes Six Lanes or More 2 Lanes 3
Lanes
Divided Undivided Divided Undivided
1Way
Pair Total
Rural Secondary Roads 59,054.9 4.2 42.9 60.3 0.4 5.6 59,168.2
Urban Secondary Roads 3,821.9 26.3 90.7 336.7 10.7 12.6 0.1 4,298.9 Totals 62,876.8 30.5 133.5 396.9 11.0 18.2 0.1 63,467.1
Table 2.9 Secondary Road Mileages by Road Structure [NCDOT Highway and Road]
2.2.5 Excluded Signs
There are a great variety of signs along Secondary roads that are not installed or maintain by the
NCDOT. These signs were therefore excluded for the sign counting activity. Signs excluded
from counts include hotel signs, community watch signs, bus stop signs, and private business
signs. Consider Hotel sign. Hotels often have metallic signs that provide directional instructions
to motorists. A hotel sign typically consists of two signs, one with the name of the hotel, and the
other is simply a directional arrow. Since hotel signs were not thought to be maintained by the
NCDOT, neither of these signs was counted. Figure 2.5 illustrates examples of these signs.
In addition to these non-NCDOT maintained signs, street signs and directional markers are also
non-NCDOT maintained signs. Street signs are illustrated in Figure 2.6 below.
Figure 2.6: Street Signs
2.2.6 Damaged Signs
It is not uncommon to come across signs that have been hit or damaged in some manner. These
types of signs are most often seen in rural areas, and are typically severely leaning on their post,
or are propped up by nearby vegetation. Since the DOT will eventually replace these signs as part
of their ongoing maintenance efforts, they were included in the sign counts.
2.2.7 Split Exits
Occasionally, a secondary road will split into a divided section upon the intersection with another
road. This is illustrated in Figure 2.7. In this example, SR 1119 splits at the intersection of NC 29
into two separate exit paths. In these cases, all signs (#1-#3) were counted as part of SR 1900’s
sample. All three signs must be counted, because they would not be counted along any other
Figure 2.7: Split Exits
2.2.8 Dead Ends
After deciding to count roads in a one-directional manner, dead end roads were identified as
potential problems. A dead end road typically has a stop sign(s) at its exit. Under the
methodology used, a stop sign would never be included in the count if these roads were driven
from their intersection until the end. An effort was therefore made to drive some dead end roads
from their end to the intersection, as well as from their intersection until the end. This principle is
depicted in Figure 2.8.
In this figure 5 sampled roads are shown (SR’s 2454, 2317, 1460, 1459, and 2400). For example,
SR 2400 has a stop sign located at its intersection with SR 1002. If this road was driven from the
intersection of SR 1002 to the end, the stop sign would never be counted. If the road was driven
from its end to the intersection of SR 1002, its stop sign would be counted. Dead-end roads were
therefore driven in both directions. In this particular example SR 2454 and SR 2400 were driven
from the end to their intersection with SR 1002. SR’s 2317, 1460, and 1459 were all driven from
their intersections with SR 1002 until their respective endings.
2.2.9 Urban Issues
Urban secondary routes have some properties which made them difficult to sample. First of all,
urban routes tend to be poorly and infrequently marked. This made it difficult to ascertain exactly
were an urban route began or ended. In addition, it was difficult to determine if a particular
parallel sign should be counted, based upon the methodology described in section 2.2.3. The
reason for this difficulty is that the road faced by a parallel sign may not be clearly marked as
secondary or non-secondary. Therefore, it could not be determined if the sign fell under the rules
for sign #5 or for signs #6 & #7, as set explained in Figure 2.2. The sampler must therefore make
a judgment call as whether to include the sign in his count totals. In addition to the lack of clear
marking, many urban routes weave in and out of municipalities. When these routes are outside of
a city limit, they are considered to be a rural route. Many urban secondary routes will suddenly
switch to a defined rural route and then back to a defined urban route. Routes that did this were
difficult to sample because of the uncertainty of classification (urban or rural). The combination
of this with the unclear labeling of primarily urban routes, limited the total number of urban
secondary mile suitable for sampling. In this study, only clearly marked roads were driven, but
the results of the sampling were thought to have some imperfections because of the problems
cause by parallel sign counting.
3.0 RESULTS
In this section the results of the study are presented for review. Two sets of tables are included.
The first table provides the number of signs actually counted. The second table presents the total
number of estimated signs in the state. This second table is a projection of the data from the first
table.
3.1 Primary Route Improvements
3.1.1 Rest Areas, Welcome Centers, and Visitor Centers
Rest stops exist along Interstate, US routes, and NC routes. There are 40 Interstate, 21 US Route,
and 1 NC Route rest areas in the state [NCDOT Rest Areas]. Table 3.1 shows the total number of
signs for each rest area classification by sign type.
Rest Area Sign Field Data Road Type
Blue Brown Green Orange Red White Yellow Stop
I-85 Southbound Mile 139 6 0 0 0 9 18 2 0
I-85 Northbound Mile 139 9 0 0 0 8 20 2 0
I-40 Westbound Mile 324 3 0 0 0 7 24 0 0
I-40 Eastbound Mile 324 5 0 0 0 5 15 1 0
Interstate Average 5.8 0 0.0 0.0 7.3 19.3 1.3 0.0
US 220 3 0 1 0 4 9 0 1
US Route Average 3 0 1 0 4 9 0 1
NC 705 1 0 0 0 4 11 0 2
NC Route Average 1 0 0 0 4 11 0 2
Table 3.1: Number of Signs Counted in Rest Areas by Color
Table 3.1 shows that 6 rest areas were visited and inventoried. The number of each color of sign
is shown at each rest area. The Interstate average was calculated using the four rest areas as
being representative of any typical North Carolina Interstate rest area. The same was done for US
and NC routes. The averages are shown in the bolded areas of Table 3.1. These averages were
then multiplied by the total number of rest areas in the state for each Interstate, U.S. Route, and
N.C. Route categorization to arrive at an estimated total rest area sign count. Table 3.2 shows
Estimated Total Number of Rest Area Signs in North Carolina Road Type
Blue Brown Green Orange Red White Yellow Stop
Interstate (40) 230 0 0 0 290 770 50 0
US Route (21) 63 0 21 0 84 189 0 21
NC Route (1) 1 0 0 0 4 11 0 2
Total by Color 294 0 21 0 378 970 50 23
Total of All Colors 1,736
Table 3.2: Total Number of Signs Estimated in Rest Areas by Color
3.1.2 Truck Weigh Stations
Weigh Stations are located along Interstates and US Routes. Signs were counted at three weigh
stations: the I-40 / I-85 weigh station (located approximately 15 miles west of Durham), the I-95
weigh station (located approximately 18 miles south of Roanoke Rapids) and the US 70 / US 258
weigh station (located within the city limits of Kinston) Table 3.3 shows the number of signs at
each weigh station by color.
Truck Weigh Station Field Data Truck Weigh Station
Blue Brown Green Orange Red White Yellow Stop
I-40 / I-85 Hillsborough 8 0 24 0 14 59 11 6
I-95 Halifax 0 0 0 0 0 13 8 4
US 70 / US 258 Kinston 0 0 0 0 1 2 0 0
Table 3.3: Number of Signs Counted at Truck Weigh Stations by Color
Each of these weigh stations was assumed to representative of other weigh stations for the same
roadway classification. The field data was therefore multiplied by the total number of weigh
stations (8 Interstate, 2 US Route) to arrive at an estimated total truck weigh station sign count.
The estimated totals are shown in Table 3.4. These values result in the addition of 594 signs to the
original counts done in the Kirtley study.
Truck Weigh Station Field Data Truck Weigh Station
Blue Brown Green Orange Red White Yellow Stop
Interstate 32 0 96 0 56 288 76 40
US Route 0 0 0 0 2 4 0 0
Total by Color 32 0 96 0 58 292 76 40
Total of All Colors 594
3.2 Secondary Route Extensions
The results of the secondary roadway study are detailed in this section. In the study, signs were
counted on 1277.5 miles (1156.2 Rural, 121.0 Urban) of North Carolina secondary roadways. As
discussed in the methodology, all of the study samples were taken from a seven county area
centered around Wake county. Detailed information about the sample data can be found in
Appendices B, C, and D. A summary of these 3 appendices can be found in Appendix A.
Table 3.5 shows both the rural and urban two-way sign densities for each of the counties sampled
in this study. Of the seven counties, urban samples were only taken from Wake and Durham
counties. These were the only two counties in the sample area with a substantial number of
state-maintained urban secondary roadways. A more detailed summary of each county’s sign density
can be found in Appendix A.
Sign Densities
County Name Rural Urban
Chatham 9.0 -NA-
Durham 12.6 26.6
Franklin 7.3 -NA-
Granville 7.2 -NA-
Harnett 6.2 -NA-
Johnston 7.1 -NA-
Wake 15.4 38.6
Table 3.5 County Sign Density Summary
As can be seen in Table 3.5, the rural sign densities of Wake and Durham counties were found to
be significantly higher than those of the other 5 counties. These two counties are more urban in
nature the other counties in the study and have significantly higher population densities. It was
therefore inferred that the higher population densities resulted in an increased need for rural
traffic control signage as motorists flowed in and out of large municipalities. This increased flow
of traffic was thought to result in higher rural sign densities. It was therefore necessary to
estimate signs in counties with high population densities separate from counties with low or
Using the findings of North Carolina’s 2000 census figures [Census 2000], the 100 counties of
North Carolina were divided into 2 categories, termed Type I and Type II counties. Type I counties have low population densities of less than 525 persons per square mile. Type II counties
have high population densities, greater than 525 persons per square mile. Type II counties are
typically dominated by a large municipality, and therefore are similar to both Durham and Wake
counties. Table 3.6 lists all of North Carolina’s counties and their respective classification. There
are a total of 93 Type I counties and 7 Type II counties.
Table 3.6 County Classifications
The two-way rural sign density of Type I counties was estimated to be 7.33 signs per mile
(Appendix A). This figure was found by dividing the total number of signs counted in Type I
counties (3314) by the total number of miles driven in Type I counties (906.4). This number
(3.66) was then multiplied by 2 to arrive at a two-way sign density of 7.33 signs per mile. Rural
sign totals in Type II counties were estimated using the same method, and the two-way Type II
rural sign density was found to be 14.36. Even though urban data was taken from only Wake and
Type I Counties Type II Counties
Alamance Craven Jones Richmond Durham
Alexander Cumberland Lee Roberson Forsyth
Alleghany Currituck Lenoir Rockingham Gaston
Anson Dare Lincoln Rowan Guilford
Ashe Davidson Macon Rutherford Mecklenburg
Avery Davie Madison Sampson New Hanover
Beaufort Duplin Martin Scotland Wake
Bertie Edgecombe Mcdowell Stanly
Bladen Franklin Mitchell Stokes
Brunswick Gates Montgomery Surry
Buncombe Graham Moore Swain
Burke Granville Nash Transylvania
Cabarrus Greene Northampton Tyrrell
Caldwell Halifax Onslow Union
Camden Harnett Orange Vance
Carteret Haywood Pamlico Warren
Caswell Henderson Pasquotank Washington
Catawba Hertford Pender Watauga
Chatham Hoke Perquimans Wayne
Cherokee Hyde Person Wilkes
Chowan Iredell Pitt Wilson
Clay Jackson Polk Yadkin
Cleveland Johnston Randolph Yancey
Durham counties, this was used to estimate all of North Carolina’s urban secondary route signs.
Although Wake and Durham are dominated by the large municipalities of Raleigh and Durham
respectively, several of the smaller municipalities in these counties were also sampled. Urban
routes were also driven in Cary, Holly Springs, and Fuquay-Varina. It was felt that this provided
enough variation in municipality size to reasonably estimate the number of signs on North
Carolina’s urban secondary routes. Using the same method as described for rural routes, total
urban signs counted (2058) was divided by the total number of urban miles driven (121.0) and
multiplied by 2 to derive a two-way urban sign density of 34.01 signs per mile. This number was
applied to urban miles in both Type I and Type II counties.
3.2.1 Total Number of Signs
Using the computed sign densities (7.33, 14.36, and 34.01) the total number of signs on both rural
and urban secondary routes was estimated. Table 3.7 shows these estimates. Type I counties are
listed in the 1st row and Type II counties are listed in the 2nd row. The 3rd row lists the sign totals
for the entire state in both rural and urban areas. The 4th row tallies both the rural and urban totals
to arrive at 616,436 secondary route signs in the state of North Carolina. Appendix E shows the
calculation of these figures, along with an estimate for the number of signs in each individual
county.
Summary Table Type I & II Counties
Rural Urban
County Type
Miles Sign Density
Estimate Signs Miles
Sign Density
Estimate Signs
Type I 53,972.14 7.33 395,616 2909.76 34.01 98,961
Type II 5,196.04 14.36 74,615 1389.12 34.01 47,244
Totals 59,168.18 -NA- 470,231 4298.88 -NA- 146,205
Statewide Estimation 616,436 Signs
Table 3.7 Statewide Secondary Road Estimate of Total Number of Signs
3.2.2 Number of Signs by Color
Table 3.8 shows the estimate of total number of secondary route signs by background color. The
roadways. These three rows are then summed to find a statewide sign total estimate. The data in
Table 3.8 was computed in Appendix F.
Statewide Color Estimate
Sign Color
Roadway Classification Blue Brown Green Orange Red White Yellow Stop
Type I Rural 3,238 1,619 20,509 4,318 1,619 107,405 213,190 43,717
Type II Rural 1,403 104 1,143 935 883 30,709 33,722 5,716
Urban 7,695 1,204 6,233 4,772 3,611 82,410 38,647 1,634
Statewide Estimate 12,336 2,927 27,885 10,025 6,113 220,524 285,559 51,067
Table 3.8 Statewide Secondary Road Sign Estimate by Color
A color sign density for the secondary route totals was calculated and is shown in Table 3.9.
These figures are computed in a fashion similar to a typical sign density. For example 3,238 blue
signs were counted while driving 906.4 miles of rural Type I roadway. The number of blue signs
(3,238) was divided by the number of miles (906.4) and this figure (0.03) was multiplied by 2 to
arrive at an estimate of 0.06 blue signs per mile of Type I rural secondary roadway. This same
calculation was performed for each sign color along each road type. It is important to recognize
that Table 3.8 shows totals of signs by color, while Table 3.9 shows frequency of sign colors.
The column on the far right of the table sums the individual color sign density to show the total
sign density for each route type.
Sign Color Road Type
Blue Brown Green Orange Red White Yellow Stop Total
Type I Rural 0.06 0.03 0.38 0.08 0.03 1.99 3.95 0.81 7.33
Type II Rural 0.27 0.02 0.22 0.18 0.17 5.91 6.49 1.10 14.36
Urban 1.79 0.28 1.45 1.11 0.84 19.17 8.99 0.38 34.01
Table 3.9 Color Sign Densities for Secondary Routes
3.3 Count Totals of Both Studies
The following Tables summarize the final results of both this and the Kirtley Study. These data
color. The statewide estimate is approximately 970,000 NCDOT maintained signs, and is
detailed in Table 3.10.
Several aspects of this table may be confusing to the reader. The 1st row in Table 3.10 titled
“I,US,NC” is the final estimate provide in the Kirtley primary route study. This row estimates the
total number of signs along North Carolina Interstate (I), NC Routes (NC), and US Routes (US).
The “RAs, VCs, and WC” row in Table 3.10 estimates the total number of signs located in rest
areas (RAs), visitor centers (VCs), and welcome centers (WCs). This data can also be found in
Table 3.2 of this report. The “Truck Weigh Station” row simply lists the findings of the truck
weigh station estimate presented in Table 3.4 of this report.
Blue Brown Green Orange Red White Yellow Stop Totals
I, US, NC (Kirtley) 26,702 3,523 39,247 10,405 19,746 161,735 88,233 1,548 351,139
RAs,VCs,and WCs 294 0 21 0 378 970 50 23 1,736
Truck Weigh Stations 32 0 96 0 58 292 76 40 594
Primary Total 27,028 3,523 39,364 10,405 20,182 162,997 88,359 1,611 353,469
Secondary Total 12,336 2927 27,885 10,025 6,113 220,524 285,559 51,067 616,436 All Total 39,364 6,450 67,249 20,430 26,295 383,521 373,918 52,678 969,905
Table 3.10: Total Number of Signs in North Carolina
Table 3.11 details the number of signs on North Carolina’s Interstates. The 1st row of this table
shows the findings of the Kirtley study’s Interstate counts. The Kirtley study did not include
estimates for signs in rest areas or truck weigh stations along Interstates. These estimates were
performed as part of this study and are shown in the 2nd and 3rd rows, respectively. The 4th row is
a summation of rows 1, 2, and 3; showing the total number of signs along North Carolina’s
Interstates.
Blue Brown Green Orange Red White Yellow Stop Totals
Interstate (Kirtley) 5,271 164 8,982 1,673 2,370 6,574 2,936 694 28,664
RAs and WCs 230 0 0 0 290 770 50 0 1,340
Truck Weigh Stations 32 0 96 0 56 288 76 40 588
Interstate Total 5,533 164 9,078 1,673 2,716 7,632 3,062 734 30,592
Table 3.11: Total Number of Interstate Signs in North Carolina
Table 3.12 details the number of signs on North Carolina’s US Routes. Similar in format to
Table 3.11, the 2nd row lists totals for rest areas, and the 3rd row lists totals for truck weigh
summation of rows 1, 2, and 3; giving an estimate for the total number of signs along North
Carolina’s US Routes.
Table 3.12: Total Number of US Route Signs in North Carolina
Table 3.13 details the number of signs on North Carolina’s NC Routes. There are no truck weigh
stations on NC Routes, and the only extension to the Kirtley study was the addition of rest area
totals, presented in the 2nd row.
Blue Brown Green Orange Red White Yellow Stop Totals
NC Route (Kirtley) 10,271 1,871 12,432 5,101 3,238 54,045 54,045 823 141,826
RAs 1 0 0 0 4 11 0 2 18
NC Route Total 10,272 1,871 12,432 5,101 3,242 54,056 54,045 825 141,844
Table 3.13: Total Number of NC Route Signs in North Carolina
Table 3.14 details the number of signs on North Carolina’s secondary routes. This data table is
the primary contribution of this paper, and a more detailed summary of secondary route totals can
be found in Section 3.2.
Blue Brown Green Orange Red White Yellow Stop Totals
Secondary Total 12,336 2,927 27,885 10,025 6,113 220,524 285,559 51,067 616,436
Table 3.14: Total Number of Secondary Road Signs in North Carolina
Table 3.15 shows the composition of primary, secondary, and statewide totals based upon
background color. This table will tell the reader, for example, that blue signs account for 7.6% of
primary route signs, 2.0% of secondary route signs, and 4.1% of statewide sign totals.
Route Type Blue Brown Green Orange Red White Yellow Stop Total
Primary Route 7.6 1.0 11.1 2.9 5.7 46.1 25.0 0.5 100.0 Secondary Route 2.0 0.5 4.5 1.6 1.0 35.8 46.3 8.3 100.0
Total 4.1 0.7 6.9 2.1 2.7 39.5 38.6 5.4 100.0
Table 3.15: Composition of Primary and Secondary Routes (%)
Blue Brown Green Orange Red White Yellow Stop Totals
US Route (Kirtley) 11,160 1,488 17,833 3,631 14,138 101,116 31,252 31 180,649
RAs and VCs 63 0 21 0 84 189 0 21 378
Truck Weigh Stations 0 0 0 0 2 4 0 0 6
Table 3.16 shows how much each route accounts for a background color’s total. For example,
68.7 % of blue signs are on primary routes, whereas the remaining 31.3% are on secondary
routes.
Route Type Blue Brown Green Orange Red White Yellow Stop
Primary Route 68.7 54.6 58.6 50.9 76.8 42.5 23.6 3.1 Secondary Route 31.3 45.4 41.4 49.1 23.2 57.5 76.4 96.9
Table 3.11: Percentage of Background Color Totals on Primary and Secondary Routes (%)
Table 3.17 shows the frequency of each sign type on both primary and secondary routes. For
example, there are 1.85 blue signs for every mile of primary route, and 0.19 blue signs for every
mile of secondary route. The total column on the far right shows the average sign density for each
route type.
Route Type Blue Brown Green Orange Red White Yellow Stop Total
Primary Route 1.85 0.24 2.69 0.71 1.38 11.15 6.05 0.11 24.2 Secondary Route 0.19 0.05 0.44 0.16 0.10 3.47 4.50 0.80 9.7
4.0 CONCLUSIONS
By combining the results from the Kirtley primary route study and the primary route
improvements and secondary route totals of this study, the total number of NCDOT maintained
signs could be reasonably estimated at 969,905. Roughly one-third (353,469) of these signs are
on primary routes and the remaining two-thirds (616,436) are on secondary routes. The vast
majority of these 970,000 signs are either white (39.5%) or yellow (38.5%). Together these total
approximately 760,000 signs, accounting for 78% of the statewide total. The remaining six color
classifications are relatively small in number. There are some notable differences between the
characteristics of signs on secondary and primary routes.
4.1 Comparison of Primary and Secondary Totals
In general, signs are denser on primary routes than secondary routes. Primary route signs have an
average density of 24.2 signs per mile, while signs on secondary routes have an average sign
density of 9.7 signs per mile (Table 3.17). In addition, all of the sign color classifications occur
more frequently on primary routes except for stop signs. Stop signs are more frequent on
secondary routes (0.80 stop signs per mile) than on primary routes (0.11 stop signs per mile).
Even though primary routes have a higher average sign density, secondary routes contain more
signs because of the vast number of secondary roadways. As previously noted, there are
approximately 616,000 signs are located on 63,467.06 miles of secondary roadway, accounting
for two-thirds of the statewide total. The remaining 354,000 signs are located along 14616.32
miles of primary highway. In terms of color, the majority of white, yellow, and stop signs are on
secondary roadways, whereas the majority of blue, brown, green, orange, and red signs are on
primary routes. The most notable of these differences are that secondary routes contain 97% of all
stop and 76.4% of all yellow signs. Alternatively, while primary routes contain 68.7% of all blue
and 76.8% of all red signs. Brown, green, orange, and white signs are more equally distributed
between the two road types.
4.2 Primary Route Improvements
The primary route improvements of this study add an estimated 2,330 number of signs to the
While these are a large number of signs, and make the primary route estimates more complete,
they are relatively insignificant when compared to the estimated statewide total of 353,469
NCDOT primary route maintained signs. Thus, although we enhanced the results of the previous
study the results themselves did not significantly change.
4.3 Secondary Route Extensions
The secondary route extensions of this report show a total of 616436 signs along North Carolina
secondary route systems. Of these signs, roughly three-quarters (470,231 signs) are on rural
secondary roadways, while the remaining one-quarter (146,205 signs) are on urban secondary
routes. Signs on urban routes (34.0) had a much higher density than signs on rural routes (9.7).
Furthermore, counties with high population densities had higher rural sign densities than counties
with low population densities. This is further discussed below.
Secondary routes essentially only have four types of signs on them: green (4.5%), stop (8.3%),
white (35.8%), and yellow (46.3%). These four signs combine to account for 95% of all
secondary route signs. There are, therefore, virtually no blue, brown, orange, or red signs on
secondary routes.
4.3.1 Comparison of Rural and Urban Secondary Routes
It is important to note that urban secondary routes are actually very different from rural secondary
routes. In actuality, an urban secondary route is very similar to a primary route. Urban secondary
routes have a fair share of blue, brown, and red signs and have very few stop signs. This likens
them to primary routes, as primary routes also have many blue, brown, and red signs and very
few stop signs. Furthermore, the overall urban secondary sign density (34.01 signs per mile) is
also closer to the primary route average (24.2 signs per mile) than to the average rural secondary
sign density (9.7 signs per mile). In terms of signage, it could therefore be said that a secondary
urban route has more in common with a primary route than with a rural secondary route.
Taking this trend further, one can see that most secondary stop signs are on rural roadways. Type
I and Type II rural secondary roads (See Section 4.3.2) have stop sign densities of 0.81 and 1.10
stop signs per mile respectively. Urban secondary routes, on the other hand, have a stop sign
density of 0.38. The reason for this is that an urban secondary route is likely to be a main
therefore, a low density of stop signs. Alternatively, a rural secondary route intersection is
typically controlled by stop signs, hence the difference in stop sign frequency. As previously
noted, 97% (51,067) of all stop signs are on secondary routes. Of these 96% (43,717) of all
secondary route stop signs are on rural secondary routes. This means the approximately 94% of
all statewide stop signs are on rural secondary roadways!
4.3.2 Comparison of Type I Rural and Type II Rural Routes
Type I Rural and Type II Rural routes are actually very similar, except the Type II rural routes
have a greater overall sign density (Type I – 7.33 signs per mile, Type II – 14.36 signs per mile).
Remember that Type I rural secondary routes are located in counties with population densities
less than 525 persons per square mile, and Type II rural secondary routes are located in counties
with population densities greater than 525 persons per square mile. It appears that the reason for
the 7.03 (7.03=14.36 - 7.33) difference between the two sign densities can mainly be attributed to
an increase in the number of white and yellow signs. Type II rural routes have a total of 6.46
more white and yellow signs per mile. This figure (6.46 signs per mile) represents 92% of the
total 7.03 sign per mile difference in sign density. The primary difference in a Type I and Type II
rural route is therefore and increase in white and yellow signs. That is, in high population density
counties (Type II) there are many more white and yellow signs.
4.4 Sign Reflectivity Implications
Since this study was performed, in part, to assist the NCDOT in determining a sound strategy for
complying with the new federal sign reflectivity standards, it is important to specifically address
reflectivity implications. Stop, red, orange, and yellow signs were thought to be the most essential
signs when addressing sign reflectivity, and each are addressed individually below.
Stop
Stop signs are essentially all located on rural secondary routes. This study estimates there to be a
total of 52,686 stop signs in the state of North Carolina. Of this total, 97% (51,067 stop signs) are
on secondary routes. Of the 51,607 stop signs on secondary roadways, 96% (49,433 stop signs)
are located on rural secondary routes. Urban secondary routes only account for 1,634 stop signs.
![Table 2.1 North Carolina Interstate Highway Rest Area System [NCDOT Rest Areas]](https://thumb-us.123doks.com/thumbv2/123dok_us/1700720.1215629/10.612.60.574.133.586/table-north-carolina-interstate-highway-rest-ncdot-areas.webp)
![Table 2.2 North Carolina Highway Route Rest Area System [NCDOT Rest Areas]](https://thumb-us.123doks.com/thumbv2/123dok_us/1700720.1215629/11.612.49.566.93.284/table-north-carolina-highway-route-rest-ncdot-areas.webp)
![Table 2.5: Example of Sign Types by Color [Kirtley 2001]](https://thumb-us.123doks.com/thumbv2/123dok_us/1700720.1215629/13.612.104.504.236.353/table-example-sign-types-color-kirtley.webp)
![Table 2.6: County Mileages [NCDOT Highway and Road]](https://thumb-us.123doks.com/thumbv2/123dok_us/1700720.1215629/15.612.163.448.205.334/table-county-mileages-ncdot-highway-road.webp)
![Table 2.9 Secondary Road Mileages by Road Structure [NCDOT Highway and Road]](https://thumb-us.123doks.com/thumbv2/123dok_us/1700720.1215629/21.612.90.530.561.686/table-secondary-road-mileages-road-structure-ncdot-highway.webp)