CORTEX OF THE RAT1*'
THOMAS H. RODERICK3
University of California, Berkeley, California Received March 4, 1960
RECH, ROSENZWEIG,
BENNETT,
and KRUECKEL (1954) found strain differ- ences in cerebral cortex cholinesterase activity (ChE) of the rat as well as evidence that some behavioral characteristics might be associated with ChE levels. Since then, studies of ChE and adaptive behavior have afforded several inroads into the understanding of the general biological significance of this enzyme (ROSENZWEIG, KRECH and BENNETT 1958a), beyond that already well established from basic neurological studies.Selection experiments have been concerned with a wide variety of traits in many different organisms. With respect to biochemical studies, WOODWORTH, LENG and
JUGENHEIMER
(1952) have described a 50 year selection for protein and oil content in corn. A recent example of the several selection programs, in which the selection criterion is high and low response of an animal to an injected agent, is the experiment of KYLE and CHAPMAN (1953) who selected in the rat for high and low response of the ovary to a standard injected dosage of a gonado- trophic hormone. WEIR and CLARK (1955) successfully selected for high and low blood pH in the mouse. No attempt has yet been made to modify by selection the activity of an enzyme.This selection experiment was undertaken as part of an effort to: (1) find or produce other strains of rats with ChE differences for studies on the relationship of ChE and adaptive behavior, and (2) to obtain information on the genetics of modifiers of enzyme activity.
MATERIALS AND METHODS
Two foundation stocks of rats were used, from each of which a high and a low ChE line have been derived. Both stocks, obtained from animals maintained by the Small Animal Breeding Colony of the Genetics Department, University of California, Berkeley, were genetically heterogeneous, although their genetic back- grounds were different. One stock (RC), obtained from PROFESSOR W. E. CASTLE, was a product of crosses of many different strains from various sources used in his linkage studies. The other stock (RD) was descended from a four-way cross of
1Aided in part by grants G-2542 from the National Science Foundation, M-1292 from the National Institute of Mental Health. It also received aid from the United States Atomic Energy Commission and a grant from the Research Committee, Northern Section, Univ. of California. 2Fmm a dissertation submitted in partial fulfillment of the requirements of the degree of Doctor of Philosophy, University of California, Berkeley.
1124 T. H. RODERICK
four inbred lines of different origin. The four original lines were: (1) U.C. Line A (albino) from Iowa State University, (2) U. C. Line I (agouti hooded) from August Line 990, Wayne University, ( 3 ) U. C. Line F (albino) from King A Albino Line, Wistar Institute, and (4) U. C. Line J (albino) from Fischer Line 344, Wayne University.
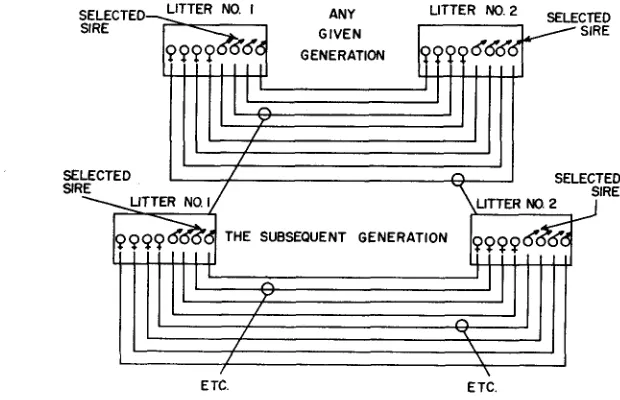
A double first cousin mating system was used in each generation and in each line throughout the experiment. This mating system was chosen because it maintained maximum heterogeneity for the population size adopted. A more open breeding system would have maintained greater genetic heterogeneity but would have necessitated the care and analysis of a cumbersome number of animals.
Reciprocal crosses were made between two litters within each line in each generation (Figure 1 )
.
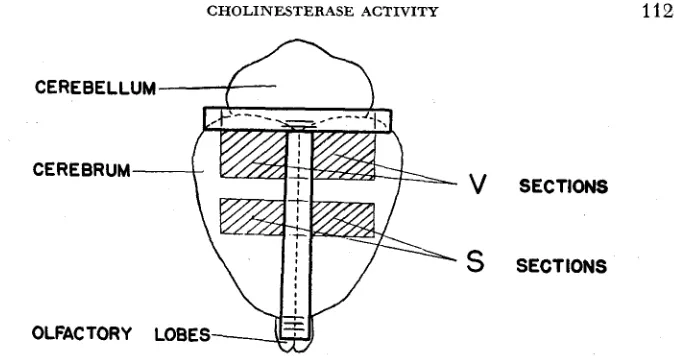
Matings were made randomly between members of the two litters. After the birth of offspring from these matings, the male parents only were sacrificed for chemical analysis in the 200-250 day age range over which ChE activity remains relatively stable (BENNETT, ROSENZWEIG, KRECH, KARLS- SON, DYE, and OHLANDER, 1958). The ChE analyses were made, and the off- spring from the highest sire (in the case of a high line or the lowest in the case of a low line) in each of the parental litters were saved, thus affording two new litters with which the process was repeated in the next generation. The measure- ments on which selection was based were, in all cases, deviations from litter means so that possible maternal and other cage effects did not affect selection.The assay of ChE activity has been reported elsewhere in detail (KRECH, ROSENZWEIG and BENNETT 1956). The animal was decapitated, and samples from the visual ( V ) and somesthetic (S) areas of the cerebral cortex were excised (Figure 2). The remainder of the cortex was stripped away, leaving the sub-
SELEL I SIRE
cTED-LITTER NO. I ANY LITTER N0.2
SELECTED
/ SIRE
1
SELECTED / n SELE51
SIRE
V T T E R , \ NO1 UTTER NO
'ED
ETC. ETC.
CEREBELLUM
a
CEREBRUM-
OLFACTORY
V
S
SECTIONS
SECT IONS
FIGURE 2.-Rat brain and superimposed T square with which the areas to be ablated are de- lineated.
cortex, olfactory lobes and cerebellum, all of which comprise the subcortical sample. These samples were then weighed rapidly, quick-frozen on dry ice, and stored at -20°C until analysis which followed within the week. Just before the analysis, the sample was homogenized in cold 0.9 percent saline. With the use of a Nielands-Cannon Automatic Titrator (NIELANDS and CANNON 1955), the enzyme activity was determined under standardized conditions by the rate of hydrolysis of acetylcholine perchlorate (ACh)
.
The activity of the sample was expressed as moles of ACh x 1O1O hydrolyzed per minute per milligram of tissue. The cortical ChE activity was taken as the average value of the visual and somesthetic areas [ (V+
S ) /2].RESULTS
1126 T. H. R O D E R I C K TABLE 1
Results of selection for ChE actiuity.
Number (N), mean (X), standard deviation ( s ) , standard error (s;)
High High
niinns
Line .I’ F s 5; low
Sel. minus
gen.’ Line N f s 5; low
So RD
S , RDhrgh
RD low
S , RDhigh
S , RDhigh
S , RDhigh
RD low
RD low
RD low
S , RDhigh
S , RD high
RD low
RD low
14 59.04 4.53 1.21
8 59.65 3.51 1.24 - 1.77 7 61.42 5.41 2.05
9 62.30 3.28 1.09 14.31
8 47.99 3.03 1.07
10 58.77 4.30 1.36 5.52
7 5325 2.44 0.92
10 6360 3.45 1.09 12.48
8 51.12 2.27 0.80
1 1 61.03 4.09 1.23 13.91 8 47.12 2.19 0.77
8 60.67 2.11 0.75 12.04 8 48.63 2.67 0.95
RC
RC high
RC low
RC high
RC low
RC high
RC low
RC high
RC low
RC high
RC low
RC high RC low
14 57.76 6.42 1.05
4 57.65 2.23 1.11 5.56
9 5e.W 5.38 1.79
8 60.41 5.63 1.99 3.99
6 56.42 5.55 2.27
9 53.29 2.62 0.87 7.91 6 95.38 3.91 1.59
9 58.81 3.32 1.10 6.95
8 51.86 2.71 0.96
15 54.21 3.31 0.86 9.13 13 45.14 2.43 0.68
5 64.37 2.43 1.09 16.54 8 47.03 2.87 1.01
’ Selected generation
=1
4 4 i
I . .
.
.
. .
0 2 4 6 8 1 0 1 2
CUMULATED SELECTION DIFFERENTIAL
OFFSPRING OF RC HIGH ( S 5 )
BY
OFFSPRING OF R C LOW (S5)
R D LOW tS5)
BY
I ‘1 ‘2 ‘3 ‘4 ’ 5 ’6
GENERATION
as indicated by the values of s,- compared with the generation shifts within a line.
Selection was successful almost immediately, and the lines remained apart in the succeeding generations. In all the 12 pairs of generation points represented in both stocks, only one pair, RD S,, is reversed from the direction selected. The probability, that of 12 independent comparisons, 11 or more would by chance be in agreement with the direction of selection, is
(1/2)l2
4-
12(1/2)11(1/2) or 13(1/2)" =0.0032.There were no overlappings of the high and low distributions for generations five and six for the RC lines and generations two, four, five and six for the
RD
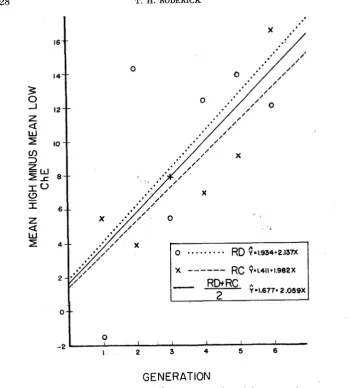
lines.To ascertain whether selection continued to separate the high and low lines as the experiment progressed, regression lines of the high-low difference for both stocks were estimated, each generation contributing one point to the array to which the lines were fitted (Figure 4 ) . Also, a regression line was fitted to an array of points based on the average of the divergence of both stocks for each generation. An analysis of variance was performed to test the significance of
these regression lines
.
P = 0.18 (regression line of separation of RD lines).
P = 0.02 (regression line of separation of RC lines).
P
<
0.01 (regression line of average of separation of RD and RC lines). From these data it is observed that selection was successful in separating the lines by approximately two ChE units per generation. The direction and extent of the deviations from regression in the latter generations do not give any indi- cation of an incipient plateau.,The significant positive linear regression of the separation of lines is evidence that selection acted upon a polygenic system. Crosses were made between the S,
generations of the two stocks so as to form a high-by-high line and a low-by-low line. The mean ChE values of the offspring of each cross are comparable in magnitude to the means of the parental stocks for the S, generation (Figure 3 ) .
These results indicate that even stocks of very different ancestry do not differ with respect to genes showing dominance for ChE activity, or if they do, that the direction of dominance at different loci is almost exactly balanced in plus and minus directions in both high or both low lines. The latter alternative would be exceedingly unlikely. Epistatic effects of gene differences between the stocks,
if present, would be expected to result in shifts of the ChE values of the progeny.
If different epistatic effects existed between the two stocks, the means of the off- spring between the stocks would be expected to shift from their midparent values. Unless identical genes were selected in the two unrelated foundation stocks, it can be concluded that the high and low lines differ mainly in genes that are largely additive.
1128 T. H. RODERICK
3
s
z
a
w
I
140
O t
0
1 I I I I I
2 3 4 5 6
I -2
GENERATION
FIGURE 4.-The regression of mean high ChE minus mean low ChE on generation.
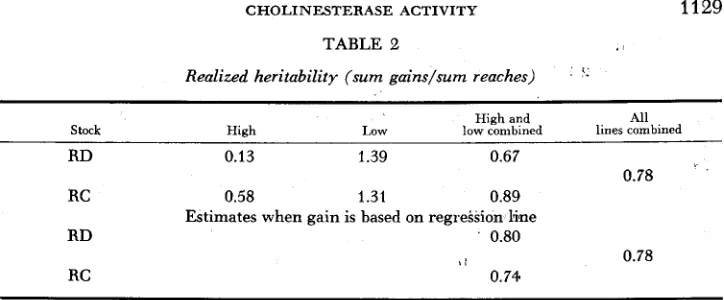
from his own litter mean. These values were averaged for the selected sires of the two litters of each line within .each generation and then divided by two, because only sires were selected. The gain was estimated as the average value of the ~ n -
weighted litter means of the succeeding generation, minus the average value of the sires' unweighted litter means. The h2 estimates (Table 2), therefore, are within-litter estimates where the gain is approximately some constant times the additive genetic variance within litters. The reach is the same constant times the total variance within litters and would not include any variance from ma- ternal or other litter effects.
TABLE 2
Realized heritability (sum gains/sum reaches) I - High and All Stock High Low low combined lines combined
R D 0.13 1.39 0.67
R C 0.58 1.31 0.89
RD 0.80
RC 0.74
0.78
Estimates when gain is based on regression h e
1 0.78
It is possible that the whole assay technique has for some reason gradually yielded lower ChE values, although assays of other strains, for .which the mean values of ChE are well established, have shown no downward trends. Inbreeding depression is not a factor because the high-by-high and low-by-low crosses, with inbreeding coefficients of zero, fall right in place with the S, generation of the original selected lines.
The numerators of h2 computed by gain over reach depend only on the means of the litters of the first and final generations. To reduce this possible sampling error and to give equal weight to the gains in intermediate generations, total gain was also computed from the least squares regression line of Figure 4. It is, to some extent, coincidental that both estimates for all lines combined are exactly the same. It is interesting to note that the selection differentials were almost identical between the two high lines and between the two low lines. Wherever possible the extreme animals were selected, and no attempt was made to control the differentials in any way.
At the outset of the program, heritabilities were estimated in two other ways. An estimate of 0.163 with 95 percent confidence limits of 0.004 and 0.692 was made from a comparison of five inbred strains. This estimate is based on the as- sumptions that the strains are completely homozygous, and that they are unre- lated strains picked at random from a hypothetical population of strains. Since these assumptions are not completely valid, the estimate is probably an under- estimate of h2. The other estimate was obtained by comparing phenotypic and genotypic relationships between sibs of the foundation stocks. The RD h2 esti- estimate was 0.069 with 95 percent confidence limits of -.570 and 1.559. The RC h2 estimate was 1.423 with 95 percent confidence limits of 0.525 and 1.947. These heritabilities are estimated assuming that the genetic variance between sibs is half that of the whole population. If this assumption is not completely true (and there is doubt about it in the RD stock, as it was derived from a cross be- tween two lines descended from an original four-way cross), then the estimate would tend to be biased in the minus direction. Also, the assumption is made that besides common genetic effects, no common litter effects, such as maternal effects, prevail; such effects would produce a bias in the plus direction.
1130 T. H. RODERICK
in the low direction suggests that natural selection may have opposed upward se- lection. The high lines were in one respect characteristic of animals with lowered fitness if body weight in this case can be considered a manifestation of fitness. Figure
5
summarizes the values of the mean body weights at the time ofChE
determination for each line for the S 5 and S, generations plus the SI generation of the high-by-high and low-by-low crosses. Earlier generations were not weighed. Again, as in the ChE summary, the two or three litters making up each point are taken as single arrays in computing their standard errors. Visual comparison of the data of the high and low lines both between and within stocks, and between the crosses reveals an obvious negative association between litter mean cortical
320)
.(
0 :
-5 6 I
GENERATION
ChE and litter mean body weight. Although heterosis appears to be manifested in the body weight means of both cross lines, the separation remains.
Disregarding the means and taking only within-litter correlations between ChE and body weight (i.e., a value of each variate is the deviation from the litter mean) of all animals of generations S, and S, and the S, of the cross lines, led to the following result: within-litter correlation of ChE and body weight = -0.19;
N = 97;
P
<
.05 (two-tail test). The negative relationship thus holds both be- tween the lines and within the litters. That the within-litter correlation is in part due to a genetic correlation is evidenced by the separation of the body weight means through selection for ChE.There are now some preliminary behavioral data on the selected lines (KRECH,
personal communication) which seem to indicate that the high ChE lines are poorer than the low lines in adaptive behavior as measured by a variety of maze situations. Adaptive behavior may be considered a manifestation of fitness.
Reproductive fitness in terms of percent sterility did not differ between the high and low lines. Also mean litter size was apparently not affected by selection. Information from variables concomitant to selecdion concerning the mechanism of selection: It is important to understand the physiological mechanisms through which selection has acted to alter the phenotypic expression of ChE activity if the implications of enzyme activity alteration by genetic means are to be con- sidered. In these experiments, because activity is measured per unit weight of tissue, it is necessary to know, for example, if there are merely more cells per unit weight in high ChE animals than in low ChE animals (with the assump- tion that more cells mean more nucleoprotein and therefore more enzyme ChE). For the psychologist interested in ChE activity and behavior, important generalizations from psychological studies on these lines might be based on the hypothesis that the mode of action of selection has been primarily through some direct biochemical alteration of ChE activity. If ChE activity had been altered because of gross neurological tissue changes, then it would be more reasonable to study gross tissue changes and behavior, with ChE activity as an interesting side light. It is desirable to distinguish between such mechanisms as this and the more direct mechanisms probably of an intracellular biochemical nature.
During the selection program other variables than ChE activity were measured to find out if any correlated responses to selection did occur. From these observa- tions an attempt has been made to begin the clarification of the mode or modes of the physiological action of selection.
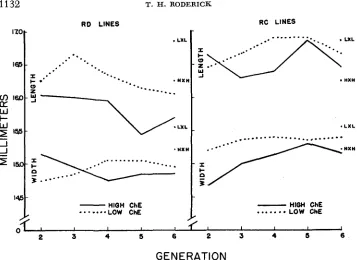
Brain size: With the use of vernier calipers, lengths and widths of the cerebrum were measured for all assayed animals beginning with generation S, (Figure 6). The probability that chance alone could have permitted the consistant difference observed in lengths for all generations measured is:
2 [(1/2)11+ 11(?4)10(s)] =0.017 (two-tailtest)
2 [(%)I1+
ll(1/2)Io(X)
+55(1/2)9(1/2)2] =0.065.1132 T. H. RODERICK RD LINES
i7nr
RC LINES r
-
-
..
HIGH ChE...LOW ChE HIGH ChE
- . . - * * * L O W ChE
I I I I I I 1
2 3 4 5 6 2 3 4 5 6
0
GENERATION
FIGURE 6.-The change in cerebrum length and width with selection for ChE.
sidered together indicate that the smaller brain dimensions of the high ChE lines is highly significant.
ROSENZWEIG, KRECH and
BENNETT
(1958a) found a gradient of ChE activity over the cerebral cortex of the rat; ChE decreases from anterior to posterior. Thus, the somesthetic area of the cortex has a higher activity than the visual area. The V and S areas of the cortex (before they were ablated for assay) were care- fully delineated on the exposed brain by the use of a small plastic T square (Figure 2). The T square was centered on the cortex and the position of the S section was determined by delineating a specific area at the center of the cortex. The position of the V section was then determined by measuring a definite dis- tance posterior to the S section. Because the S areas were taken from the center of the cortex, it is reasonable to consider them physiologically comparable between the high and low lines if selection has not affected the gradient in some fashion. The V sections might, however, for reasons of differences in brain length, be histologically different between high and low animals, since the V sections were determined by marking a fixed distance from the S section. However, since the ChE values of the V sections remained approximately 6.3 ChE units below theS
sections in both high and low lines throughout the program, there is no evidence that possible sampling of histologically different areas is either assisting or counteracting ChE separation between high and low lines.
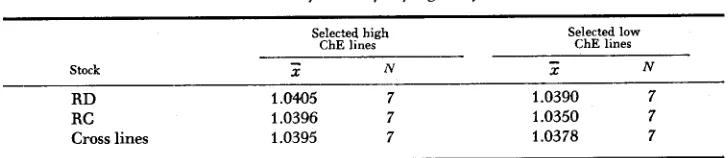
tion and that a study of any differences in brain density might shed further light on the physical basis for ChE separation brought about by selection. Brain specific gravities were measured from animals of the S, and S, generations of the four original lines plus the S, of the cross lines (Table 3). Since immersion of the brains in water for the determination would have altered the weights of the cortex in any subsequent ChE determination of the same brains, the regular ChE assayed males could not be used. Instead, females sibs of the males were used. The females were sacrificed between 200 and 300 days of age, their brains re- moved and weighed in air, and then weighed in distilled water. The brain weight in air divided by the loss of weight in water (corrected for temperature variation of the water) was taken as the specific gravity of the brain. A test of the dif- ference between the means of the high and low line shows that the animals from the high ChE lines have a significantly greater brain density than do animals from the low ChE lines:
P <
0.01.The interaction and between stock variations were not significant.
This association, of course, does not help to explain the ChE separation from selection, as ChE is measured per unit weight tissue; however, the high lines would show even higher ChE if it were determined per unit volume instead of weight.
Since protein is denser than water and most other major cell constituents, an important question is whether the protein percentage has merely increased in the brain cells of the high line animals and decreased in the low, to give the observed ChE separation. An investigation of protein percentage by weight in the cortical and subcortical brain tissues has been undertaken (E. L. BENNETT, personal communication), and the preliminary results do not suggest any association
Subcortical
ChE:
On some of the animals from the S, and S, of the original and the S, of the cross lines, subcortical ChE values were determined. Subcortex here means the whole brain minus the cerebral cortex which was stripped off. The separation of subcortical ChE between the lines was highly significant (Table 4 ) .The within-litter coefficients of variation for cortical ChE and subcortical ChE were 4.79 percent and 3.26 percent, respectively.
with ChE.
TABLE 3
Means of brain specific gravity
Selected high Selected low ChE lines ChE lines
N
-
Stock X N 2
R D 1.045 7 1.0390 7
RC 1.0396 7 1.0350 7
Cross lines 1.0395 7 1.0378 7
1134 T. H. RODERICK
TABLE 4
A comparison of cortical ChE and subcortical ChE of the same animals with respect to their separations between high and low lines selected for cortical ChE
Cortex
L
~~~.
-
- -
High Low
Stock Generation 2 1 2 2 xl-r, t df P
RD s 5 . 57.11 44.96 12.15 12.15 9 <.WO5
S 6 60.68 48.63 12.05 20.00 14 <.WO5 RC s5 53.40 44.59 8.81 11.17 15 <.0005
SI3 64.37 47.83 16.54 21.94 11 <.0005 Cross
lines Sl 61.46 48.48 12.98 18.88 16 <.WO5
Subcortex
High L2w
-
-
Stock Generation 2 1 2 2 z1-=2 t df P
RD s 5 128.30 122.50 5.80 3.09 9 <.Ol
RC s5
s,
134.25 125.88 8.37 6.27 14 < . O Ws,
152.20 122.75 29.45 9.67 11 <.OW5 130.88 130.33 0.55 0.19 15 >.%Cross
lines Sl 132.75 125.79 6.96 6.85 16 <.OOU5
TABLE 5
Summary of correlations (r) b y lines between cortical and subcortical ChE
Line r N
R D high RD low
RD lines combined
+
11+
.48 16+
.56 17RC high
+
.73 13RC low - .04 17
RC lines combined
+
.50 30High-by-high
Low-by low
+
.71 4
+
.37 14The correlation between cortical and subcortical values was estimated in a number of ways:
r N
over-all +.68; 75
within litters +.50; 75
between litter means +.77; 20
Although there do not appear to be any differences in the magnitude of these correlations between the stocks, there is some indication that the high selected lines have a higher correlation. (The insignificantly negative RC low correlation may have resulted from sampling error. Although the difference between the
RC high correlation and the RC low correlation is significant at the one percent level, more data on the RC animals would be helpful to determine whether the magnitude of the difference is as great as observed in these data.) However,
ROSENZWEIG, KRECH, and BENNETT (1958b) found lower correlations in higher ChE lines in two comparisons, one of which involved other animals from the RC stock. The differences observed here may be fortuitous.
The conclusion to be drawn from these data is that a considerable positive correlation exists between cortical and subcortical ChE. The author feels that the same general conclusion can be drawn from the data of ROSENZWEIG, KRECH, and BENNETT (195813). The fact that their correlations are not within-litter cor- relations may account for the general difference in magnitude between their correlations and those reported here.
Thus, the estimate of the correlation between lines is similar to the correlation estimate within litters. Their similarity in magnitude suggests they are estimates
of the same value and is evidence for a large genetic component of the correlation. An important consideration is whether cortical ChE as measured by ( V
4-
S) / 2 is as highly correlated with subcortical ChE as it is with ChE of other areas of the cortex. The motor sections (sections of the cortex comparable to the S section in size but more anterior in location) of 16 animals of the cross lines were assayed. These animals comprised two high and two low line litters of which the mean values were:Litter mean ChE
Line Litter (M section)
H x H
514a 70.0515 71.8
L X L 618 58.7
615a 58.5
The within-litter correlation between
(V
+
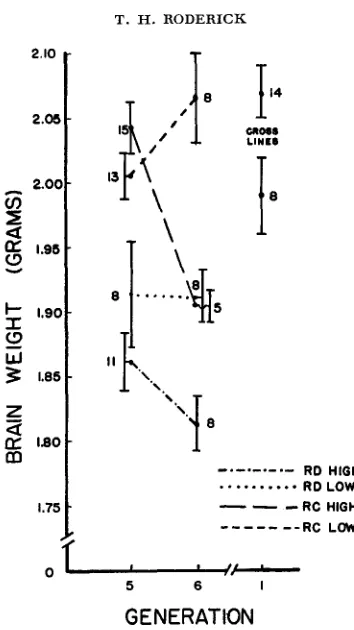
S ) / 2 and M of all 16 animals was .74 which is significant at the one percent level. The similarity of magnitude of the correlations suggests that selection for ChE in an area of the cortex will affect the ChE in the unselected subcortex almost as greatly as ChE in any other unselected area of the cortex.Brain weight: Although the brain densities are greater in the high lines, the brain weights are lower. Figure 7 shows the means of the brain weight for the
1136
2.10
2.05
2.00
z
a
1.96z
I- 1.90
s2
3
I
W
3
1.85z
a
a
180m
-
1.75
T. H. RODERICK
I-
-
-
-
-
-
-
-
I3
\
0
-5 6 I
GENERATION FIGURE 7.-Mean brain weights of each line with N and S,-.
brain weights of these animals, a correlation of f.83 (P
<
. O l ) was found. Correlations between these three variables were also estimated within the litters, i.e., taking the value of each variate of each animal as its deviation from its own litter mean. The results based on 97 animals are summarized here with the one-tail probability of each correlation.ChE, brain weight
body weight, brain weight
I = - .22; P = .010
I =
+
.33; P<
.001ChE, body weight I = - .19; P = .025
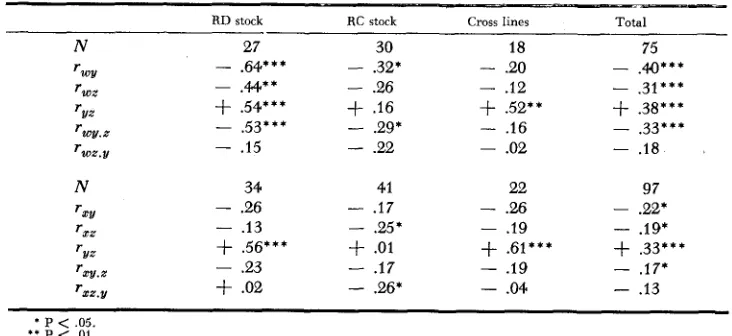
TABLE 6
Within-litter correlations and partid correlations for the uariables: cortical ChE, subcortical ChE, brain weight, and body weight where w is subcortical ChE, x is cortical ChE,
y is brain weight, z is body weight
RD stock RC stock Cross lines Total
___-
-
N 27 30 18 75
- .64*** - .32* - .20 -
.a***
TWY
TWZ - .44** - .26 - .I2 - .31***
rvz
+
.54***+
.I6+
.52**+
.38***rww.2 - .53***
-
.29* - .16 - ,33***‘;ox.v - .I5
-
.22 - .02 - .18N 34 41 22 97
- 2 6
-
. I 7 - .26 - .22*rXt!
r X Z - .13 - 2 5 ’ - .I9 - .19* rl/z -/- .56***
+
.01+
.61***+
.33***rxv.x
-
.23-
.17 - .19 - .17*rxx.v
+
.02-
.26* - .04-
.13* P < .05.
* * P < .01.
* * * P < ,005.
any strain differences exist with respect to the magnitude of these correlations.
In addition, it may be noted from these data that the correlations of the ChE variables are generally greater with the brain weight than with body weight. That the negative association does not entirely disappear between the ChE variables and body weight when brain weight is held constant (five out of the six partial correlations T - ~ ~ . ~ are negative, and one is significant by itself) suggests
that the negative association between the ChE variables and brain weight is probably not the only influence in the ChE-body weight correlation. Also from these data, as was found by KRECH, ROSENZWEIG and BENNETT (1958), of the two ChE variables, the subcortical ChE has the greater negative correlations with the weight variables. This greater negative association may be real, or it may be that more of the subcortical ChE variation is genetic than the cortical ChE; the lighter weight of the cortical ChE brain samples may subject those samples to more experimental weighing error.
1138 T. H. RODERICK
histological and cytological work, the basis for these associations remains con- jecture.
A positive, but insignificant, correlation between brain weight and cortical ChE was found by KRECH, ROSENZWEIG and BENNETT (1958), who also found a significant negative correlation between brain weight and subcortical ChE only. Since from their findings, and those presented here, subcortical ChE and brain weight are negatively correlated, it is not surprising that cortical ChE and brain weight are also negatively correlated as the cortical and subcortical ChE activi- ties are themselves highly positively correlated.
Body color and colol- patterns: Since obvious single-gene differences were present in the stocks, a study of any possible association between them and ChE was made. The following alleles were present:
RD stock RC stock
agouti, nonagouti agouti, nonagouti hooded, nonhooded hooded, nonhooded albino, nonalbino albino, nonalbino
dilution, nondilution shaker, nonshaker hairless, nonhairless
Although some tendency for fixation of alleles occurred, there was no pattern of association between direction of selection and the increase in frequency of a particular allele.
CO N CL USIO NS
The correlated responses to selection, which were found in particular traits and not in others, help to elucidate the physical basis of the action of selection to produce the ChE separation. The positive association of brain density with ChE suggests that further attempts to determine percentages by weight of cell and tissue constituents which differ in density may be helpful to clarification of this physical basis. For example, the less dense, and as yet unstudied, myelin of the brain may have increased in the low lines to lower the ChE activity as it is measured. The lack of correlated response of percent protein by weight rules out the simple explanation that selection has merely altered protein percentages causing the ChE changes and brain density changes.
The high correlated response of subcortial ChE indicates that the genes affect- ing the variation of ChE of the cortex are to a great extent the same genes which affect the variation of subcortical ChE. Therefore, selection has not been specific to the cortex.
It
would be of interest to note if ChE levels of other tissues, such as the blood, have also been altered to any extent.It may be said that selection for cortical ChE, possibly through some cell or tissue constituent which could be characterized in one way by its density, has produced changes in ChE activity in the whole brain.
SUMMARY
Selection for high and low cortical cholinesterase activity (ChE) in the rat has been successful in two genetically heterogeneous populations of different an- cestry. The ChE separation of the lines was continuous over the six generations, implying that the genetic variation of ChE was determined by several genes. The greater part of the within-litter variation of ChE was due to genetic vari- ation (realized
h2
= 0.78). Some animals of each l ~ e of the S, generation were mated to produce two cross lines between the stocks-a high-by-high line and a low-by-low line. The ChE values of the cross lines were comparable to their re- spective parental lines of theSs
generation.Selection in the high direction was much less successful than in the low direc- tion. Natural selection possibly may have countered artificial selection, but be- cause of other data
(h2
in the low direction exceeded 1.0 in both stocks) it appears that other undetermined factors must have been operating.Other traits were studied for correlated response to selection. The significant associations found were: (1) brain size negatively associated with ChE; (2) brain density positively associated with ChE; (3) brain weight correlated with body weight, both of which were negatively associated with ChE and subcortical
ChE;
and(4)
subcortical ChE positively associated with ChE. The studies ofcorrelated responses indicate that the successful selection for cortical ChE, pos- sibly through some cell or tissue constituent which could be characterized in one way by its density, has produced parallel changes in ChE activity in the whole brain.
ACKNOWLEDGMENT
I a m particularly indebted to PROFESSOR EVERETT R. DEMPSTER for his guid- ance and counsel throughout the course of the investigation. I am grateful for the opportunity to have associated in this program with PROFESSOR DAVID KRECH
and DR. EDWARD
L.
BENNETT and for the fruitful discussions with them. I also wish to express my appreciation to MRS. HILDA KARLSSON RODERICK who per- formed all the brain surgery and ablations for the project.LITERATURE CITED
1140 T. H. RODERICK
KRECH, D., M. R. ROSENZWEIG, E. L. BENNETT, and B. KRUECKEL, 1954 Enzyme concentrations in the brain and adjustive behavior patterns. Science 120: 994-996.
KRECH, D., M. R. ROSENZWEIG, and E. L. BENNETT, 1956 Dimensions of discrimination and level of ChE activity in the cerebral cortex of the rat. J. Comp. and Physiol. Psychol. 49:
26 1-268.
Correlation between brain cholinesterase and brain weight within two strains of rats. Am. J. Physiol. 196: 31-32.
Experimental check of the effectiveness of selection for a quantitative character. Genetics 38: 421-443.
Automatic recording p H instrumentation. Anal. Chem. 2 7 : 29-33.
Brain chemistry and adaptive be- havior. Biological and Biochemical Bases of Behavior. Univ. of Wisconsin Press. Madison, Wisconsin.
Brain chemistry and adaptive behavior. Ciba Found. Symp. on Neurological Basis of Behavior. J. and A. Churchill Ltd. London, England.
Production of high and low blood p H lines of mice by selection and inbreeding. J. Heredity 46: 125-132.
Fifty generations of selection for protein and oil in corn. Agron. J. 44: 60-65.
1958
KYLE, W. K., and A. B. CHAPMAN, 1953 NIELANDS, J. B., and M. D. CANNON, 1955
ROSENZWEIG, M. R., D. KRECH, and E. L. BENNETT, 1958a 1958b
WEIR, J. A., and R. D. CLARK, 1955