THE DIRECT ESTIMATION OF MUTATION RATE FROM MUTANT FREQUENCY UNDER SPECIAL CONDITIONS
MAURICE OGUR, RALPH ST. JOHN, SYLVIA OGUR AND ABRAHAM M. MARK Biological Research Laboratory and Department of Mathematics,
Southern Illinois Uniuersity, Carbondale, Illinois
Received August 4, 1958
HEORETICAL analyses of the growth of microbial populations containing
T
two types of individuals, subject to mutation from one to the other based upon either deterministic or probabilistic models, have been made by LURIA and DELBRUCK (1943) ; SHAPIRO (1946) ; ARMITAGE (1956) and others. Where the growth and mutation rates of normal and mutant cells are unequal, a complex situation arises with four independent growth and mutation rate constants. Where selection o r backmutation are excluded, the situation is simplified.In the current study we introduce an extreme simplification; total selection against the mutant. Exclusion of mutant growth and backmutation can be shown to produce a population equilibrium in which the mutant frequency is numeri- cally equal to the mutation rate.
If n = n ( t ) is the number of N (normal) cells at time t , and m = m ( t ) is the number of mutant cells at time t, then we write
dn
(1) - = k n
dt and
dm ( 2 ) -=an
dt
Equation ( 1 ) expresses the rate at which N cells produce N off spring with k defined as the rate constant in this process. The overall growth rate would be represented by
k
+
a. Equation (2) asserts that the rate at which the M popula- tion is increasing depends only on the number of N cells available for mutation with a defined as the mutation rate constant. Since M cells cannot divide in the selective growth medium they arise only by mutation of N cells.These equations are based essentially upon the conventional deterministic formulation of the laws of population increase. Alternatively, in a stochastic for- mulation they may be shown to represent the mean numbers of N and M cells at time t .
From ( 1 ) we have
(3) n=noekt
where no is the number of N cells at time t = o . Inserting ( 3 ) into (2) we have d m
~- -a no ekt
484 M. OGUR, et al. whence
+
m p - -(
k
a n, ekt ( 4 ) m=-
k
where m, is the number of M cells at time t = 0. Combining ( 3 ) and (4) we have
whence
m - a
~ - _ _ _
lim
(5) t - + w n t m k f a
Thus, when population equilibrium has been reached after growth in exponen- tial phase in a medium totally selective against the mutant, the relative mutant frequency equals the mutation rate. Expressions comparable to equation (5) may also be obtained by imposing the limiting conditions of no mutant growth or back- mutation upon derivations of SHAPIRO (1946) ; ARMITAGE (1952) or MARCOVICH
The spontaneous cytoplasmic mutation to respiration deficiency (aer) in yeast (EPHRUSSI 1953) was chosen to test the analysis because it represented an experi- mental system in which the imposed limitations could be very nearly realized. The aer mutants apparently arise only during growth and do not revert to respira- tion sufficient ( A E R ) cells under all conditions which have been tested. Media totally selective against the aer mutant have been constructed with carbon sources which are oxidized but not fermented (OGUR, LINDEGREN and
LINDEGREN
1954; OGUR and ST. JOHN 1956).(1953).
T h e relative error
in
estimating mutant frequency arising from the budding of yeastsESTIMATION O F MUTATION RATE 485
firmed qualitatively by direct observation of budding in hanging drop prepara- tions. The relative frequency of doublets, triplets, and quadruplets may be as- sumed to reflect their relative average time duration in the budding cycle. The infrequent occurrence of configurations larger than quadruplet indicates that any more complex growth patterns should have no significant effect on population analysis unless it is preferential for configurations containing mutant buds. W e have no evidence bearing on the latter assumption.
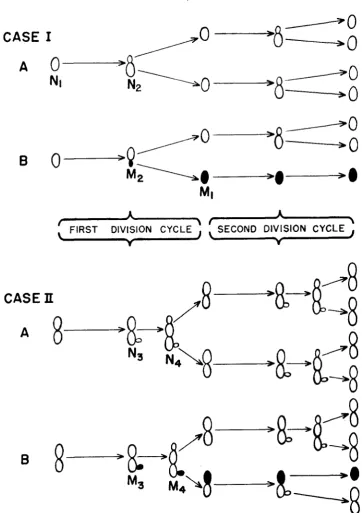
The two budding patterns described above, and their effects on the production and expression of aer mutants, are represented diagrammatically in Figure 1 for the case of growth in the selective medium in which mutants form but do not divide.
It will be noted that in case I the mutant bud formed in a given budding cycle will be expressed at the end of that cycle when the mutant separates from its mother cell. In nonsynchronous populations the estimate of mutant frequency will be biased, however, if mutants in mixed doublets are not expressed. (This possibility will be considered again in relation to the appearance of variegated colonies.)
In the case I1 pattern mutant buds may arise only at the triplet or quadruplet stage and do not express themselves at the end of the generation in which they are produced, but after a bud separation lag of one additional generation. This is analogous to segregational lag in the expression of mutation of nuclear origin in binucleate microorganisms ( LEDERBERG 1949)
.
W e have attempted to evaluate the errors in estimation of mutant frequency for both budding patterns.
Let n,, n,, n,, n4, m,, m,, m3, m6, stand for the number of normal ( N ) and mutant ( M ) configurations shown in Figure 1.
Let T denote the total number of configurations.
Let f denote the relative mutant frequency based on configurations.
Let F denote the relative mutant frequency based on cells rather than con- We are interested in the relative error
figurations.
Case I
m T T = n l
+
n,+
m2+
mp f = L- ml
+
me -ml
+
m, n1+
2n,+
m,+
2m, F=T
+
n,+
m, n,+
m,T Let C, = the relative frequency of doublets =
n2
+
mBc,
486 M. OGUR, et al.
A
0
A
0
6
-
0
/*-
N2?---0-
8
-
0
CASE
I
A
0
-
0
NI
A
A
V V
‘
FIRST DIVISION CYCLE’ ‘
SECOND
DIVISION CYCLE’
CASE
II
8
9
8
&-
M3
-e
‘-8
FIGURE 1.-Budding patterns of yeast strains in exponential growth in a selective medium.
N I = normal singlet; N , = normal doublet; N , = normal triplet; N , = normal quadruplet.
E S T I M A T I O N O F M U T A T I O N RATE
and
487
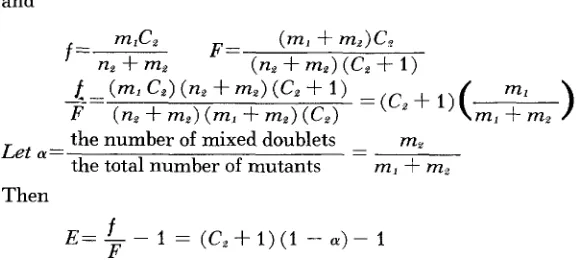
Then
E = - -
f
1 = ( C , + 1 ) ( 1 - C Y ) - 1F
We note that CY has a maximum possible value of 0.5 when all last generation
mutants are present as doublets. As C, += 1 and CY .+ 0.5, E .+ 0. Thus in a popu-
lation consisting overwhelmingly of doublets, with mutant doublets unexpressed, the errors in estimation of mutant and total populations are compensatory.
TABLE 1
Calculated errors in estimating mutant frequency due to budded cells (case I )
c,*
1 0.83 0.80 0.75 0.66 0.5 0.33 0.1 0a t 0.5 0.42 0.40 0.38 0.33 0.25 0.17 0.05 0
ES 0 7% 8% 9.4% 11% 12.5% 11% 4.5% 0
nz
+
mz* Cz=the relative frequency of doublets=-
T
the number of mutant doublets
+
a = -the total number of mutants
$ E = t h e relative e r r o r = ( C z + 1 ) ( 1 - a ) -1 mz
m~
+
m r-
Table 1 shows the calculated relative errors arising from various values of C, between 0 and 1. Values of CY have been paired with values of C, on the assumption
that the decrease in the proportion of mutant doublets will parallel the decrease in the proportion of all doublets. C, can be evaluated by direct counts at the time of plating. There appears to be no convenient way to evaluate (Y experimentally,
but it is apparent that in nonsynchronous division it would be somewhat smaller than 0.5 and would tend to decrease with C,. If CY does not decrease as rapidly as
C,, the calculated error will be somewhat smaller. I n any case, it seems conserva- tive to conclude that the maximum probable relative error in the estimation of mutant frequency due to budding in the case I pattern will be less than 20 percent. Case I1
T=nl
+
ne+
n3+
n4+
m,+
m2+
m3+
m4m m , + m , + m , + m !
T
f = 2 F =
488 M . OGUR, et al.
ruplets so that
no
+
m4T
c,
+
cz
+
e,
+
c , = 1c,
= n ,+
m3T C , = n2
+
m2T C, = nl
+
ml C,=--T
Let C5 =the relative frequency of unexpressed mutants occurring in mixed con- m2
+
nz,+
m ,T -- figurations
Then
m , C J
C,T
+
2C,T+
3C,<T+
4C4T F=and
f
+
c5 -f
+
c5
- F=-
c,
+
2 c z+
3C,+
4c, 1+
c,
+
2C,+
3C4The quantity C,
+
2C,+
3C, can be evaluated experimentally by direct countof the relative frequency of doublets, triplets and quadruplets. In a series of experiments with diploid yeasts, growing in exponential phase according to the case I1 pattern. this quantity appeared to be relatively constant (1.20-1.60).
The evaluation of Cj is difficult, but a maximum of C,=3f would express the limit if all mutants of the last two generations before plating were present in mixed configurations and were unexpressed.
Taking a mean value of 1.40 for C,
+
2C,+
3C, we get F=--.-f
+
3f2.40
- 1 = - 40 percent
f
2.40F 4
E = - - - I = -
Thus, with the more complex budding pattern of case 11, the maximum prob- able relative error due to the presence of configurations larger than singlets is
-40 percent.
Tho relatiue error arising from phenomic lag
If newborn mutants are capable of several divisions in the selective medium before their respiratory capacity is diluted out. an upward bias will be imposed
on the mutant frequency. Assuming that the growth rate of mutants in phenomic lclg depends directly on residual respiratory capacity which is partitioned equally in four or more phenomic lag generations the bias can be calculated to be
+
78 percent. Since some of the mutants in phenomic lag must be present as doublets, a more correct estimate would be somewhat smaller (ca.+
50 percent). The rrrors introduced by the case I1 budding pattern (ca. -40 percent) and phe- nomic lag are thus partly compensating. Phenomic lag which occurs after plating does not influence the estimate of mutant frequency since colony type is diag- nosed after four days, at which time all mutant configurations have become mutant clones.E S T I M A T I O N O F M U T A T I O N R A T E 4 89 cise population estimates of mutant frequency in haploid strains somewhat dubious at present.
M A T E R I A L S A N D M E T H O D S
The yeasts employed were diploid cultures from the Carbondale collection of inbred Saccharomyces strains. They were chosen for reasonably close adherence to the case I1 budding pattern.
The storage medium was yeast extract-peptone nutrient agar containing one percent glucose. The selective medium differed only by the substitution of sodium lactate (approximately one percent end conc., pH 5.5) for glucose, and by omis- sion of agar (See OGUR and ST. JOHN 1956 for details of media composition). Inocula from storage slants were grown 24 hours on glucose nutrient agar. Cells were harvested and transferred to 250 ml Erlenmeyer flasks containing 40 ml of the selective medium at an initial concentration of lo3 cells per ml. Flasks were incubated in a Dubnoff shaking incubator at 30°C. Samples taken at intervals were spread on glucose nutrient agar after appropriate dilution, to yield between 100 and 200 colonies per plate. Plates were incubated at 30°C for four days, then overlaid with agar containing 2,3,5 triphenyltetrazolium chloride (TTC) (OGUR, ST. JOHN and NAGAI 1957). Red (AER) and white (aer) colonies were scored three hours after overlay and the mutant frequency estimated as the ratio of white colonies to the total number of colonies.
In addition to red and white colonies some sectored or variegated colonies were observed. These are interpreted as having arisen from mixed configurations pres- ent at plating, or during the first few divisions on the plate. The principles of our derivation require that variegated colonies arising from an event preceding plat- ing be scored as mutant, whereas those arising from a division on the plate be scored as normal. Distinction between these alternatives is difficult. If every mutant bud arising either in the last few generations before plating or in the early divisions on the plate produced a variegated colony. it would follow that the number of variegated colonies should exceed the number of white colonies. This was not the case. It must be inferred that variable patterns of colonial growth may obscure the variegation in some cases, or stated conversely, sectoring de- pends not only on the relatively early development of heterogeneity but also on an orderly pattern of colonial growth for its expression. (Some strains with rela- tively high mutation rate have been found to produce heterogeneous colonies which nevertheless exhibited grossly homogeneous but lighter formazan color after TTC overlay.)
I n practice, the small number of variegated colonies was scored as normal since there is a somewhat greater probability that they were formed after rather than before plating.
Population equilibrium in the selective medium
490 M. OGUR, et al.
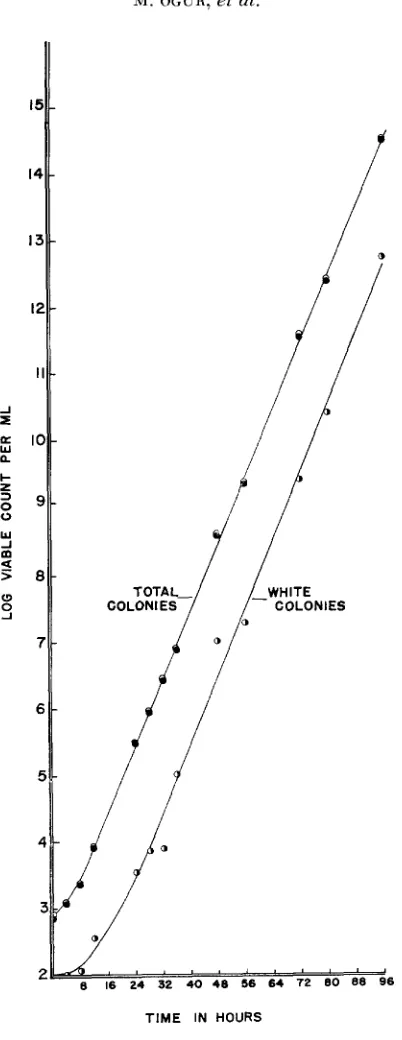
under a variety of initial conditions, were inoculated into the selective medium. Figure 2 summarizes the results of a 96-hour experiment in which the inoculum contained approximately 55 percent of aer cells. Exponential growth was main- tained by transfer of ca.
l o 4
cells to fresh medium every 24 hours. Results have been calculated back to unit volume in the original flask. The uppermost curve represents the growth of the entire population based upon the total colony count. The other two curves are based upon the red and white colony counts respec- tively. Growth in the selective medium produced a decrease in the mutant fre- quency to the equilibrium value (ca. two percent) by 32 hours. This frequency was maintained in subsequent growth in the selective medium and the curves based upon total. red and white colonies are parallel between 32 and 96 hours. Figure 3 summarizes a similar experiment in which cells of the same strain. after three 24-hour transfers in the selective medium, were harvested, washed sterilely and reinoculated into the selective medium. After some initial lag, ex- ponential growth and a n equilibrium population were again established and maintained for the duration of the experiment to 96 hours.These results are consistent with the theoretical derivation. One can calculate, for given values of initial and equilibrium populations, the number of generations required to reach a mutant frequency within five percent of the equilibrium value. Such calculations yield values between seven and nine generations for the population changes anticipated in the current study, or within 24 hours under the specified growth conditions. In subsequent routine estimations of the mutation rate, exponential growth through at least 72 hours in the selective medium was employed.
It seemed of interest to test the effect of carrying an equilibrium population into stationary phase on both the observed mutant frequency and the frequency of various budding configurations. In several experiments, flasks, from which transfers had been made at 24 hours, were not discarded but were reincubated and analyzed at 48,72 and 96 hours. As the culture was carried into the stationary phase, a trend was observed toward simpler configurations. Whereas at 24 hours in exponential phase, strain 14940 in one experiment exhibited only two percent of its cells as singlets and 62 percent as doublets (case
II),
by 96 hours in the stationary phase, singlets comprised 53 percent and doublets 26 percent of the total population (approaching case I). The mean mutant frequency calculated from several samples from the exponential phase was approximately a third lower than the mean mutant frequency calculated from a number of samples from the stationary phase. (It will be recalled that the calculated maximum probable relative error for the case I1 budding pattern was -40 percent.ESTIMATION O F MUTATION RATE 49 1
TIME IN HOURS
92 M. OGUR, et al.
d
8 16 24 32 40 48 56 64 7 2 80 88 96
TIME IN HOURS
ESTIMATION O F MUTATION R A T E 493
Mutation rates of various yeast strains from the mutant frequency at population equilibrium
Several strains which adhered most closely to the case I1 budding pattern were chosen for further study. Some were heterozygous for adenine deficiency ( a d ) , and served as controls against the possibility that meiosis and sporulation, or some other segregational mechanism, might have intervened during the pro- longed incubation in the selective medium. Microscopic examination revealed no asci and no pink ( a d ) colonies were found among the thousands scored on diagnostic plates.
Routinely, strains were inoculated into the selective medium and carried by daily transfer through 72 hours in exponential growth. Mutant frequencies were estimated as previously described. Each estimate was based on a minimum of 40
plates. T o insure the achievement of equilibrium, replicate determinations were performed on the same cultures carried for 72 additional hours in exponential growth.
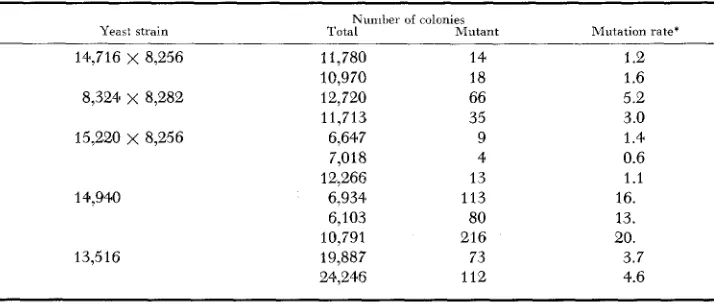
Table 2 summarizes the results of replicate determinations of the spontaneous mutation rate to respiration deficiency at 30°C. Strain dependent mutation rates from 1 x mutations per cell per generation are observed. Using different strains and methods, values ranging from 2 x to 40 x IO-? have been reported by EPHRUSSI, L’HERITIER and HOTTINGUER (1949) ; MARCOVICH
( 1953) ; and LASKOWSKI (1954). The latter’s methods required micromanipula-
tive isolation of single cells, growth to clones of 100-200 cells, spreading on the surface of agar and estimation of the number of plates containing no mutants with colony size as the diagnostic criterion (confirmed in some cases by the Nadi test or spectroscopic examination of individual clones).
to 16 x
TABLE 2
Rates of spontaneous mutation to respiration deficiency of uarious yeast strains
Yeast strain
14,716 x 8,256 8,324 x 8,282
15,220 x 8,256
14,9443
13.516
Nunilre1 of colonies
Total hlutant -
11,780 14
10,970 18
12,720 66
11,713 35
6,647 9
7,018 4
12,266 13
6,934 113
6,103 80
10,791 216
19,887 73
24,246 112
Mutation rate’ 1 .e 1.6 5.2 3.0 1.4 0.6 1.1 16. 13. 20. 3.7 4.6
494 M . OGUR, et al.
D I S C U S S I O N
Although the mutant frequency in a microbial population does not generally represent the mutation rate, it may under special conditions. These conditions are met. in theory, after prolonged growth under conditions where mutants can neither divide nor backmutate. It must be further assumed that the equilibrium mutant frequency is maintained solely by these limitations. Cytoplasmic mer mutants arising in a totally selective medium reach stable equilibria, as pre- dicted, at frequencies that are strain-dependent and resemble the mutation rates that other investigators have obtained by more laborious methods. This strongly suggests that the system under study has met the requirements of our theoretical analysis.
The observed mutant frequencies may, however, be subject to bias from several sources (e.g., phenomic lag, attached buds, and different death rates of normal and mutant cells). The probable errors introduced by the first two appear to be of comparable magnitude and opposite i n sign but the differential death rate bias is difficult to estimate by existing methods.
We have determined the death rate of nondividing mutant cells (from clonal isolates) in the selective medium to be ca. four percent per 24 hours (ca. 0.4 per- cent per generation of normals). The death rate of normal cells growing expo- nentially seemed in principle even more difficult to estimate. But a new theo- retical approach to this problem may be made if one considers that any medium is in fact totally selective against dead cells. This produces a situation comparable to the one already considered in this report f o r a mutational process; continued exponential growth should produce an equilibrium frequency of dead cells nu- merically equal to the death rate. The application of this principle will however, require more satisfactory experimental methods for estimation of low frequencies of dead cells by direct count rather than by difference between hemacytometer and plate counts. Our calculations indicate, however, that the bias introduced by anticipated death rates will be small.
A danger inherent in any “long term” population experiment is based upon the possible appearance of a third type of individual, better adapted to the growth conditions, which could replace the original cell type. W e have found no evidence that this had occurred with the strains studied.
It is interesting to consider the possibility of a general experimental solution of the problem of estimating mutation rates based upon these principles. Thus, if the culture were grown to population equilibrium in a medium totally selective against the mutant and the mutant frequency were estimated by plating on a medium totally selective for the mutant it might be possible to extend the method to mutations occurring at rates too low to be estimated by direct plating. At present, no system in which this approach may be tested is known to us.
Finally, an unusually simple demonstration of mutagenicity (see EPHRUSSI, L ’ H E R I T I E R and HOTTINGUER 1949 and EPHRUSSI and HOTTINGUER 1950 f o r
ESTIMATION O F MUTATION RATE 495 librium in the presence of potential inducing agents or conditions, enables one to conclude that this enhancement has arisen by increasing the mutation rate rather than by selection for the mutant, since the medium is already totally selective against the mutant (provided selective toxicity to the normal has been excluded). I n addition to the qualitative conclusion the enhanced mutation rate is simul- taneously estimated.
SUMMARY
The growth of a mixed population of normal and mutant cells in a medium totally selective against the mutant has been analyzed theoretically. The analysis predicts the achievement of population equilibrium with mutant frequency nu- merically equal to the mutation rate. The analysis has been applied to the spon- taneous cytoplasmic mutation to respiration deficiency in yeast. Population equi- librium was reached within 32 hours at 30°C. The strain dependent mutation rates estimated by this method fell within the range reported by more laborious methods. The probable error introduced into these estimates by phenomic lag and by plating yeasts with attached buds has been calculated. Possible application of these principles to other systems has been considered.
ACKNOWLEDGMENT
This work was aided by grants from the American Cancer Society and the National Science Foundation. W e are indebted to DRS. C. C. LINDEGREN, J. LEDERBERG, S. LURIA, F.
RYAN
and W. BRAUN for their comments on the manu- script.LITERATURE CITED
ARMITAGE, P., 1952
EPHRUSSI, B., H. HOTTINGUER, and A. CHIMENES, 1949
EPHRUSSI, B., PH. L‘HERITIER, and H. HOTTINGUER, 1949
EPHRUSSI, B., and H. HOTTINGUER, 1950
The statistical theory of bacterial populations subject to mutation. J. R . Sta- Action de l’acriflavine sur les levures.
1. La mutation “petite colonie.” Ann. Inst. Pasteur 76: 351-367.
Action de l’acriflavine sur les levures. VI. Analyse quantitative de la transformation des populations. Ann. Inst. Pasteur 77 : 64-83.
Direct demonstration of the mutagenic action of eu- flavine on baker’s yeast. Nature 166: 956.
Cytoplasmic constituents of heredity. Cold Spring Harbor Symposia Quant. Biol. 16: 75-85.
Nucleo-cytoplasmic relations in microorganisms: their bearing on cell he-
Induction, par le chlorure de tetrazolium, de la mutation “petite colonie” tistical Soc. Ser. B 14: 2-33.
1951
EPHRUSSI, B., 1953
LASKOWSKI, W., 1954
LEDERBERG, J., 1949
LURIA, S. E., and M. DELBRUCK, 1943
MARCOVICH, H., 1953
redity and differentiation. Clarendon Press. Oxford.
chez la levure. Heredity 8 : 79-88.
Bacterial variation. Ann. Rev. Microbiol. 3: 1-22.
Mutations of bacteria from virus sensitivity to virus
Rapports entre la structure des acridines et leur activitk en tant qu’agents resistance. Genetics 28: 491-511.
496 M. OGUR, et al.
OGUR, M., G. LINDEGREN, and C. C. LINDEGREN. 2954 A simple screening test for genetic studies
OGUR, M., and R. ST. JOHN, 1956 A differential and diagnostic plating method f o r population
OGUR, M., R. ST. JOHN, and S. N A G ~ I , 1957 Tetrazolium overlay technique for population
SHAPIRO, A., 1946 The kinetics of growth and mutation in bacteria. Cold Spring Harbor of respiration deficiency in yeast. J. Bacteriol. 68 : 391-392.
studies of respiration deficiency in yeast. J. Bacteriol. 72 : 500-504.
studies of respiration deficiency in yeast. Science 125: 928-929.