ISSN: 2319-8753
I
nternational
J
ournal of
I
nnovative
R
esearch in
S
cience,
E
ngineering and
T
echnology
(An ISO 3297: 2007 Certified Organization)
Vol. 3, Issue 12, December 2014
Landscape Characterization and Modeling
Degradation by Fragmentation of Plant
Formations: Case of Ketu and Dogo Classified
Forest (East Center of Benin)
*Eric Alain TCHIBOZO
Lecturer of remote sensing and applied geomantic, Associate Professor, Department of Geography and Regional Planning, University of Abomey – Calavi, 01BP 526 Cotonou, Benin
ABSTRACT: This paper aims to characterize the landscape of classified forests of Kétou and Dogo and model degradation by fragmentation of its plant formations. A multi-criteria methodology for the extraction and use of geographic information has been used to treat Lands a timages and determine the effect size fragmentation mesh. The results show that the spatial structure of the two forest studyis disrupted by the landscape dynamics evaluated over the 2000to 2013 period. The set of natural vegetation under the crops and fallow land pressure has become more important in the Ketu forest with an increase of26.83% and less important in that of Dogo with a24.67%decline.The first forest is characterized by a diversification of the landscape, while the second that of Dogo shows a simplification. Plant formations are fragmented at various levels. Patches very small areas(0.0056 hectares -44.80hectares)are relatively more important for forests and savannas of Dogo than for Ketu. In this lastforest,52.96% of all vegetation is fragmented with patches of less than25 hectares, while in the Dogo, this criticism fragmentation represents a proportion of24.95%. This situation shows that forest structure and bio diversity are already targeted deep and lasting affected. Fragmentation maps are performed on each forest study. Two groups of vegetation degradation factors were identified: physical (the fractures and lineaments network, weathered rocks, bare soil and surface water) and anthropogenic factor (the mosaic of crop and fallow). A linear function of the degradation of vegetation from these factors has been proposed for each forest study, as well as two scenarios for their simulation.
KEYWORDS: Fragmentation, classified forests, vegetation, east - Center of Benin.
I. INTRODUCTION
ISSN: 2319-8753
I
nternational
J
ournal of
I
nnovative
R
esearch in
S
cience,
E
ngineering and
T
echnology
(An ISO 3297: 2007 Certified Organization)
Vol. 3, Issue 12, December 2014
conservation for efficient and sustainable management. This action is only possible by by the availability of several geographical information on the state of vegetation. This study aims to contribute. Its purpose is to characterize the landscape of classify forest of Ketu and Dogo and model the degradation by fragmentation of plant formations.To do this, several specific objectives were identified:- mapping the surface condition of the forest reserves of study and analyse the dynamics of the landscape;- analysethe landscape and measure the fragmentation of plants formations; - model the degradation by fragmentation of plant formations.
To achieve these objectives, the following assumptions are made:- Kétou and Dogo classified forests are unequally occupied by vegetation in an agricultural pressure; -the spatial structure of the two studies forest is disturbed and present various levels of fragmentation;- the vegetation of these forests is degraded.
II.METHODS
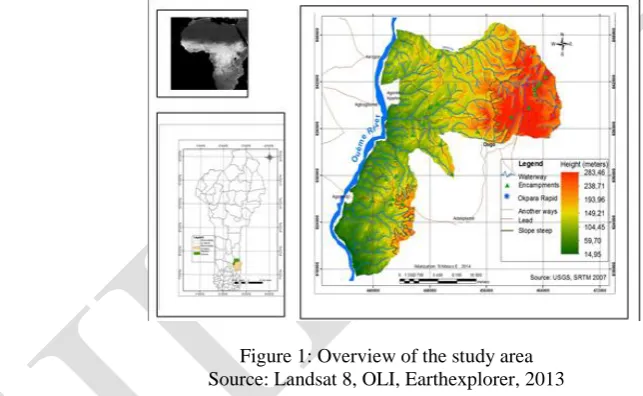
The study area consists of two classified forests fully localized in the north and northeast of townof Kétou (the east - Center of Benin). The first of said forest is between 7° 23'30 '' and 7° 33'02'' north latitude, 2° 23'30 '' and 2° 30'30'' east longitude. The second is between 7° 30'40'' and7° 41'00''north latitude, 2° 28'03'' and 2° 41'31'' east longitude. Contiguous, they cover a whole, a total area of 41.958 hectares, or 0.52% of the town(218 800 hectares) and are limited to the north by the Issanhounriver and Okpara rapid, to the west by the Ouémé River towards which all the water from the perimeter is drained to the south and east by the notched sides of the very set Ketu "bar soil" (figure 1).
Figure 1: Overview of the study area Source: Landsat 8, OLI, Earthexplorer, 2013
His reading shows that the said forest land scape is composed of a flood plain to the west and tea set backs' pen plain) west. Both types of terrain are separated by a steep slopere presenting the western border of Kétou forest and the boundary between the highest and the lowest part of the forest of Dogo. The rivers provid exoreic drain a geland scape in both forests studied. The natural environment of forests and Ketu Dogo promotes the intrusion of human activities. Despite their status as “classified forest” Kétou and Dogo forests are exposed to anthropogenic pressures increasingly growing. They are important for fuelwood supply basins for the population of the surrounding cities including Kétou, Bohicon, Abomey... Almost all coal produced is sent to the coastal cities of Cotonou and Porto Novo, while food crops such as yams and cassava are export to Nigeria [16].
ISSN: 2319-8753
I
nternational
J
ournal of
I
nnovative
R
esearch in
S
cience,
E
ngineering and
T
echnology
(An ISO 3297: 2007 Certified Organization)
Vol. 3, Issue 12, December 2014
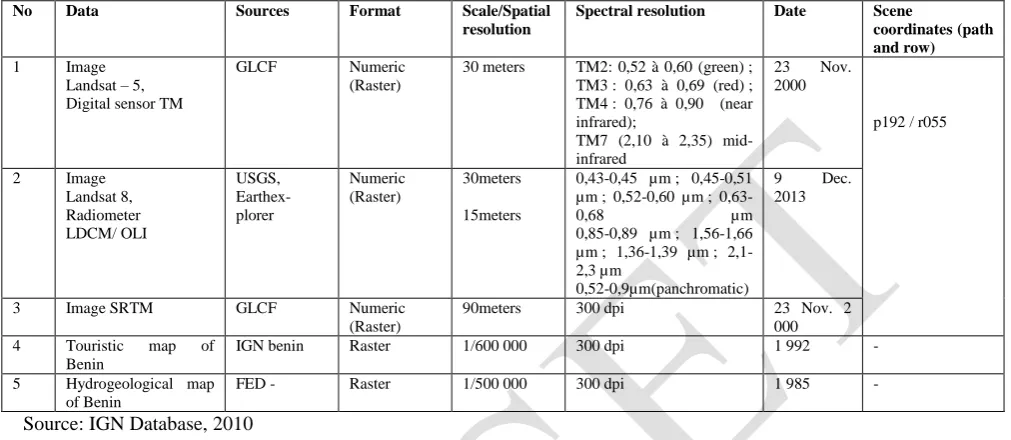
Table 1: Main characteristics of image data and thematic maps used
No Data Sources Format Scale/Spatial
resolution
Spectral resolution Date Scene
coordinates (path and row)
1 Image
Landsat – 5, Digital sensor TM
GLCF Numeric
(Raster)
30 meters TM2: 0,52 à 0,60 (green) ; TM3 : 0,63 à 0,69 (red) ; TM4 : 0,76 à 0,90 (near infrared);
TM7 (2,10 à 2,35) mid- infrared
23 Nov.
2000
p192 / r055
2 Image
Landsat 8, Radiometer LDCM/ OLI
USGS, Earthex-plorer
Numeric (Raster)
30meters
15meters
0,43-0,45 µm ; 0,45-0,51 µm ; 0,52-0,60 µm ;
0,63-0,68 µm
0,85-0,89 µm ; 1,56-1,66 µm ; 1,36-1,39 µm ; 2,1-2,3 µm
0,52-0,9µm(panchromatic)
9 Dec.
2013
3 Image SRTM GLCF Numeric
(Raster)
90meters 300 dpi 23 Nov. 2
000
4 Touristic map of
Benin
IGN benin Raster 1/600 000 300 dpi 1 992 -
5 Hydrogeological map
of Benin
FED - Raster 1/500 000 300 dpi 1 985 -
Source: IGN Database, 2010
Table 1points outa difference between the production datesof the data collected. This is particularlyfelt inthematic maps.Structuring elements(rivers, road, urban, etc.) of the hydrogeological mapwill be updatedin 1985compared to1992 andofthe results ofimage processing.
The method used for this study is a multidisciplinary approach to the extraction and use of geographic information. Landscape analysis is performed from the surface condition maps of 2000 and 2013 periods. These are carried out by supervised classification using the maximum likelihood algorithm. The results are evaluated by the confusion matrix (94.41% and 96.21%) and kappa (0.93 and 0.95), respectively for the studies years. The superposition of surface condition maps has enabled a diachronic dynamic analyze of the landscape [19]. The surface condition maps (vector format) are transformed to raster format and then reclassified into four new classes (forest, savannah, mosaic of crops and fallow and others) to be converted into GeoTIFF format (with software Arc map 10.1) having a pixel grid of 30 meters. This grid corresponds to the resolution of the mulspectrale image used (Table 1). The resulting image of these treatments is then imported into the Fragstats software to calculate fragmentation indices across the landscape and the class [21].
ISSN: 2319-8753
I
nternational
J
ournal of
I
nnovative
R
esearch in
S
cience,
E
ngineering and
T
echnology
(An ISO 3297: 2007 Certified Organization)
Vol. 3, Issue 12, December 2014
III. EXPERIMENTALRESULTS
The surface conditionmaps and analyze of landscape dynamics of classified forests of the Kétou (12,255 hectares) and the Dogo (29703 hectares)
A variety of plant formations composed the surface condition (soil occupation) of the study forests. The mapped vegetation units are a heterogeneous group of several plant formations identified in the field. Table 2 shows the correspondence between surface state units observed in the field and those represented on the surface condition maps. The units of surface conditionmaps are aligned with the field data (Table 2).
Table 2: Legend alignment of land cover maps with field collected data (Kétou Dogo-2013)
Source: National Forest Inventory 2007, modify
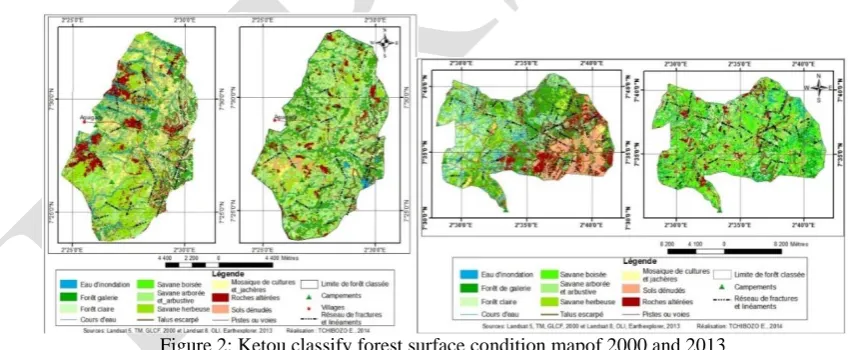
Figure 2 and figure 3 show the surface condition maps of study forest. Landscape dynamics are illustrated by comparing histograms of unit’s surface condition (figure 4 and figure 5).In Table2, themappedunits represent aplant community diversity on the ground. Their common landscape structure brought together the vegetation device class to mapAnalysis ofFigures 10 and11 show thatin the forest ofKetu, the components of the factorial axes are of importanceonthe abscissa axiswhile in theforestDogo, the relative importance is levied onthe ordinates-axis.
Figure 2: Ketou classify forest surface condition mapof 2000 and 2013 Figure 3: Dogo classified forest surface condition map of 2000 and 2013 N° Units identified on the map Units identified on the field
1 Gallery forest Pterocarpus santalinoides, Cola laurifolia Cynometra megalophylla et Diospyros mespiliformis
Open forest Anogeissus leiocarpus, Combretum collinum, Isoberlinia doka et Pterocarpus erinaceus
2 Wooded savannah Vitellaria paradoxa et Combretum collinum
Savannah and shrub Combretum collinum et Lophira lanceolata
Grassland ( post group - cultural ) of Brachiaria deflexa et Securinega virosa
Crops and fallow Cassava, yam, cotton…
3 Bare soil Ferrallitic soil low desaturated and ferruginous with a thick layer of bedding.
Altered rock Alteration clay altered rocks - sandy
4 River, tributaries Waterway
5 Lineaments and fractures network
ISSN: 2319-8753
I
nternational
J
ournal of
I
nnovative
R
esearch in
S
cience,
E
ngineering and
T
echnology
(An ISO 3297: 2007 Certified Organization)
Vol. 3, Issue 12, December 2014
Sources: Image Landsat 5 TM, GLCF, 2000 and Landsat 8, OLI, USGS, Earthexplorer, 2013, treated
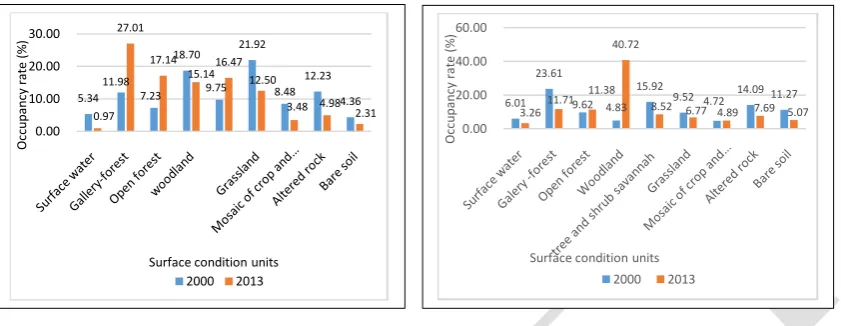
Figure 4: Histogram showing the occupancy rate of the surfaces of units in the classified forest Kétou Figure 5: Histogram showing the occupancy rate of the surfaces of units in the classified forest Dogo
Source: Statistical treatment of results image photo - interpretation
The diachronic analysis of the dynamic of landscape from figures 2, 3,4 and 5 can retain the following: In 2000, all of the natural vegetation represented 67.27% of the classified forest of Ketu against 63.51% in that of Dogo. The first forest is characterized by the co-dominance of grassland (21.92%) and woodland (18.70%). The second is categorized by the dominance of a vegetation of gallery - forest (23.61%) and open forest (9.62%) interrupted by grassland patches (9.52%). Throughout the classified forest of Kétou, open forest (7.23%) and tree and shrub savannah (9.75%) decrease gradually from the southwest to the northwest where many crop fields and fallow (8.48%) are fragmented by blocks of altered rocks (4.98%), witnesses localized intense desertification. The flooding of valleys noticed northwest of the classified forest, divides weathered rock surfaces and fragments of dense forest vegetation, woodland and tree and shrub savannah. In the forest of Dogo, these relatively wetter units are characterized by localized presence of water (6.01%). There are a tough representation of the gallery- forest (23.61%) and the savannah and shrub (15.92%) on the forest landscape little marked by weathering processes. The flooding occupies the center and southwest of the same Dogo classified forest with patches that have fragmented the islets of woodland within a vast expanse of dense forest vegetation and tree and shrub savannah. All of these units is under pressure from crops and fallow largest in Kétou (8.48%) than Dogo (4.72%). Bare soil represent 4.36% in the forest of Kétou against 11.27% in that of Dogo. In the latter classified forest, deforestation is more important and localized in the South - east the steep slope.
In 2013, all of the natural vegetation has become more important in the Ketu forest with 85.32% of occupancy rate, an increase of 26.83% and less in that of Dogo with 47.84%, a regression 24.67%. In the first study forest, vegetation is unevenly distributed in the landscape between the gallery forest (30.60%), woodland (19.42%), open forest (17.15%), savannah tree and shrub (18.66%) and grassland (14.16%). There is an increase of 125.46% of the gallery – forest, 137.07% of the woodland and 68.92% of the tree and shrub savanna with a decline of 42.94% of grassland and 19.04% of the woodland. Other occupancy units followed the same trend with a regression to 81.33% water, 59.28% for weathered rock and 47.25% for bare soil. By cons in the second forest, the Dogo, the natural vegetation is unequally shared between the gallery - forest (24.48%), open forest (23.78%), woodland (19.79%), the tree and shrub savannah (17.80%) and grassland (14.14%). There is a small increase in open forest (18.29%) and important of woodland (743.06%). In the same Dogo classified forest, gallery - forest has experienced a 50.40% decline, the tree and shrub savanna 46.48% and 28.89% grassland. In the forest of Ketu, the mosaic of cultures and fallow weathered rocks and bare soil are down sharply compared to the 2000 period with current occupancy rate of 3.48%, 4.98% and 2 31% respectively. South - west of that area classified, significant desertification area differs from grassland. In the forest of Dogo, the slight increase (3.6%) of the mosaic of crop and fallow reflects the relative stability of this unit in the occupation. The altered rocks are fragmented by erosion and are currently distributed within the two forests according
5.34 11.98 7.23 18.70 9.75 21.92 8.48 12.23 4.36 0.97 27.01 17.14 15.14 16.47 12.50
3.48 4.98 2.31
0.00 10.00 20.00 30.00 O cc u p an cy r at e (% )
Surface condition units
2000 2013
6.01 23.61
9.62 4.83
15.92
9.52 4.72 14.09 11.27
3.26
11.71 11.38
40.72
8.52 6.77 4.89 7.69 5.07
0.00 20.00 40.00 60.00 O cc u p an cy r at e (% )
Surface condition units
ISSN: 2319-8753
I
nternational
J
ournal of
I
nnovative
R
esearch in
S
cience,
E
ngineering and
T
echnology
(An ISO 3297: 2007 Certified Organization)
Vol. 3, Issue 12, December 2014
to the study orientation SW - NE. Bare soil also decreased by 55.01% over the same period of study (figure 4 and figure 5). The valleys are not flooded and this is currently noticed southeast forest of Ketu and northeast of the forest of Dogo, on both sides of the steep slope.
Landscape analysis and measurement of the fragmentation of plant formation of Kétou and Dogo classified forests
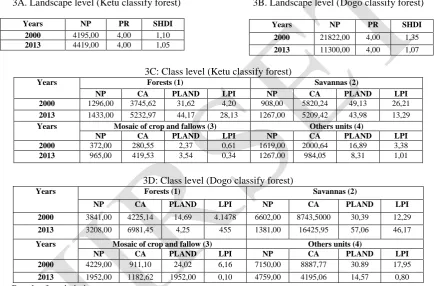
Tables 3A, 3B, 3C and 3D integrate metrics of landscape composition at the landscape level and at the level of occupancy classes. These are used to identify the simplification or diversification of the landscape (A. Casado, 2007).
Table 3: Indices of landscape composition in 2000 and 2013.
3A. Landscape level (Ketu classify forest) 3B. Landscape level (Dogo classify forest)
3C: Class level (Ketu classify forest)
Years Forests (1) Savannas (2)
NP CA PLAND LPI NP CA PLAND LPI
2000 1296,00 3745,62 31,62 4,20 908,00 5820,24 49,13 26,21
2013 1433,00 5232,97 44,17 28,13 1267,00 5209,42 43,98 13,29
Years Mosaic of crop and fallows (3) Others units (4)
NP CA PLAND LPI NP CA PLAND LPI
2000 372,00 280,55 2,37 0,61 1619,00 2000,64 16,89 3,38
2013 965,00 419,53 3,54 0,34 1267,00 984,05 8,31 1,01
3D: Class level (Dogo classify forest)
Years Forests (1) Savannas (2)
NP CA PLAND LPI NP CA PLAND LPI
2000 3841,00 4225,14 14,69 4.1478 6602,00 8743,5000 30,39 12,29
2013 3208,00 6981,45 4,25 455 1381,00 16425,95 57,06 46,17
Years Mosaic of crop and fallow (3) Others units (4)
NP CA PLAND LPI NP CA PLAND LPI
2000 4229,00 911,10 24,02 6,16 7150,00 8887,77 30.89 17,95
2013 1952,00 1182,62 1952,00 0,10 4759,00 4195,06 14,57 0,80
Source: Result of statistic images treatment
Legend: NP (Number of Patches); CA (ha) (Class area); PLAND (%) (Percentage of Landscape); LPI (%) (Largest Patch Index); PR
(Patch Richness); SHDI (Shannon Diversity Index).
At the global level (table 3A and table 3B), the results point to a tendency to heterogeneity of the Ketu classify the forest landscape and the homogenization of theDogo classify forest. Indeed, between 2000 and 2013, the number of patches (NP) increased by 5.34% for the first forest was reduced by 48.22% for the second. Although wealth (PR) is always represented by four classes of land cover type in those forests, Shannon Diversity Index (SHDI) decreases by presenting a simplification of the structure of the two forests across the progressive reduction of heterogeneity.
At the class level (table 3C and table 3D), the analysis reveals that the heterogeneity of the Ketu classified forest is related to the presence of spatial structure disturbed by the dominance of the gallery -forest and co-dominance of the woodland, the tree and shrub savanna and grassland. By cons, in Dogo forest, homogenization is due to the spaces of afforestation process at the expense of agricultural land. Indeed, between 2000 and 2013, the number of patches (NP) increases in the first forest for most classes of occupation. For the second, the forest of Dogo, this index is down for all constitutes landscape formations. Surfaces (CA; PLAND) decrease for the of forestsclass, but increased for the
Years NP PR SHDI
2000 21822,00 4,00 1,35
2013 11300,00 4,00 1,07
Years NP PR SHDI
2000 4195,00 4,00 1,10
ISSN: 2319-8753
I
nternational
J
ournal of
I
nnovative
R
esearch in
S
cience,
E
ngineering and
T
echnology
(An ISO 3297: 2007 Certified Organization)
Vol. 3, Issue 12, December 2014
savannas and the mosaic of crop and fallow. It was observed in the field that the areas of fields and fallows are greatly reduced. They currently have a compaction expressed the importance of LPI index, the patch having the largest area of the class that represents 44.26% for forest of Kétou and 98.38% of the forest of Dogo. The proportion of the landscape occupied by forests (PLAND) followed the same trend as crops and fallow of the forest of Ketou with a 30.51% discount. By cons in the classified forest of Dogo, this index increased by 39.69%. Moreover, in the savannah, the PLAND index shows a reduction of 10.48% for forest of Kétou and increased 87.67% for the forest of Dogo. Similarly, savannahs surfaces are compacted in the forest of Ketu and have grown into that of Dogo. Indeed, in the first forest, the largest patch (LPI)occupied26,21hectaresin 2000 against 13.29 hectares in 2013. By cons, in the second forest, there is an enlargement of the greatest stain that from 12.29 hectares in 2000 to 46.17 hectares in 2013.
Thus, in the classified forest Ketu, the landscape presents a diversification expressed by the increase in forest areas and reducing those of savannas. By cons in the Dogo, simplification results in the reduction of the area of forests and crops to the increase in savannas. With the diversification of the classified forest of Kétou and simplification of the classify forest of Dogo it is necessary to measure the fragmentation of the landscape.
Measurement of landscape fragmentation
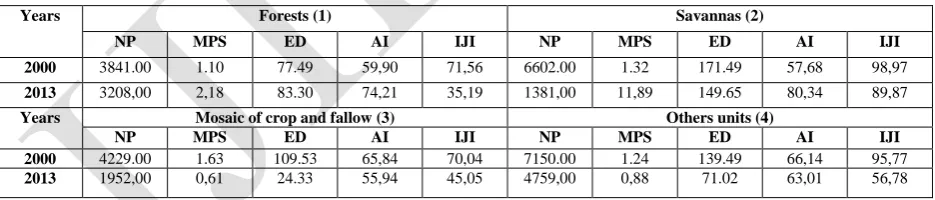
Landscape fragmentation is measured across the surface units (forests, savannas, and crops and fallow). Tables 5 and 6 present the metric of fragmentation. These measures help to identify the processes of fragmentation or closing the landscape (Casado,A., 2007).
Table 5: Indices of fragmentation / closing of the landscape of the classified forest Kétou (2000 and 2013)
Years Forests (1) Savannas (2)
NP MPS ED AI IJI NP MPS ED AI IJI
2000 1296,00 2,89 107,69 74.45 47,73 908,00 6,41 133,01 79.76 61,45
2013 1433,00 3,65 130,06 77,86 77,86 1267,00 4,11 156,73 73,40 73,40
Years Mosaic of crop and fallow (3) Others units (4)
NP MPS ED AI IJI NP MPS ED AI IJI
2000 372,00 0,75 12,10 62.72 21,13 1619,00 1,24 81,80 63,38 86,10
2013 965,00 0,43 24,13 49,29 49,29 754,00 1,30 32,67 69,86 69,86
Table 6: Indices of fragmentation / closing of the landscape of the classified forest Kétou (2000 and 2013)
Years Forests (1) Savannas (2)
NP MPS ED AI IJI NP MPS ED AI IJI
2000 3841.00 1.10 77.49 59,90 71,56 6602.00 1.32 171.49 57,68 98,97
2013 3208,00 2,18 83.30 74,21 35,19 1381,00 11,89 149.65 80,34 89,87
Years Mosaic of crop and fallow (3) Others units (4)
NP MPS ED AI IJI NP MPS ED AI IJI
2000 4229.00 1.63 109.53 65,84 70,04 7150.00 1.24 139.49 66,14 95,77
2013 1952,00 0,61 24.33 55,94 45,05 4759,00 0,88 71.02 63,01 56,78
Source: Result of image treatment
ISSN: 2319-8753
I
nternational
J
ournal of
I
nnovative
R
esearch in
S
cience,
E
ngineering and
T
echnology
(An ISO 3297: 2007 Certified Organization)
Vol. 3, Issue 12, December 2014
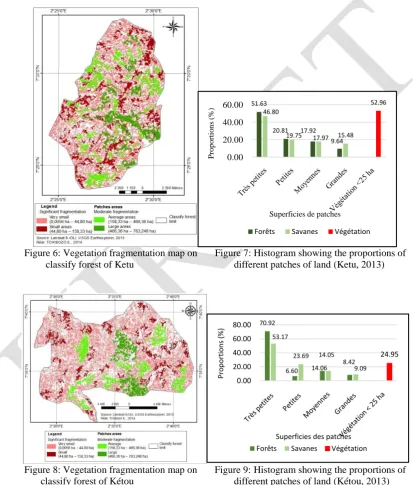
increases for forests to savannas and decreases for mosaic of crop and fallow land. By cons Dogo, it rose for the first two units and shows a regression to the third. The IJI index (distribution adjacency between classes) increases for forests, savannahs, and the mosaic of cultures and fallow land in the forest of Kétou and decreases for these classes in the forest of Dogo. This situation shows that the aggregation decreases for forests andsavannas and increases forcrops and fallow in the classified forest Kétou. By consin that Dogo increased aggregation was observed for all of these formations.Figures 6,7 illustrate the forest fragmentation map of classified forest of Kétou and Dogo. Figures 8and 9 show the histograms showing the proportions of the various patches based on their surfaces.
Figure 6: Vegetation fragmentation map on Figure 7: Histogram showing the proportions of classify forest of Ketu different patches of land (Ketu, 2013)
Figure 8: Vegetation fragmentation map on Figure 9: Histogram showing the proportions of classify forest of Kétou different patches of land (Kétou, 2013)
Source: Results of image treatment 51.63
20.81 17.92
9.64 46.80
19.75 17.97 15.48
52.96
0.00 20.00 40.00 60.00
P
ro
p
o
rt
io
n
s
(%)
Superficies de patches
Forêts Savanes Végétation
70.92
6.60 14.06
8.42 53.17
23.69 14.05
9.09
24.95
0.00 20.00 40.00 60.00 80.00
P
ro
po
rt
io
ns
(
%)
Superficies des patches
ISSN: 2319-8753
I
nternational
J
ournal of
I
nnovative
R
esearch in
S
cience,
E
ngineering and
T
echnology
(An ISO 3297: 2007 Certified Organization)
Vol. 3, Issue 12, December 2014
The analysis of these figures shows the relative importance of the patches very small areas. They represent 51.63% and 46.80% respectively for forests and savannas classes of Ketu and 70.92% and 53.17% for the same units in the forest of Dogo. The smallest patch of patches group with very small acreage occupies 0.0056 hectare or 56 m2. The mesh representation of this fragmented vegetation information consists of two square pixel resolution of 30 meters for the smallest patch. These observations confirm the high level of fragmentation of vegetation in both forests studied. In the forest of Kétou, 52.96% of all vegetation is fragmented with patches of less than 25 hectares, while in the Dogo, this criticism fragmentation represents a proportion of 24.95%. This could be explained by better aggregation (80.34%) of savannah patches in the forest of Dogo. We also note the importance of the fragmentation of agricultural land in the forest of Kétou (Table 6), indicated by the strong increase in the index NP (159%), supported by a strong reduction in average size (MPS -57.33%) and a remarkable increase in ED index, the density of contours (99.42%). Thus, the landscapes of classified forests Kétou and Dogo are fragmented at various levels. Patches very small areas are relatively more important for forests and savannas of Dogo than for Ketu. Fragmentation of agricultural land is observed more noticeable than Ketu in Dogo. In the forest of Ketu, 52.96% of all vegetation is fragmented with patches of less than 25 hectares, while in the Dogo, this criticism fragmentation represents a proportion of 24.95%.
Modeling the degradation of vegetation
The modeling is performed to simulate the degradation of plant formations. The results obtained are shown below:
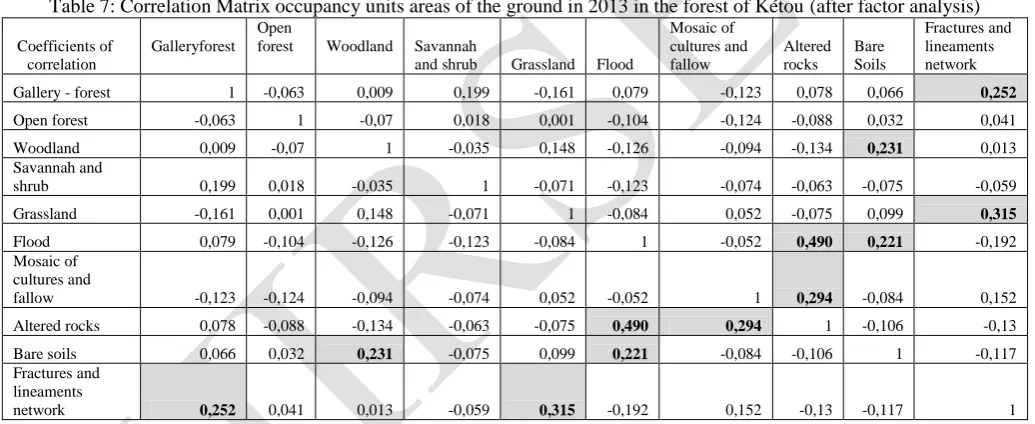
Table 7: Correlation Matrix occupancy units areas of the ground in 2013 in the forest of Kétou (after factor analysis)
Coefficients of correlation
Galleryforest Open
forest Woodland Savannah
and shrub Grassland Flood
Mosaic of cultures and fallow
Altered rocks
Bare Soils
Fractures and lineaments network
Gallery - forest 1 -0,063 0,009 0,199 -0,161 0,079 -0,123 0,078 0,066 0,252
Open forest -0,063 1 -0,07 0,018 0,001 -0,104 -0,124 -0,088 0,032 0,041
Woodland 0,009 -0,07 1 -0,035 0,148 -0,126 -0,094 -0,134 0,231 0,013
Savannah and
shrub 0,199 0,018 -0,035 1 -0,071 -0,123 -0,074 -0,063 -0,075 -0,059
Grassland -0,161 0,001 0,148 -0,071 1 -0,084 0,052 -0,075 0,099 0,315
Flood 0,079 -0,104 -0,126 -0,123 -0,084 1 -0,052 0,490 0,221 -0,192
Mosaic of cultures and
fallow -0,123 -0,124 -0,094 -0,074 0,052 -0,052 1 0,294 -0,084 0,152
Altered rocks 0,078 -0,088 -0,134 -0,063 -0,075 0,490 0,294 1 -0,106 -0,13
Bare soils 0,066 0,032 0,231 -0,075 0,099 0,221 -0,084 -0,106 1 -0,117
Fractures and lineaments
network 0,252 0,041 0,013 -0,059 0,315 -0,192 0,152 -0,13 -0,117 1
Table 8: Correlation matrix of units occupying areas of the ground in 2013 in the forest of Dogo (after factor analysis)
Coefficients of correlation
Gallery-forest
Open
forest Woodland Savannah and shrub
Grass-land
Flood
Mosaic of crop and fallow
Altered rocks
Bare soils
Fractures and lineaments network
Gallery-forest 1 -0,131 -0,134 -0,117 -0,006 -0,111 -0,004 -0,058 0,051 -0,105
Open forest -0,131 1 -0,059 -0,021 -0,18 -0,016 0,567 -0,022 -0,161 -0,059
Woodland -0,134 -0,059 1 0,092 -0,041 0,302 -0,155 -0,043 0,290 0,196
Savannah and
shrub -0,117 -0,021 0,092 1 0,075 0,146 0,253 -0,077 0,016 0,001
Grassland -0,006 -0,180 -0,041 0,075 1 -0,114 -0,107 0,121 -0,080 0,078
Flood -0,111 0,016 0,302 0,146 -0,114 1 0,197 -0,141 0,075 -0,032
Mosaic of crop
ISSN: 2319-8753
I
nternational
J
ournal of
I
nnovative
R
esearch in
S
cience,
E
ngineering and
T
echnology
(An ISO 3297: 2007 Certified Organization)
Vol. 3, Issue 12, December 2014
Altered rocks -0,058 -0,022 -0,043 -0,077 0,121 -0,141 -0,119 1 -0,200 0,069
Bare soils 0,051 -0,161 0,290 0,016 -0,080 0,075 -0,174 -0,200 1 -0,108
Fractures and lineaments
network -0,105 -0,059 0,196 0,001 0,078 -0,032 -0,052 0,069 -0,108 1
Source: Statistical image processing
The correlation matrices of areas of land use units in classified forests Kétou and Dogo in 2013 (table 7 and table 8) reveal that in the forest of Ketu, the network of fractures and lineaments expresses no significant correlation with the formations plant, whereas that of the Dogo, it induces a positive correlation with the gallery - forest (0.252) and grassland (0.315). The altered rocks are negatively correlated (-0.200) with Kétou bare soil and express this relationship positively and significantly with flooding (0.495) and less with the mosaic of cultures and fallow (0.294) in the forest of Dogo. In the same forest, bare soil reveal a positive correlation with woodland (0.231) and flooding (0.221), while in the forest of Ketu, this unit expresses a positive correlation with woodland (0.290) and negative with altered rocks (0.294). In Ketu, flooding exhibits a positive correlation with woodland (0.302) while in Dogo, this positive correlation relationship is more important with the altered rocks (0.490) and less important with bare soil (0.221). Finally, the mosaic of crop and fallow maintains a significant correlation with woodland (0.567) and less with tree and shrub savannah (0.253) in the forest of Ketu. In that of the Dogo, it induces a positive correlation with altered rocks (0.294). From all the above, it appears that two groups of factors influence the state of the landscape of classified forests Ketu and Dogo. The first includes factors such as physical, network and lineaments bills (tectonics), weathered rock alteration), bare soil (desertification) and surface water (flooding). The second group essentially collects the mosaic of crop and fallow land (agriculture).
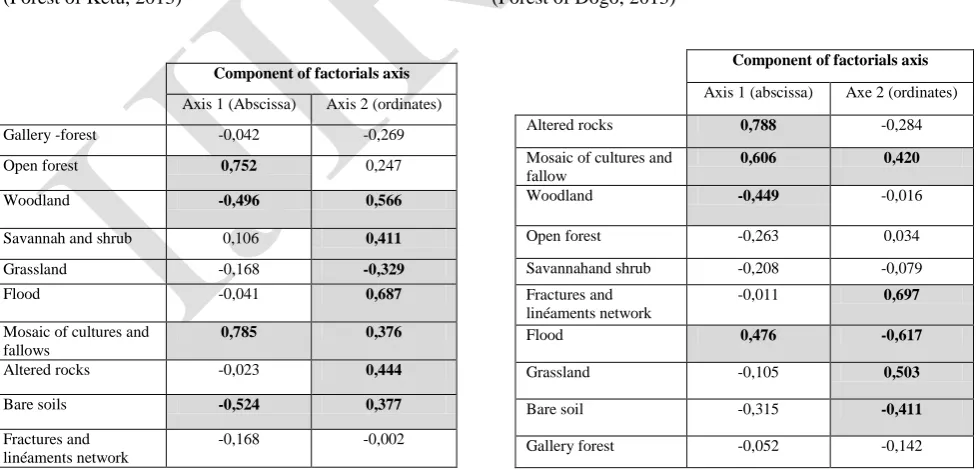
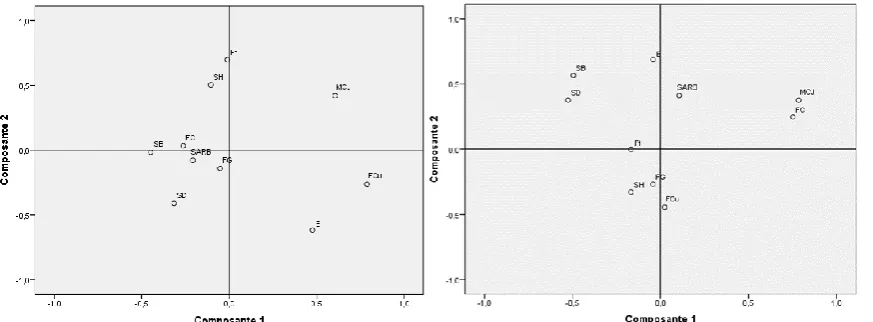
Given the number of factors identified in thedegradation of vegetation, a principal component analysis is needed to establish the relationship that conditions the landscape dynamics of the said forests. Tables 9 and 10 show the main components of the matrices. Figures 10 and 11 show the diagrams in space after rotation of the main components of the occupying units respectively for forest Kétou and Dogo.
Table 9: Matrix of rotated components of axis after Table 10: Matrix of rotated components of axis after factor analysis of unit areasoccupancy factor analysis of unit areasoccupancy
(Forest of Ketu, 2013) (Forest of Dogo, 2013)
Component of factorials axis
Axis 1 (Abscissa) Axis 2 (ordinates)
Gallery -forest -0,042 -0,269
Open forest 0,752 0,247
Woodland -0,496 0,566
Savannah and shrub 0,106 0,411
Grassland -0,168 -0,329
Flood -0,041 0,687
Mosaic of cultures and fallows
0,785 0,376
Altered rocks -0,023 0,444
Bare soils -0,524 0,377
Fractures and linéaments network
-0,168 -0,002
Component of factorials axis
Axis 1 (abscissa) Axe 2 (ordinates)
Altered rocks 0,788 -0,284
Mosaic of cultures and fallow
0,606 0,420
Woodland -0,449 -0,016
Open forest -0,263 0,034
Savannahand shrub -0,208 -0,079
Fractures and linéaments network
-0,011 0,697
Flood 0,476 -0,617
Grassland -0,105 0,503
Bare soil -0,315 -0,411
ISSN: 2319-8753
I
nternational
J
ournal of
I
nnovative
R
esearch in
S
cience,
E
ngineering and
T
echnology
(An ISO 3297: 2007 Certified Organization)
Vol. 3, Issue 12, December 2014
Source: Factor analysis of occupancy units’ areas after image processing
Legend :FG –Gallery -forest, FC –Open forest, SB - Woodland, SARB – Savannah and shrub, SH - Grassland, E-Flood, MCJ – Mosaic of cultures and fallow, SD –Bare soil, FCu –Altered rock, Ft - Fractures and lineaments network
Figure 10:Diagram in space after rotation of the main Figure 11: Diagram in space after rotation of the main Components of occupancy units (Forest of Ketu) components of occupancy units (Forest of Dogo)
Source: Factor analysis of occupancy units’ areas after image processing.
Analysis of Figures 10 and 11 show that in the forest of Ketu, the components of the factorial axes are of importance on the abscissa- axis while in the forest Dogo, the relative importance is levied on the ordinates-axis.The principal components factor analysis identified two factorial axis (axis 1 and axis 2) who believe 52.77% and 42.67% of the variance factor analysis, respectively, in the forest of Ketu and Dogo. Axis 1 represented by the component 1 in the component matrix after rotation axes (Table 9 and Table 10), estimated 18.17% of the variance in the forest of Kétou and 17.63% in the Dogo one. In the first forest it best represents the mosaic of crop and fallow (0.785), open forest (0.752), bare soil (-0.524) and woodland (-0.496). It is manifested through the linear function F (x) = 0.785 + 0.752 CJD FC - SD 0.524 - 0.496 -0.168 SB SH-0,168Ft + 0.106 SARB. In the second, this axis provides a better illustration of the altered rocks (0.788), the mosaic of crop and fallow (0.606), the woodland (-0.449) and flooding (0.476). Its realization is made by the linear function F (x) = 0.788 + 0.606 FCU CJD - E 0.476 -0.449 -0.315 SD SB - 0,263 FC - SARB 0.208 - 0.105 HS. The 2nd factorial axis, represented by component 2 (table 9 and table 10) holds 34.60% and 32.04% of the total variance, respectively expressed in the forests of Ketu and Dogo. In the first forest it best represents the flood (0.687), woodland (0,566) weathered rocks (0.444), the tree and shrub savannah (0.411), bare soil (0.377), the mosaic of cultures and fallow (0.376) and grassland (-0.329). It is developed by the linear function F (x) = E + 0.687 + 0.444 0.566 SB FCU + 0.411 + 0.377 SD SARB CJD + 0.376 - 0.329 SH - 0.269 + 0.247 FG FC. In the second, the 2ndfactorial axis represents best the fracture network and lineaments (0.697), the flood water (-0.617), grassland (0.503), bare soil (-0.411). It evolves according to the linear function F (x) = 0.697 Ft 0.503 -0.617 E SH - SD 0.411 - 0.284 FCU - 0.142 FG.
Thus, in classified forests of Ketu and Dogo determinants degradation of plant formations are varied and depend not only on vegetation types, but also considered the classified forest. We distinguish between physical factors such as water, bare soil, weathered rocks, the network of fractures and lineaments and a significant anthropogenic factor, mosaic of cultures and fallow land.
Diagram of the components in space after rotation (Figure 10 and Figure 11), two scenarios of degradation of vegetation can be deduced:
ISSN: 2319-8753
I
nternational
J
ournal of
I
nnovative
R
esearch in
S
cience,
E
ngineering and
T
echnology
(An ISO 3297: 2007 Certified Organization)
Vol. 3, Issue 12, December 2014
of bare soil. On the one factor axis factor analysis of the classified forest of Dogo, the first scenario, a progress 0.788 units of altered rock and 0.606 from those of the mosaic of crop fallow and reduced woodland of 0.449 units,open forest of 0.263, the tree and shrub savanna of 0.208, grassland of 0.105, flood risk of 0.476 units and bare soil (desertification natural risk) of 0.315 units.
• In the forest of Ketu, the second scenario, expressed by 2 factorial axis, portends an increase in 0.444 unitsand 0.376 altered rocks from those of the mosaic of cultures and fallow, causes an increase of 0.566 unit woodland, from 0.411 to those of tree and shrub savannah, 0.247 of open forests and reduces 0.329 units of grassland and 0.269 units of gallery- forest with an increase of 0,619 units of flood risks and those 0.377 unitsof desertification. On 2ndfactorial axis factor analysis of the classified forest Dogo, the second scenario informs that increased risk of tectonic of 0.697 unit and those of alteration of rocks of 0.142 unit, resulting in an increase of 0.503 units of grassland, a 0.142 discount from those of the gallery- forest with decreasing unit 0.617 risks of flooding and 0.411 of those of desertification.
IV.DISCUSSION
Results reveal that all of the natural vegetation has experienced an increase of 26.83 % in the classified forest of Ketu and 24.67% regression in the Dogo. According [16], the two study forests have the same value of average annual rainfall of 1.017 mm. The regression of vegetation in the forest of Dogo despite a relatively high humidity, could be explained by the flood and the weathering of rocks fragmented by erosion. In the classified forest Kétou, we note that co-dominance of grassland and woodland observed in 2000 is currently up (2013) to the dominance of the gallery forest and woodland. By cons in the classified forest Dogo, the dominance of the gallery -forest is being reformed by a dominance of woodland for the same period. This result confirms the hypothesis of Hoffman (1985) that the species dominance is the striking difference between disturbed areas and natural areas in the Sudan savanna zone. From the foregoing, it can be said the presence of disturbed habitats explains the unequal distribution of vegetation in our study forests. The mosaic of crops and fallow decreased significantly in the forest of Ketu and slight increase in that of Dogo reflects the relative stability of this unit in this forest. This shows the positive effects of reforms on forest protection strategies categorized Benin. But the degradation of vegetation continues. According [25] and [26], cash as Anogeissus leiocarpus, are now becoming fewer and larger seed increasingly rare in our forests. Typical forest species the Guinea Sudan region currently supplanted in fallows and secondary formations by herbaceous species widely distributed as
phytoHypparhenia rufa odorata, Imperata cylindrica. Recent evidence of environmental degradation. This work
confirms this hypothesis in classified forests Ketu and Dogo. The results reveal that the vegetation is fragmented at various levels not only by anthropogenic factors [11], but also by several physical factors (not human). This revelation confirms the work of several authors. According [26], the dominant trend since the classification of forests Ketu and Dogo until now has been the degradation of forest cover is 60% for the classified forest between 1949 and Kétou 1994 and 88% in the classified forest of Dogo. These rates are slightly higher than those reported for other classified areas further north in the count [28], 28% for the protected forest of Wari - Maro [29].
ISSN: 2319-8753
I
nternational
J
ournal of
I
nnovative
R
esearch in
S
cience,
E
ngineering and
T
echnology
(An ISO 3297: 2007 Certified Organization)
Vol. 3, Issue 12, December 2014
cultures and fallow Kétou whereas this risk is more visible on the gallery forest. These situations show the differential effect of external disturbances on the natural habitat of vegetation and therefore a varied level of fragmentation.
V. CONCLUSION
In classifying forests Ketu and Dogo -east - Center of Benin, less humid vegetation Kétou at Dogo is unevenly distributed and under pressure from agriculture. The spatial structure is disrupted by the dynamics of the landscape. In the first forest, we note that the co-dominance of grassland and woodland in 2000 is currently (2013) up to a dominance of the gallery forest and woodland. By cons in the forest of Dogo, the previous dominance of the gallery forest is being replaced by that of woodland during the same study period. The proportion of the landscape occupied by forests is reduced from 30.51% in the forest and in the Kétou Dogo, it has experienced an increase of 39.69%. The savannah experienced a 10.48% reduction Kétou and increased 87.67% for Dogo. The mosaic of crops and fallow edged up 3.6% reflecting its relative stability in the occupation of this forest of Dogo. In that of Ketu, the unit of the landscape has experienced a 58.96% decline. The landscape analysis reveals a trend towards diversification in the forest of Kétou and simplification in that of Dogo. Factors fragmentation of vegetation identified of the two forests of the study are not only physical, but also anthropogenic. Physical factors are the fractures and lineaments network, flood water, weathered rocks and bare soil. Anthropogenic factor is the mosaic of cultures and fallow land. The fragmentation level is varied for vegetation. In the study areas, the relative importance of patches very small areas (0.0056 ha - 44.80 ha) indicates a high level of fragmentation of vegetation. The fragmented patches of vegetation with less than 25 hectares represents 52.96% of the forest Kétou and 24.95% in the Dogo. Below this critical threshold of 25 hectares of forest structure and biodiversity is rapidly profound and lasting affected. This is clearly visible in the forests of Kétou and Dogo varied surfaces where patches are separated by corridors of bare soil, weathered rocks and water.
Thus, the vegetation study forests have varying levels of fragmentation. Mastering the spectral behaviour of the fragmented vegetation is useful information for better dynamic landscape management in classified forests of Benin. Phytosociological surveys and recent field studies should measure the dynamics and sense of fragmentation (from the results of this study) to limit its impact on the ecosystem. This opportunity offers the prospect for the analysis of economic, cultural and environmental potential of these protected forests to create metadata and spatial data infrastructure.
REFERENCES
[1] World Resources Institute, M.A., «Évaluation des Écosystèmes pour le Millénaire (EM):Facts on biodiversity”, a summary, 2008.http://www.millenniumassessment.org/fr/index.aspx (voir aussi: http://www.greenfacts.org/en/biodiversity/biodiversity-foldout.pdf).
[2]European Environment Agency, «Landscape fragmentation in Europe». Joint EEA-FOEN report N°2, 2011. ISSN1725-9177, Confédération Suisse, pp.17, 2011.
[3]Pereboom, V.,« Mode d'utilisation du milieu fragmenté par une espèce forestière aux habitudes discrètes, la martre des Pins Martes martes », Thèse de Doctorat, Spécialité : Biologie des organismes, Université d'Angers, France, 2006.
[4]Bamba, I.,Sadaiou, Y., Barima,S. et Bogaert, J.,« Influence de la densité de la population sur la structure spatiale d’un paysage forestier dans le bassin du Congo en R. D. Congo », Mongabay.com Open Access Journal - Tropical Conservation Science, vol. 3 (1), pp.31-44, 2010.
[5] Wade,T., Riitters,K.H. AL., « Distribution and causes of global forest fragmentation». Conserv. Ecol. 7, 2: 7111: pp.71 – 85, 2003. [6] Lemieux,E. « Rapport d'analyse de fragmentation du couvert forestier et analyse des forêts d’intérieur », UAF. pp. 9-17, 2009.
[7]Chéry,. Deshayes,J.-P., M.,«Indicateur territorial de développement durable », Territorial Observatory, CemagrefFrance, 2010.www.territoires.gouv.fr/observatoire - des - territoires
[8] Burel, F. et Baudry, J., « Ecologie du paysage : concepts, méthodes et applications », Tec & Doc, pp.359, 1999,Paris 2003.
[9] Collinge, S.K.,“Ecological consequences of habitat fragmentation: implications for landscape architecture and planning”, Urban and Landscape Planning, 36, pp.59-77, 1996.
[10] Lund, H.G., “What Is a Degraded Forest”, Forest Information Services. Gainesville, VA, USA, 2009.
[11] Sinsin, B. Kampmann, D., « Atlas de la biodiversité de l’Afrique de l’Ouest : Tome 1» Cotonou and Frankfurt/Main, Brice Sinsin and Dorothea Kampmann (eds.) BIOTA, 2010 ISBN 978-3-9813933-0-9, pp. 725, 2010.
[12] Etude FAO, Forêts N° 163,« Evaluation des ressources forestières mondiales », Rome, 2010.
[13] MamaA., Sinsin,B.,De Cannière,C.&Bogaert, J., « Anthropisation et dynamique des paysages en zone soudanienne au nord du Bénin », TROPICULTURA, N°31, vol.1, pp.78-88, 2013.
[14] CENATEL, » Inventaire Forestier National, 2007, Traitement et analyse des données Landsat 7 ETM+ », Maps Geosystem GmbH, DFS, Cenatel, 20 p., 2007.
ISSN: 2319-8753
I
nternational
J
ournal of
I
nnovative
R
esearch in
S
cience,
E
ngineering and
T
echnology
(An ISO 3297: 2007 Certified Organization)
Vol. 3, Issue 12, December 2014
[17] PROJET TCP/BEN/3101, « Appui à la mise en place d’une stratégie nationale de prévention et de gestion contrôlée des feux de forêts au Bénin »,Rapport national du Bénin pour la gestion et utilisation durables des écosystèmes forestiers, 2011, 48 p.
[18] CeSaReN-ONG, Inventaire de l’aménagement de la forêt classée de Dogo – Kétou, Rapport, MAEP, 58p, 2003.
[19]Defourny, P. Vancutsem, C. Pekel, J.F., «Carte de l’occupation du sol de la République Démocratique du Congo au 1 :3000 000 ». Notice explicative, Unité de recherche en Environnemétrie et Géomatique, Presses Universitaires de Louvain, UCL, Belgique, 37p.,2006.
[20] Padovani,L., Mering,C., « Apport des opérateurs de morphologie mathématique à l'extraction des failles à partir d'images SPOT panchromatiques, exemple de la faille de Hualca-Hualca », Pérou. Revue de Photo Interprétation, pp.3 – 4, 1997.
[21] McGarigal, K. & Cushman, S.A., “Comparative evaluation of experimental approaches to the study of habitat fragmentation effects”, Ecological Applications, No 12, pp.335-345, 2002.
[22] Saura, S., « Effects of minimum mapping unit on land cover data spatial configuration and composition», Int. Journal of Remote sensing, No 23: pp. 4853 – 4880, 2002.
[23] Casado, A., « Etude de la structure et de la dynamique des paysages de montagne. Exemple du bassin versant de La Voireuze, affluent de l’Alagnon entre 1948 et 2000 »,Mémoire de Master 2 en Géoenvironnement, Université Blaise Pascal, CNRS, 51p., 2007.
[24] Hoffmann, O., « Pratiques pastorales et dynamique du couvert végétal en pays Lobi ». Paris, ORSTOM, 1985, 355 p.
[25] Dossouhoui,V. F., « Dynamique du milieu naturel dans le bassin du Zou : Secteur Atchérigbé – Paouignan », Mémoire de maîtrise de géographie, FLASH/UNB, 1995, 96 p.
[26] Houndagba, C. J., Dagbenonbakin, G., Biaou, F., Mama, V., « Caractérisation semi-détaillée des bas-fonds dans la région de Dassa ». Rapport d’étude, CBF/UNC-Bénin, 1997, 62 p.
[27] Arouna, O., « L’exploitation des ressources biologiques et la dynamique de la forêt classée de l’Alibori Supérieur : Secteur de l’arrondissement de Bagou », Mémoire de maîtrise de géographie, Flash/UAC, 114 p.2002,
[28] Saliou, A. R. A., « Mode d’occupation des terres dans le village de Boiffo et relation avec la conservation de la zone cynégétique de la Djona », Mémoire de maîtrise de géographie, FLASH/UAC, 98 p., 2001.
[29] Adeyemi, C., « Pression rurale sur la forêt classée de Wari - Maro : cas du secteur allant de la latitude d’Alafiarou à celle de Bétérou »Mémoire de maîtrise de Géographie, FLASH/UAC,88 p., 2003.