© 2015, IJCSMC All Rights Reserved 104
Available Online at www.ijcsmc.com
International Journal of Computer Science and Mobile Computing
A Monthly Journal of Computer Science and Information TechnologyISSN 2320–088X
IJCSMC, Vol. 4, Issue. 2, February 2015, pg.104 – 117
RESEARCH ARTICLE
Maximum Amount Shortest Path Algorithm for
Efficient Data Collection in Wireless Sensor Network
A.Rajeswari
1, Dr.R.Manavalan
2Research Scholar in department of Computer Science, Periyar University, Tamilnadu1, Head of the Department of Computer Applications, Periyar University, Tamilnadu2
K.S.Rangasamy College of Arts and Science, Tiruchengode-637-215 Email:[email protected]
Abstract-- Data collection is a fundamental task in Wireless Sensor Network. In Wireless Sensor Networks, collecting large amount of data directly from a node may cause several problems. The freshness of data depends on the data collection process is as much faster as possible. Many of the data collection algorithms introduced so far did not concentrate on the requirements and complex scenarios of Wireless Sensor Network. In this paper, the basic idea about different data collection algorithms are described and one of the novel techniques called Maximum Amount Shortest Path (MASP) is proposed to overcome the issue in the Data Aggregation algorithm. The data collection process is effectively scheduled in MASP algorithm. It is also used to identify clearly where the incident takes place in the network. It aggregates the packets at the multiple sources to single destination node level and a single node broadcasts the data to all other nodes by acting as cluster head. The main goal of novel MASP algorithm is to reduce the energy consumption with less data conflict and minimize delay for improving the network performance. The performance of the proposed MASP algorithm for Wireless Sensor Network is analyzed in terms of parameters such as Throughput, Packet Delivery Ratio (PDR), End-to-End Delay and Energy Consumption.
Keywords: Data Collection, MASP, Clustering, Wireless Sensor Network, Aggregation
1. INTRODUCTION
© 2015, IJCSMC All Rights Reserved 105
improves the performance of the WSNs [1],[2],[3]. In sink mobility scenarios, the communication area is divided into two types such as Direct Communication Area (DCA) and Multi hop Communication Area (MCA).The sensors within the DCA are called as sub-sinks and can directly communicate with the mobile sink whereas nodes in MCA are called as members and they are depend on sub-sinks to communicate with the mobile sink. In path predicted scenarios Shortest Path Tree (SPT) method is used to route the data through chosen cluster heads. Mobi-route routing protocol [5], in which all sensor nodes need to be aware of the mobile sink, is used in SPTmethod. In the SPT method, the hop distance between the sub-sink and members are only considered but the communication time between the sub-sink and mobile sink is not considered.
If sub-sink with less communication time is large as number of members it results in loss of gathering data by the mobile sink from the sub-sinks. On the other hand if the sub-sink is large communication and if small number of members is routed to it than energy will be wasted. This SPT method results in low energy efficiency for data collection. Data collection is the one of the important tasks in WSNs. Transmitting data source to the destination node directly is the most challenging task. To overcome this, data collection scheme based Maximum Amount Shortest Path is proposed.
A. Overview of the Proposed Model
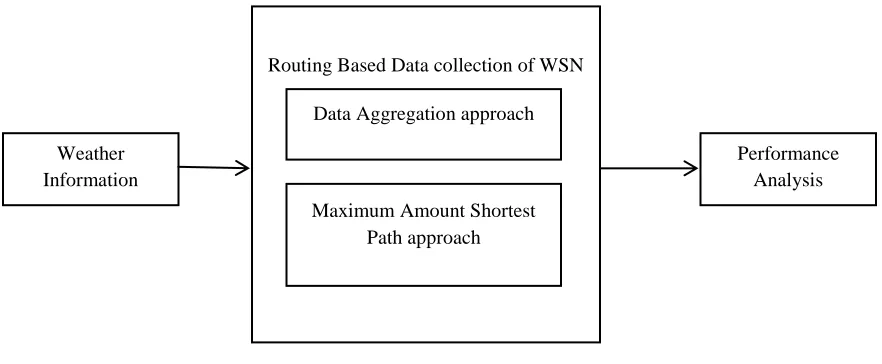
An overview of the proposed system is given in Fig 1. The data collection process for both existing Data Aggregation Approach (DAA) and proposed Maximum Amount Shortest Path (MASP) approaches are tested in the Wireless Sensor Network (WSN) for analyzing their performance using performance metrics such as Throughput, Packet Delivery Ratio (PDR), End to End Delay and Energy Consumption.
Fig 1. Block diagram of the proposed system
In the rest of the paper, section 2 presents a short review of related work regarding data collection in Wireless Sensor Network (WSN). Section 3 discusses in detail about AODV protocol. The Data Aggregation Algorithm is explained clearly in Section 4.Section 5 projects the performance analysis of Data Aggregation and MASP algorithms on AODV protocol. The work is concluded in Section 6 with future scope.
Routing Based Data collection of WSN
Data Aggregation approach
Performance Analysis Weather
Information
© 2015, IJCSMC All Rights Reserved 106
II. RELATED WORK
All nodes available in the Wireless Sensor Network are collected data from monitored and fixed area. The member nodes send the sensed data or forward the data to the destination sub sinks. It is the process of data collection in Wireless Sensor Networks.
One of the most popular cluster-based routing protocols in wireless sensor networks is Low Energy Adaptive Clustering Hierarchy (LEACH). LEACH begins with a setup phase in which the clusters are organized, followed by a steady state phase which transmit the data from the nodes to the cluster head and to the base station. LEACH randomly selects a few nodes as cluster heads and repeat this process to balance energy debauchery of the sensor nodes in the network [11][12].In 2012, Tang et al., proposed a Chain-Cluster based Mixed (CCM) routing algorithm for wireless sensor networks [19], which divides a wireless sensor network to a few chains and clusters. CCM algorithm runs in two stages. In the first stage, sensor nodes in each chain transmit data to their own chain head using the chain based routing. In the second phase, all the chain heads form the clusters send the data, which are fused and a voted cluster head. Finally, the cluster head fuses data and transmits them to the remote base station. In 2010, Lee et al., proposed a Cluster Based Energy Efficient Routing Protocol (CBERP) for wireless sensor networks [13][9]. CBERP divides sensor nodes to clusters and selects the cluster heads as LEACH-C. However, CBERP select the cluster head by utilizing a number of candidate nodes to reduce the overhead. After selecting the cluster heads, it forms a chain of the cluster heads and transmits data to the base station through the chain.In 2013, Zarei et al. proposed a Cluster Based Routing Protocol (CBRP) for prolonging the lifetime of wireless sensor networks [2]. The operation of CBRP is divided to rounds and each round consists of two phases: setup phase and steady state phase. In the setup phase, clusters are generated whereas, in the steady state phase, a spanning tree is constructed for sending aggregated data to the base station. Only the root node of the tree can directly communicate with the base station. To reduce the time delay and energy consumption, Chao Wang et al proposed Data Aggregation Algorithm which achieves the result in some extent and it is clearly explained in section 4.
III. Ad hoc on demand Distance Vector (AODV)
© 2015, IJCSMC All Rights Reserved 107
DESTINATION
SOURCE
S: SOURCE
D: DESTINATION
Fig.2. Request and Reply from source to destination
In Fig 2, the Request and Reply from source to destination in AODV is shown. The communication process in AODV from source to destination is called unicast. In this communication, the route has two mechanism such as Route request (RREQ) and Route reply (RREP). To propagate a RREP message back to the source from the destination, AODV depends on routing table entries with full trust. AODV maintains Timer based states for each node to work in an effective manner. It is an important feature of AODV. If a routing table entry is not used frequently, it will expire. Each routing table of AODV maintains set of predecessor nodes and a set of neighboring nodes are indicated by them. If the next hop link breaks, the neighborhood nodes are notified with Route Error (RERR) Packets. Each predecessor node of WASN forwards the Route Error Packets to its own set of predecessors which will effectively the all the routes of the network using the broken links.
Once a source node stops the sending data packets, the link will time out and eventually be deleted from the intermediate node routing tables. If a link break occurs while the route is active, the node propagates the route error message to the source. After receiving the RERR, the source node can reinitiate the route discovery process. AODV define three types of control messages for route maintenance: RREQ, RREP and RERR.
RREQ: a route request message is transmitted by a route required node. RREP: a route reply message is unicast back to the originators of a RREQ. RERR: route error message is used to notify other nodes for the loss of the link.
IV. DATA AGGREGATION ALGORITHM
DAA divides a sensor network into cluster and each cluster will have its own cluster head and it determines data association, and then performs approximation on sink node by an updating parameter of the data model. The node which has more power will be chosen as a cluster head. The cluster head is selected by cluster members. The data aggregation algorithms are implemented to approximate the readings of sensor nodes. Each sensor node transmits its parameter to its cluster head, instead of intense sensor readings. If the difference between the
© 2015, IJCSMC All Rights Reserved 108
approximated values is not greater than the original value then the sensor node does not update its data to cluster head. This method is suitable if less frequent update operations are involved.
INPUT: No. of Sent packets from source to destination through cluster heads.
OUTPUT: No. of Delivered packets received at destination.
Step 1: A Wireless Sensor Network is created with several sensing nodes Data Collection node (DC node) Which is moving dynamically
Step 2:Sensing nodes in the simulation area is clustered into number of clusters based distance and energy Level
Step 3:Cluster head broadcast the data to sink which may be in same cluster or other cluster
Step 4: The DC-node dynamically moves to collect the data from all clusters via cluster head when it comes within the transmission range
Step 6: Data Collection process is repeated until data collection is over.
Fig 3. Data Aggregation algorithm for data collection process in WSN
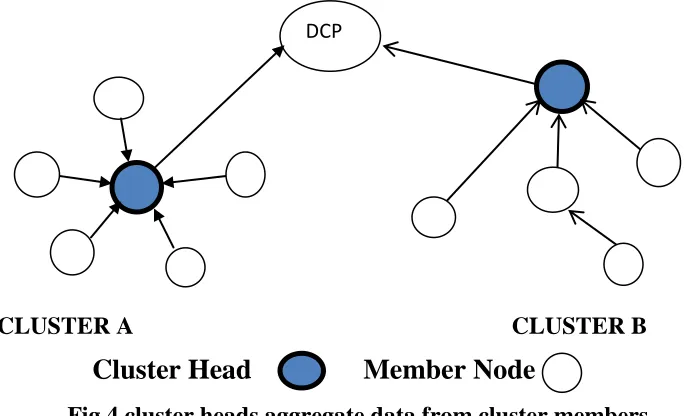
CLUSTER A CLUSTER B
Cluster Head Member Node
Fig.4 cluster heads aggregate data from cluster members
Multiple sources single destination method is shown in Fig.4, the cluster head collects the data and aggregates it when only data required is sent to base station. Multiple frequency channels are assigned between the cluster heads and the base station [7].The links are scheduled based on the load that carries between the cluster head and the base station. The main issues in these data aggregation algorithms are Packet losses due to the limited bandwidth of sensor nodes, Communication traffic, and network congestions, high communication cost, and extra aggregation delay. Multiple Route Reply packets in response to a single Route Request packet can lead to control heavy overhead. To overcome the problem of more energy consumption and aggregation delay, MASP algorithm is proposed in section 4.1and explained clearly.
© 2015, IJCSMC All Rights Reserved 109
V. MAXIMUM AMOUNT SHORTEST PATH ALGORITHM
In WSN, sending large amount of data directly to the sink node may cause several problems. The efficient data collection scheme called Maximum Amount Shortest Path (MASP) algorithm, multiple source single destination method is introduced for wireless sensor networks with path-constrained mobile sinks. In MASP, the mapping between sensor nodes and sub sinks is optimized to maximize the amount of data collected by mobile sinks and also balance the energy consumption. The total amount of data, Q total, collected by the mobiles ink in one round consists of the data collected from all sub-sinks as follows:
1
ns
i
Qtotal
Qi
(1)where, Qi is the amount of data from sub-sink per round. In order to maximize the total amount of data in low density network, it must be guaranteed that no sub-sink owns more members than its MReqs value in Condition i.e. MReqs is the maximum and minimum requirement of members.
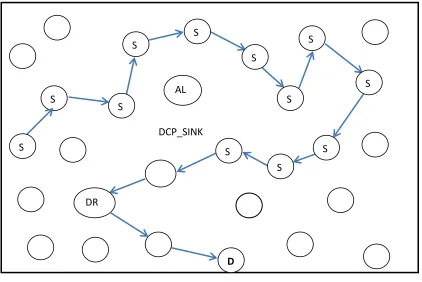
S-Source, DCP- Data Collection Process, DR-Data Requester, D-Destination
Node Routing
Fig 5. Collecting data from multiple source to destination through DCP_SINK and DR
In Fig 5, Packets are collected from multiple sources to destination through DCP (Data Collection Process) and DR (Data Requester). AL is the Anchor Location, where the incident takes place at next source. The mobile
DCP_SINK
DR
D
S
S
S
S
S
S
S
S
AL
S
S
S
S
S
S
S
S
S
S
S
S
S
S
© 2015, IJCSMC All Rights Reserved 110
device (destination) monitors the incident and creates a log file Data Collection Process(DCP_Sink) which has all information about the incident such as date, time, and location. Also it keeps the data locally and leaves DCP at Anchor Location. The mobile node carries the data through DCP_Sink called carrier node [9]. Suppose the DCP_Sink moves out of Anchor Location at time that mobile node will handoff, and then AL finds the next nearest mobile node. The DR Data Requester routes collected information through AL. The mobile node carries DCP_Sink replies for query and provides an encrypted ID of destination. Using encrypted ID the DR contacts the mobile device and gets the full data about the incident. The DR gets the destination address through the agent node to reach the
destination.
INPUT: Send the packets from source to destination.
OUTPUT: Get the collected packets from multiple sources and finally reach the destination through DCP (Data Collection Process) and DR (Data Requester) without time delay.
Step 1: The mobile device creates a log file that is called DCP_Sink, which has all information about the incident. Step 2: The DCP_Sink collect the packets from mobile node.
Step 3: AL is the anchor location, it is mainly used where the incident takes place, and also destination monitors the incident.
Step 4: The DCP transmit the packets to next nearby mobile node for finding at AL. In this place the DCP is called source and the next nearby mobile node is called DCP.
Step 5: This incident will be processing until packets reach the destination from multiple source to destination through DCP and DR.
Step 6: if mobile node which carries DCP moves out of anchor location then mobile node hand off the DCP to nearest mobile node in AL.
Step 7: The DR routes the collected data to reach the destination through agent node. Step 8: Data collection process is repeated until data collection over.
Fig 6. MASP algorithm for data collection process in WSN
VI. PERFORMANCE ANALYSIS
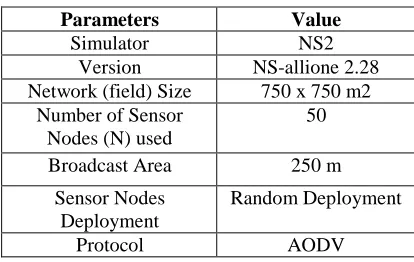
© 2015, IJCSMC All Rights Reserved 111 Table 1.NS-2 Simulation Configuration Settings
The simulation is conducted particularly to collect the data without delay in wireless sensor network model. The performance of the proposed method is analyzed using the evaluation metrics such as Throughput, Packet Delivery Ratio (PDR) and End-to End Delay, Energy Consumption. The shortest descriptions of these parameters are discussed below.
Throughput
The throughput is usually measured in bits per second or data packets per time slot. Throughput is the amount of work that can be performed or the amount of output that be produced by a system or component in a given period of time. The network performance is improved by total number of data packets received by the sink in a period of time. The throughput is calculated by,
1 Re i*
n
i ceived Length
Time
P
P
Throughput
SIMU
Length
P
is the length of a packet,SIMU
Timeis the simulation time.P
Receivedis the received packet andthroughput being more desirable.
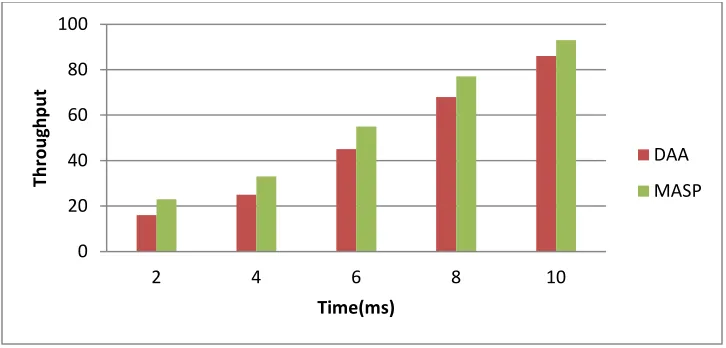
Table 2: Throughput comparison for DAA and MASP
Time (ms) Throughput
DAA MASP
2 13 22
4 23 33
6 45 54
8 67 74
10 77 83
Parameters Value
Simulator NS2 Version NS-allione 2.28 Network (field) Size 750 x 750 m2
Number of Sensor Nodes (N) used
50
Broadcast Area 250 m Sensor Nodes
Deployment
Random Deployment
© 2015, IJCSMC All Rights Reserved 112 Fig 7: Throughput comparison between DAA and MASP algorithm
From the simulation results, it is noted that the high throughput is achieved by MASP algorithm. The throughput achieved by the methods DAA and MASP algorithm for various time slots are provided in the table 2. The MASP algorithm achieves high throughput than the DAA for all time intervals. The results in the table 2 show the throughput earned by the MASP algorithm and the DAA and the same is flashed in the fig 7.The DAA achieves the throughput of 77% in the time duration of 10thmilliseconds whereas the MASP achieves 82% throughput in the same time interval of 10 milliseconds. It is noted that MASP yields more than 5% of throughput result than the DAA.
Energy consumption
The energy consumption for data collection and aggregation of cluster head nodes is considered. In the radio energy dissipation model in wireless sensor networks, to exchange an L-bit message between the two sensor nodes, the energy consumption can be calculated by.
ETx(L, d) = Eelec×L+εamp×L,
ERx(L) = Eelec× L,
where „d‟ is the distance between the two sensor nodes, „ETx(L,d)‟ is the transmitter energy consumption,„ERx(L)‟ is the receiver energy consumption.„Eelec‟ is the electronics energy consumption per bit in the transmitter and receiver sensor nodes.„εamp‟ is the amplifier energy consumption in transmitter sensor nodes.
0 20 40 60 80 100
2 4 6 8 10
Th
ro
u
gh
p
u
t
Time(ms)
DAA
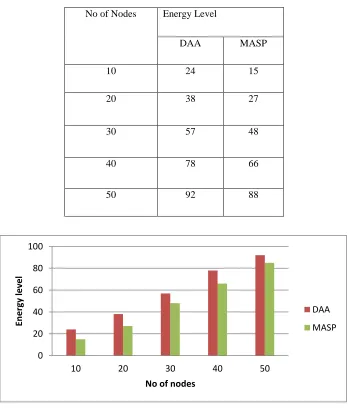
© 2015, IJCSMC All Rights Reserved 113 Table 3: Energy level for DAA and MASP
No of Nodes Energy Level
DAA MASP
10 24 15
20 38 27
30 57 48
40 78 66
50 92 88
Fig 8: Energy level comparison between DAA and MASP
From the simulation results, it is noted that low energy is consumed by MASP. The energy consumed is achieved by WSN using the methods DAA and MASP for number of nodes provided in the table 3 and the same is flashed in the fig 8. The DAA is achieved by 92% less energy of 10 to 50 nodes while the MASP mechanism achieved 88% less energy from 10 up to 50 nodes. It is noted that the MASP provides more than 4% better result than the DAA.
End to End Delay
The End to End Delay is computed from the packet delay during data transmission from node to node due to unexpected traffic congestion. It is calculated as
where, s Receive Time and is Sent Time.
0 20 40 60 80 100
10 20 30 40 50
En
e
rg
y
le
ve
l
No of nodes
DAA
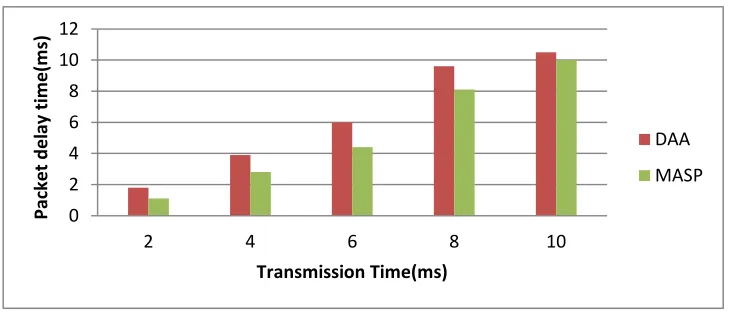
© 2015, IJCSMC All Rights Reserved 114 Table 4. Packet delay time (milliseconds) using Data aggregation and MASP methods
Transmission Time (ms)
Delay Time (ms) Measurement
Data aggregation MASP
2 1.8 1.1
4 3.9 2.8
6 6 4.4
8 9.6 8.1
10 10.5 10
Fig: 9 Comparison of packet delay time (ms) using DAA and MASP methods
The graph shows the end to end delay for data transfer from source to destination. End to end delay refer to
the time taken for the packet to transmit across a network from source to destination. The DAA method takes more delay time than MASP method. The delay time of these methods for number of packets transmitted over network is listed in Table 4. The numerical value in the Table shows that the delay time of MASP is considerably lower than DAA up to 10 milliseconds. The delay time for 2 to 10 milliseconds using DAA method is about 10.5%time delay while MASP method achieves decrease in the delay time by 10%. Finally minimum end to end delay is achieved by using MASP approach for data communication.
0 2 4 6 8 10 12
2 4 6 8 10
Pack
e
t
d
e
lay
tim
e
(m
s)
Transmission Time(ms)
DAA
© 2015, IJCSMC All Rights Reserved 115
Packet Delivery Ratio
PDR is the ratio of packets that are received by the sink to the total packets generated by sensors. And it is defined as, Re 1
*100
i ceived n i GeneratedP
PDR
P
where
P
Receivedthe total number of data packets is received by the sink,i
Generated
P
the total number of datapackets generated by sensors and n the number of sensors.
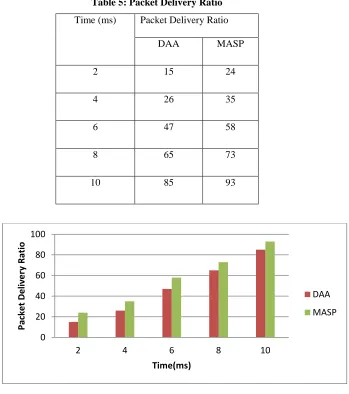
Table 5: Packet Delivery Ratio
Time (ms) Packet Delivery Ratio
DAA MASP
2 15 24
4 26 35
6 47 58
8 65 73
10 85 93
Fig 10: PDR comparison between DAA and MASP algorithm
Packet delivery ratio is the ratio between sum of total number of packets received by destination and sum of total number of packets sent by source. The simulation results clearly show that Packet Delivery Ratio value will be low in transmission time by 10 milliseconds. Packet Delivery Ratio (PDR) values are increased while the transmission time increases from 2 milliseconds to 10 milliseconds for both DAA and MASP. The results in the
0 20 40 60 80 100
2 4 6 8 10
© 2015, IJCSMC All Rights Reserved 116
table 5 show the Packet Delivery Ratio for both DAA and MASP and the same is projected in the fig 6. The approach which yields high Packet Delivery Ratio is considered as better to deliver the packets. While comparing DAA and MASP, the MASP yields highest Packet Delivery Ratio. The simulation study reveals that the proposed MASP method is superior to the existing method in terms of Throughput, delay time and Packet delivery radio.
VII. CONCLUSION
In this paper, an efficient data collection scheme called MASP for wireless sensor networks with path-constrained mobile sinks is proposed. In MASP, the mapping between sensor nodes and sub sinks is optimized to maximize the amount of data collected by mobile sinks and the energy consumption is balanced. MASP has good scalability to support sensor networks with low density and multiple mobile sinks. The DCP-based Wireless networks have significantly different channel and network capacities. The simulation results showed that the MASP algorithm improved the performance metrics of Packet Delivery Ratio (PDR), End-to-End Delay (E2D), Throughput and Energy Consumption is evaluated using AODV protocol in this four density regions of low density, medium density and high density in network scene as well as in node point when compared to DAA. The future work will implement the spatial network performance and reduce delay to avoid traffic model on the network.
REFERENCES
[1]. Wendi Rabiner Heinzelman, Anantha Chandrakasan, and Hari Balakrishnan “Energy-Efficient Communication Protocol for Wireless Micro-sensor Networks,” Proc. IEEE Transactions on, Proceedings of the 33rd Hawaii International Conference on System Sciences – 2000.
[2]. Arati Manjeshwar and Dharma P. Agrawal, “An Energy Efficient Chain-based Routing Protocol for Wireless Sensor Networks,” Proc. IEEE Transactions On, Mobile Computing, 2001,
[3]. Konstantinos Kalpakis, Koustuv Dasgupta, and Parag Namjoshi “Maximum Lifetime Data Gathering and Aggregation in Wireless Sensor Networks,” Proc. IEEE Transactions on, Computer Science, Vol. 02, Iss 12 august 26-2002.
[4]. Rahul C. Shah, Sumit Roy, Sushant Jain and Waylon Brunette, “Data MULEs: Modeling a Three-tier Architecture for Sparse Sensor Networks,” Proceedings of the First IEEE International Workshop on Sensor Network Protocols and Applications, Anchorage, AK, May, 2003, pp.30-41.
[5]. Liang Qin Thomas Kunz, “Increasing Packet Delivery Ratio in DSR by Link Prediction,” IEEE Transactions on, Proceedings of the 36th Hawaii International Conference on System Sciences – 2003.
[6]. Seema Bandyopadhyay and Edward J. Coyle, “An Energy Efficient Hierarchical Clustering Algorithm for Wireless Sensor Networks,” Proc. IEEE Transactions on, Wireless Sensor Network, INFOCOM 2003. [7]. Gang Lu, Bhaskar Krishnamachari, Cauligi S. Raghavendra, “An Adaptive Energy-Efficient and
© 2015, IJCSMC All Rights Reserved 117
[8]. Avinash Sridharan and Bhaskar Krishnamachari, “HEED: A Hybrid, Energy-Efficient, Distributed Clustering Approach for Ad Hoc Sensor Networks,” Proc. IEEE Transactions On, Mobile Computing, Vol.
3, No. 4, October-December 2004.
[9]. Ignacio Solis and Katia Obraczka, “The Impact of Timing in Data Aggregation for Sensor Networks,” Proc. IEEE Transactions on, Sensor Networks, 2004.
[10].Mao Ye, Chengfa Li, GuihaiChenlandJieWu, “EECS: An Energy Efficient Clustering Scheme in Wireless Sensor Networks,” Proc. IEEE Transactions on, Wireless Sensor Network, 2005.
[11].Selvadurai and Sukunesan, “An Energy-Efficient Clustering Algorithm for Multi-hop Data Gathering in Wireless Sensor Networks,” Proc. IEEE Transactions on, Journal of Computers, Vol. 1, No. 1, April 2006. [12].Dajin Wang, “A Graph-Center-Based Scheme for Energy-Efficient Data Collection in Wireless Sensor
Networks,” Proc. IEEE Transactions on, Mobile Computing, 2006.
[13].WenyuQu, Keqiu Li, Masaru Kitsuregawa, “An Efficient Method for Improving Data CollectionPrecision in Lifetime-adaptive Wireless Sensor Networks,” IEEE Communications Society subject matter experts for publication in the ICC 2007 proceedings.
[14].Guihai Chen, Chengfa Li, Mao Ye and Jie Wu, “An Unequal Cluster-based Routing Protocol in Wireless Sensor Networks,”Proc. IEEE Transactions on, Wireless Networks, Vol.15, No.2, 2007, pp.193-207. [15].Huang Lee, Abtin Keshavarzian, “Towards Energy-optimal and Reliable Data Collection via Collision-free
Scheduling in Wireless Sensor Networks” IEEE Communications Society subject matter experts for
publication in the IEEE INFOCOM 2008 proceedings.
![[(1R) 3 Benzoyl 1,7,7 trimethylbicyclo[2 2 1]heptan 2 onato κ2O,O′]chlorido(η6 p cymene)ruthenium(II)](data:image/gif;base64,R0lGODlhAQABAIAAAP///wAAACH5BAEAAAAALAAAAAABAAEAAAICRAEAOw==)