ISSN 2286-4822 www.euacademic.org
Impact Factor: 3.1 (UIF)
DRJI Value: 5.9 (B+)
The Impact of exchange rate policies to treat the
balance of payment misalignment
Prof. Dr. KALED MOHAMED HANFY
Prof. Dr. GEHAN SALEH
EMAD SAEED KHALIL ABD ALLAH
Arab Academy for Science Technology and Maritime Transport Cairo, Egypt
Abstract:
This Paper aims to set out shed light on very important issues
related to theimpact of the Egyptian pound exchange rate policies to
treat the misalignment in the balance of payment , in addition measuring econometric model on this issues by estimating Egypt's equilibrium real exchange rate ( RER's ) with the problems associated with this polices during the period (1981 – 2011) empirically, and analyze the effect of these policies " expansion in overall economies variables expressed by inflation, expansionary monetary policy, expansionary fiscal policy and exchange rate policy". Of course, once this concept is defined we can begin to discuss in a meaningful way what we mean by real exchange rate misalignment, or deviations of the actual RER from its equilibrium value. Additionally, The model investigate the essential effect of economic variables on real exchange rate in the short and long run, and analysis variables by Co-integration Regression and the standard Error Correction Mechanism (ECM) by testing Dickey Fuller (ADF), providing the mechanism for the proper characterization of exchange rate behavior, Because it takes into consideration all the relationship short-term and long-term relationship.
Egyptian pound. Policy makers can use Nominal depreciation to accelerate the process of the real exchange rate toward its equilibrium value. While the real exchange rate was substantially moving overvalued and undervalued within 1981-2011 it is only moderately equilibrium in 1995 , Error Correction Mechanism (ECM) indicates the value as shown in the model (-0.575837).
Key words: Real Exchange Rate, Balance of Payment, Egyptian pound equilibrium Exchange Rate, Economies variables
This Paper was divided into three parts. First part, study History of
Exchange Rate Regime in Egyptduring the period from 1981 – 2011.
Second part, it discusses the analytical Egyptian Balance of payment and trade balance. Also highlight on Literature Review and third part, study model estimating the impact of real exchange rate policies to treat the balance of payment misalignment in Egypt during the period 1981-2011 associated to analytical concept of real exchange rate (RER) behavior from its equilibrium Additionally, study consequences of increased misalignment, or deviations of the actual RER from its equilibrium value of RER's.
Part -1- Introduction:
History of Exchange Rate Regime in Egypt:
Egypt’s exchange rate has been historically characterized by a large degree of rigidity, The exchange rate policy starting from multiple exchange rate policy and Pegging During Eighties, and through the managed float During nineties and finally free float , in January 2003
did the Central Bank of Egypt (CBE) announce a float of the Egyptian
Pound (LE). Although this move meant that the exchange rate should cease to be the explicit nominal anchor for monetary policy.
To simplify the exchange system and ensure a competitive exchange rate, the multiple exchange described above was abolished on February 27, 1991 and replaced by a temporary dual exchange system
of a primary market and a secondary (free) market. Initially the
primary and secondary markets were meant to coexist for one year and then unified. It was subsequently decided to bring the unification of these markets forward in time. The unification occurred on October 8, 1991 and since Egyptian pound has been freely traded in a single exchange market.
After switching to flexible exchange rate regime, the announcement of the float in January 2003 was followed by depreciation until October 2004 to LE/US$ 6.23 (by 15.6 percent). Which made Egyptian products less expensive and might have benefited exports , in addition to demotic factors that increased capital outflow , reduced tourism revenues , decreased dollar reserves moreover the Asian financial crisis, world stock market speculative bubbles, the 2000 second Palestinian intifada , the 1998-1999 world oil price fall , the Luxor terrorist attack 1997 , the 9/11 terrorist attack U.S.A world trade center 2001 , the Afghanistan war , and the Iraqi war during July 2004-march 2005 , the new cabinet pursued economic reforms to set up a foreign exchange inter-bank market and to increase trade liberalization by cutting tariffs and eliminating surcharges and fees for imports , and setting qualified industrial zones .
between October and March 2009) and stood at US$ 31.3 billion in June-08 (down by almost US$ 3 billion)1
After 25 January revolutions 2011 Egypt experienced a sharp fall in Egypt’s external demand on goods and services as well as a sudden stop in capital flows and decline in foreign reserve.
We Know that the optimal exchange rate policy which is intended essentially to treat Misalignment in the balance of payments structure through the optimal use of available resources of foreign exchange, and contribute to increase the outcome of the country's foreign exchange, exchange rate plays dual role in the national economy, because it enhances the competitive advantage , which ensures stability to balance of payments , and also plays main role to stable domestic prices from the impact of influencing spending on both exports and imports.
Part -2- Causes of the Egyptian Balance of Payments Misalignment:
Egyptian Policies Maker has used Exchange rate policies as a sole tool to treat imbalance in the balance of payments2 during the period
1981-2011 to solve all crises leaving other alternative policies, moreover in the same time Egyptian pound Depreciation policy did not succeed over last thirty years ago which will be clearly in this part. Depreciation policy to Egyptian pound causes high inflation manner to the Egyptian economy that was not the case for other economies , even those where the share of food in the overall basket of consumption is as high as Egypt with the absence of solutions to establish alternative Agricultural policies, also inflation raise the export prices and decline the global competitiveness, as a result of worsening external debt as well as the Egyptian Economy is characterized by huge corruption and Commodity smuggling from customs port area's in addition to the Egyptian businessmen's transfer profits which were achieved at their companies into foreign currency because they lack of confidence in the Egyptian pound as well as smuggling money abroad . Meanwhile the main goal for all previous Egyptian's cabinet were interested in reserve accumulation
1 Joannes Mongardini, estimating Egypt's equilibrium real exchange rate,
IMF working paper , wp/98/5, 1998.
to maintain good relationship with external economic position, Despite the internal economic which Suffered from government budget deficit and liquidity problems but Also, inflation which remains high since.
More generally, the situation was worse After 25 January 2011 revolution, foreign reserve began to decline without suggestive of a conscious effort to control import associated with foreign purchases. The very important question is now. How we can continue in this way? The Egyptian policy maker still deal with the Economical structural problems with a peace option with the absence of government institutions to start planning in order to map the Egyptian investment future, sets Literature essential executive programs in spite of changing individuals in the area of decision-making policy which change with them.
(2-1) Egyptian trade balance 1981-2011
The most prominent features of the trade balance see (table 3-1 shown
the trade balance1981-2011) was in deficit situation throughout the
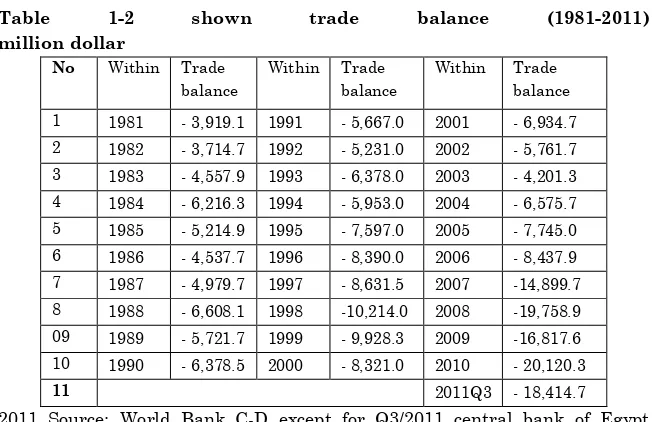
study period and continued trade balance deficit, worsening during the 1981s ,1990s and 2000s due to the increasing demand for imports with decrease of exports, as well as deterioration in commercial trade exchange against the Egyptian merchandise. This was reflected in the balance of payments misalignment on the coverage rate of export earnings for imports, Imports began to double the export during the 1980s. Until the end of 1980s the gap was raise up at peak position and registered its highest level during the period under study (1981 - 2011) to reach three times and a half in 1988. Then Imports started to fall in the early 1990s and then rise gradually. With some minor changes until 1998 imports registered the highest growth rate during the1990s, and reach to three times and 1/3 in 1998 from exports.
With the pressure to reach normal position, in year 2000 imports were two times exports then dropped to one time and half in 2003 , the gap began to narrow again until 2010 and then the gap between imports and exports declined until the Q3 after 25 January revolution in 2011 and became imports exports close to double.
More generally words, imports exceed exports during the study period as follows:
During 1980s was 200% - 340% in 1988.
During 2000s was 150% - 200% Q3 /2011.
Table 1-2 shown trade balance (1981-2011)
million dollar Trade balance Within Trade balance Within Trade balance Within No - 6,934.7 2001 - 5,667.0 1991 - 3,919.1 1981 1 - 5,761.7 2002 - 5,231.0 1992 - 3,714.7 1982 2 - 4,201.3 2003 - 6,378.0 1993 - 4,557.9 1983 3 - 6,575.7 2004 - 5,953.0 1994 - 6,216.3 1984 4 - 7,745.0 2005 - 7,597.0 1995 - 5,214.9 1985 5 - 8,437.9 2006 - 8,390.0 1996 - 4,537.7 1986 6 -14,899.7 2007 - 8,631.5 1997 - 4,979.7 1987 7 -19,758.9 2008 -10,214.0 1998 - 6,608.1 1988 8 -16,817.6 2009 - 9,928.3 1999 - 5,721.7 1989 09 - 20,120.3 2010 - 8,321.0 2000 - 6,378.5 1990 10 - 18,414.7 2011Q3 11
2011 Source: World Bank C-D except for Q3/2011 central bank of Egypt
reports no 173 august
On the import side, industry and development related goods (60%) dominate, with consumer goods accounting for only 20% of import value, which is all appropriate to a developing country. Egypt is a member of the World Trade Organization and concluded an Association Agreement with the EU.
Egypt has for long been a rather closed economy with merchandise exports at only 10% of GDP. With imports of goods structurally higher at 20% or more of GDP, this implies a trade deficit of 10% to 15% of GDP (see chart 5). Since 2008, the country has become a major exporter of natural Gas via pipelines to only a narrow range of neighboring economies. Together with very modest Income from oil sales, natural gas exports account for 50% of all merchandise exports.
developing country. Egypt is a member of the World Trade Organization and concluded an Association Agreement with the EU. This facilitates access to the EU markets, but also obliges the authorities to phase out Tariffs on imports by 2015. A free-trade bilateral agreement with the US is in the making since the Early 1990s, but the US still considers Egypt’s economy too much dominated by the state and Egypt’s “Military Inc.”, which is estimated to own as much as 40 % of the nation’s economy.
Existing bilateral US-Egypt tariff reductions can still unilaterally be withdrawn. Although a member of African and Middle Eastern trade bodies, these markets are not significant yet as bilateral trade is still low: the quality of Egypt’s output cannot compete on the demanding Arab markets and black Africa’s markets too small to make an impact.
The large structural trade deficit is partly compensated by surpluses on services balance, where revenues are derived from tourism (expected to be down in 2011 and 2012) and the Suez Canal transit fees (likely to remain unaffected by the turmoil). The services surplus in 2011 is projected to be substantially reduced to just 3% of GDP, against 10% in 2008. Of little help to restore balance of payment equilibrium are the expected transfers of Egyptians working abroad. These may lower to 3% of GDP in 2011, half the level of 2007 and 2008, when the Gulf state economies were still booming. Helped by low average interest paid on external debt (2% to 3% on principal),the county’s income balance is reported to be more or less in equilibrium, despite the negative net Investment position of the economy (-16% of GDP)3.
The overall effect of these developments is a worsening of the current account from an –on Average- near equilibrium in the past five years to a projected deficit of 6% in 2011. Provided Political near-stability is maintained, tourist should return in higher numbers and the current Account balance may improve in 2012, when the deficit may be reduced to 3% of GDP. The current account deficits have until recently largely been financed by direct investments, with Debt inflows and portfolio investments playing a minor role. For 2011 capital inflows will most likely decline compared with recent years as
3 Leendert Colijin, Economic Research Department, Country Risk Research ,
investor confidence is down due to the political instability. Also, with domestic interest rates hardly changing, the value of the pound declined. The Central Bank resorted to modest selling of foreign reserves early in 2011 to support the Egyptian Pound. The risk of imposition of controls on access to foreign exchange for capital account purposes (thus Other than paying for imports) has increased, but all depends on the maintenance of commercial Banks’ and official FX reserves. Such currency restrictions will affect the inflow of dollar transfers from expatriate Egyptians into Their homeland’s banking system. Foreign currency inflows may increasingly be diverted via non-bank channels (that is paper dollars smuggled in) to a reemerging Black market, rather than be stored in the banking system and add to their FX reserves.
Late 2010, before the unrest erupted, the solid (although far from dynamic), financial system was adequately buffered by high local and foreign currency reserves. These amounted to almost USD 33bn and USD 19bn by the end of 2010. By the end of the first quarter of 2011 the central Bank’s FX reserves had declined modestly to just over USD30bn, a decline of 9%, but still at 6 Months of imports .Thus, as far as data is currently available, these two sources of foreign reserves seem to have held up relatively well and the recent return to relative stability offers positive Prospects.
2-2) A Summary of Literature Review
There is a relatively large theoretical and empirical literature on the effect of Exchange rate policies to deal with the balance of payment which can, for the most part, be classified into two categories as following:
Group – (A) Studies associated with impact of exchange rate and balance of payment:
1- Exchange Rate Fluctuations and the Balance of Payments:
countries and given their high dependency on imports, the current account balance deteriorates with respect to currency depreciation. Across industrial countries, the reduction in the value of exports with respect to currency depreciation correlates with a reduction in the value of imports. The combined effects cancel out on the trade and current account balances in industrial countries. Similarly, currency appreciation increases the nominal value of exports and imports without a significant effect on the current account balance in industrial countries. The combined evidence highlights the benefits of a flexible exchange rate system, prevailing in many industrial countries, to ensure that a depreciating rate curbs import growth and increases financial flows. In contrast, currency appreciation increases imports and deteriorates the current account balance across developing countries. Moreover, the evidence indicates the adverse effect of an overvalued exchange rate and the expected deterioration in the balance of payments should developing countries be forced to abandon a peg abruptly.
2-The Exchange Rate and the Balance of Payments in the Short Run
and in the Long Run: A Monetary Approach Dr Pentti J. K. Kouri,
3- The Current Account and Real Exchange Rate Dynamics in African
Countries: A.H. Ahmad Eric J. Pentecost, 2012 in this study
Persistent international current account imbalances and real exchange rate movements have become a permanent feature of the world economy. , therefore, sets out to investigate the relationship between the real exchange rate and current account dynamics of eleven African countries, using data from 1980 to 2008, based on a stochastic Mundell-Fleming model in which shocks to real exchange rates and current account have been identified as permanent and temporary. Using a bi-variate structural VAR approach, the results are in consistent with the theoretical model, with permanent shocks having permanent and positive effects on both the current account and the real exchange rates. On the other hand, while temporary shocks have insignificant effects on the real exchange rates, they have very different effects on the current accounts of different countries.
4-The Balance of Payments as a Monetary Phenomenon: Econometric
Evidence from Pakistan Muhammad Umer, Suleiman D. Muhammad, Asif Ali Abro, Qurrra-Tul-Ain Ali Sheikh and Ahmad Ghazali, 2010 in this study analyzes the balance of payments for Pakistan through monetary approach for the period 1980-2008. This study utilizes the reserve flow equation, Cointegration test and error- correction model to analyze whether glut money supply influence a disturbance variable or not. The results have shown that the role of monetary variables for Pakistan’s balance of payment do not determine empirically. Three significant relationships have found between Gross Domestic Product Growth Rate (GDPG) and net foreign assets (NFA) is considered as a positive relationship while between Domestic Credit (DOM_CREDIT) extension and NFA is considered as a negative relationship, and the relationship between interest rate (INTEREST) and NFA is considered as a negative relationship as mentioned by the monetary approach to balance of payments. Some variables propose that monetary approach plays a significant role but monetary actions are not only options for authorities to correct the Balance of payments disequilibrium.
5- The Impact of Exchange Rate Reforms on Trade Performance in
Nigeria: Ben U. Omojimite and Godwin Akpokodje, 2010 Exchange
economic reform programwas anticipated to diversify the export base of the economy from oil to non-oil exports through competitiveness in the relative price of non-oil exports in addition to reducing imports, especially of consumer goods. This study investigates the effect of exchange rate reforms on Nigeria’s trade performance during the period 1986-2007. It finds a small positive effect of exchange rate reforms on non-oil exports through the depreciation of the value of the country’s currency. It was also found that the structure of imports which is pro consumer goods remained unchanged even after the adoption of exchange rate reforms. Exchange rate reforms were found not to constrain imports as anticipated. Rather, they stimulate imports, albeit insignificantly. A major policy lesson is that exchange rate reforms are not sufficient to diversify the economy and change the structure of imports. Major incentives in the form of conducive
environment for domestic production, especially effective
infrastructure that could lead to significant improvement in competitiveness are required.
after the shock, which are in line with previous empirical evidence regarding some individual European countries.
7- "Effect of Exchange Rate Shock on Tunisian Trade
Balance" (RABHI ABDESSALEM BEN LTAIF, 2011) The aim of this
study is to show the effect of fluctuations in the exchange rate on the flow of trade through two channels (after price - after quantity / volume) in the Tunisian economy. And the findings and recommendations concluded that the impact of exchange rate shock on the trade balance Tunisian marginal.
Group-(B) Studies in equilibrium exchange rate determinants in Egypt's:
8- Equilibrium real exchange rate determents in Egypt in the short
and long run during the period (1970 - 2001): (Mohieldin, and
Kouckouk, 2003), the aims of this study to build a model to examine nominal and essential economics variables effect on real exchange rate in the short and long run the results was found that what happened in the Egyptian economy after the application program economic reform in 1991, where the real index decreased steadily (i.e., raise equilibrium real exchange rate value of Egyptian pound ) The results indicate no significant of some economics variables because of the nature of Egyptian economy.
9- Estimating Egypt's Equilibrium Real Exchange Rate during the
period (1987-1996): Joannes Mongardini, 1998, the study set out on
developments in Egypt's external competitiveness through the estimation of the equilibrium real exchange rate. The result suggest that while the real exchange was substantially overvalued before 1993, it has since moved into closer convergence with equilibrium rate, at the end of 1996, the REER is estimated to be some 7 percent appreciated vis-à-vis the ERER .in the course of estimating the equilibrium real exchange rate, the study conclude that the Paris Club debt relief phased in during the period 1991-1996 had a significant impact on Egypt's real effective exchange rate.
results indicate the long-term to increase liquidity or money supply during the eighties, leading to higher prices and then increase the real exchange rate. During the implementation of the reform program, the Egyptian government has pursued a policy of monetary expansion through the issuance of treasury bills, which led to the increase of both capital flows that result in current account surplus. In the short term, the results indicate affected the real exchange rate terms of trade and the degree of openness and dummy variable only, while lacking the rest of the variables included in the model to statistical moral.
11- Another study for (Kamar, 2005) associated with the determinants of the exchange rate in the Egyptian economy model was used vector regression and co integration methodology analysis according. This model has been applied to the Egyptian economy during the period (1960 - 2000). The results of the model in the long term to not affect the real exchange rate shocks accumulated which only exposed in moving only, not on the long term. So while influenced by the real exchange rate positively to monetary policy, especially with the Egyptian government's use of monetary policy by printing money (increase the money supply) to finance the budget deficit has. Also affected by positive government consumption, and for the terms of trade, and with respect to the results of the model in the short term, refers to the affected the real exchange rate negatively to monetary policy and dummy variable expressing for the deterioration of the value of the Egyptian pound against the U.S. dollar during 1979.
Part – 3- Estimating the impact of real exchange rate on the balance of payment misalignment in Egypt in 1981-2011.
(1-3) Model Specification
This model was used by (Edwards, 1989, 1994), Expanded by (Elbadwai, 1994) and applied by (Mongardini, 1998) to estimate the exchange rate equilibrium of the Egyptian economy within the period 1986-1996.
been extended to an infinite horizon without substantial differences. Internal equilibrium is defined in the model as the clearing of all non-tradable markets (static equilibrium). External equilibrium is attained when the net present's value of the future current account is non-negative, given the level of exogenous long-run Capital in flows (dynamic equilibrium). These two equilibrium conditions identify a unique RER. Agents in the model are endowed with prefect foresight that they will immediately respond to an unsustainable current
account by changing their consumption and investment decisions.4
The kernel of Edward`s empirical analysis is to determine the equilibrium real exchange rate by disentangling fundamental change in the level of actual rate from temporary influences brought about by nominal exchange rate shifts as well as monetary and fiscal policy.
From the theoretical model, two equations are derived that describe (I) the factors determining the ERER, and (ii) the dynamics of the real exchange rate. By definition, the dependent variables of equations (I) are the fundamental factors affecting the ERER. Leaving the discussion of what those variables should be to the next sections, the structural equation for the ERER will then be.
Edward's model also assumes that in the short-run the real exchange rate adjust towards the equilibrium rate at a speed given by the parameter ϴ. The equation No (1-3) defining these dynamics is given by:
Log (RERt) = β0 + β1 Log (FUNDit) + (1- ϴ) Log (et-1) -λ (Zt – Zt*) + δ
NOMDEVt+ Vt (1-3)
Where:
(FUND): represents the direction of true underlying variables, which affects the equilibrium value of the real exchange rate.
(Zt - Zt *): is a direction which describes and measures the deviation of economic policy variables for optimum value in steady state.
NOMDEVt: is the nominal value of the nominal exchange rate to
represent the annual currency depreciation rate.
4 Sebastian Edwards, Real Exchange Rates In The Developing Countries
2-3) The Equilibrium Real Exchange rate estimation:
Phase (1): real exchange rate model of the Egyptian pound against the U.S. dollar:
An estimate relationship of the real exchange rate with related variables, as a function of key variables in the mid and long term, as well as function in macroeconomic policy variables and exchange rate policy in the short term.
Phase (2): estimate exchange rate equilibrium of Egyptian pound against the U.S. dollar:
To build exchange rate equilibrium of Egyptian pound against U.S dollar by optimal values for basic variables in case of steady – state.
Phase (3): calculate index number for deviation of the real exchange rate from its equilibrium level: This is done by taking the difference between the estimated values of the index of the real exchange rate and the index of the equilibrium exchange rate. Then can be substitute through the previous equation to equation (1), which describes the equilibrium value of the real exchange rate in the long term as a function of the fundamental variables: -
Log ( RERt*) = β 0 + β 1 Log ( CFLOW ) + β 2 Log ( GCF ) + β 3 Log (
GOVEXP ) + β 4 Log ( OPENESS ) + β 5 Log (DOMCR ) + β 6 Log
( TDS ) + β 7 Log (GDEFICIT + β 8 Log ( INF ) + β 9 Log ( TOT ) + β 10
Log (GDPG) + Vt (2-3)
Where:
RERt *: exchange rate equilibrium.
(CFLOW): capital flows.
(GCF): ratio of capital formation to GDP as a proxy for the ratio of
investment.
(GOVEXP): ratio of government consumption to GDP as a proxy for
government spending.
(OPENESS): trade restrictions - trade openness.
(DOMCR): expansion in credit creation.
(TDS): debt service ratio to GDP.
(GDEFICIT): proportion of the overall deficit in the budget to the
(TOT): the commercial trade exchange.
(GDPG): the growth rate in GDP as a proxy for the technological
progress (TECH)
(INF): inflation as a proxy for the degree of expansion in economic
policies.
Vt: : Error correction Factor
While the data set outlined the following is deal for the empirical estimation of Edward's Model and Mongardini, it is clear that operationally some of these variables are not readily available. In his own empirical work, Edward's used proxies to substitute for some variables, In case of Egypt, the limited availability and frequency of required data necessitates estimating equation NO (2-3).
(3-3)Technical data description:
Data were obtained annually for the period 1981 – 2011, for both exports and imports and the percentage of government consumption to GDP, capital flows, foreign direct proportion ,capital formation to GDP, and the proportion of bank credit to GDP, and the debt service to exports, and the growth rate in GDP, the nominal exchange rate, and inflation rate , and consumer price index in Egypt and (wholesale prices) in the United States from the statistical database CD-ROM World Development Indicators (WDI) and for the terms of trade and government budget deficit of the statistical database. Global Economic prospect and all the data from the site of the World Bank website5.
While 2011 data was obtained from central bank of Egypt report no 173 august 2011.
(3-3-1) Fundamental variables:
In this part we will present changes, results and interpretation of the results, which appear each variable in addition to how to get the economic variables.
WPIUS
RER = NER --- CPIEG
5 World Bank website available at internet
Where:
NER: nominal exchange rate index. RER: real exchange rate index.
WPIUS: producer price index (wholesale) in the United States.
CPIEG: consumer price index in Egypt.
We used this measure because it Takes into consideration the most wholesale group of tradable basket of goods and consider the best alternative for the local and foreign goods prices in countries6, in
order to formally compare the behavior of the alternative indexes of the real exchange rate constructed using official nominal exchange rate data ( the nominal exchange rate is the price of the U.S. dollar denominated in Egyptian pounds) where the base year 2005, and was converted the price indexes producers (wholesale prices) in the United States, over consumer prices in Egypt where the Year base 2005.
(3-3-2) Independent variables:
Terms of Trade (TOT):
Defined as the ratio of world priceof a country's export price overthe world price of its import. An improvement in terms of trade will have a positive impact on the current account, and thus lead to an appreciation of The RER.
Capital Inflow (C flow):
A liberalization of capital flows could either improve or worsen capital account, depending on the interest rate differential between the domestic and the world economy prior to the liberalization (i.e depending on whether the controls acted, on balance, to deter inflow or outflow)
If the removal of such controls leads to a higher (lower) level of capital inflow, the RER would appreciate (depreciate).
No well-defined measure of capital controls (Cflow) is available either. To proxy, we use here the net inflow of direct foreign investment as a percentage of GDP, which is indirectly affected by controls.
6 Edwards, Exchange Rates misalignment In The Developing Countries ,the
Government spending (Government Expenditure (GOVEX) :
An increase in public consumption of non-tradables vis-à-vis tradables will improve the current, and thus lead to an appreciation of the RER. No data on government consumption of non-tradables is available (GOVEX).The closest proxy is overall government consumption as a percentage of GDP.
Technological progress (TECH):
Technological Progress will increase productivity in the economy, and thus lead to an appreciation of the RER. This is the well – known Balassa- Samuelson effect which contends that productivity improvements will generally be concentrated in the tradables sector.
No data on Technological progress (TECH)we use the annual growth
rate of GDP (GDPG) as a proxy toTechnological progress.
Trade Barrier (Openness):
Openness reflects the trade Barrier as a proxy of trade policy in the country, the degree of openness measured by the total exports and imports to GDP where are calculated exports and imports and dividing by the GDP.
(X + M) OPENESS = --- GDP
The intended procedure that tight liberalization between different countries. The most important restrictions on trade is tariff and customs regulations so, due to the lack of time-series data for this variable we are used the above mentioned equation.
The severity of trade restriction. A liberalization of the current account usually leads to an increase of imports, a worsening of the current account, and thus a depreciation of the RER.
Investment ratio / GDP (GCF):
Inflation (INF):
Was used as a proxy to calculate the degree of expansion in overall economic policies.
Deprecation of the nominal exchange rate (NOMRATE):
The variable for nominal depreciation will be measured by changes in the Nominal exchange rate (NOMRATE). As mentioned before, for the period 1981-2011.
In addition to the fundamental variables outlined above,
Edward's uses the following proxies for monetary and fiscal policy.
The Excess Supply of Demotic Credit (DOMCR):
Defined as the increase in domestic credit that is unmatched by higher growth in the economy. Under a flexible exchange rate, excessive monetary expansion will lower interest rate, boost the domestic demand for non-tradables, and thus induce an appreciation in the RER. Under fixed exchange rate, an excessive monetary expansion would be immediately reversed by a capital outflow leaving he RER unchanged.
Budget deficit (GDEFICIT):
The ratio of fiscal deficit to lagged high powered money. Under a flexible exchange rate, an increase in the fiscal deficit relative to the monetary base in the previous period (loose fiscal policy) will increase domestic demand for non-tradables, and thus lead to an appreciation of REER. Under a fixed exchange rate, loose fiscal policy will initially boost domestic demand with the upward pressure on interest rates dampened by capital inflows and no impact on the RER. In the higher demand for non-tradables will put upward pressure on inflation, and thus lead to a RER appreciation.
The burden of external debt and debt service (TDS):
Dummy variable (V):
Dummy variable express liberalization in exchange rate policy in 2003 and therefore this variable was given a value of 1 (one) in year 2003, and the rest of the time series is zero.
(3-4) Ecnomometric results
(3-4-1) Methodology
In order to estimate7 equation (2-3). First, empirical work based on
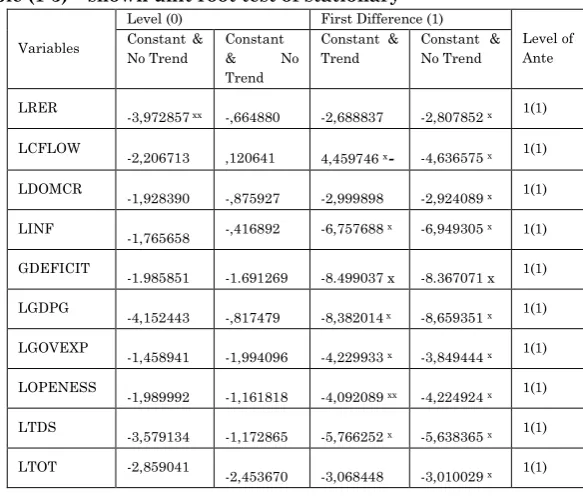
time series that the under-lying time series is stationary of the fundamental variables and the proceed with the appropriate estimation procedure. Table (1-3) provides unit root tests for part of the fundamental variables using augmented Dickey – Fuller statistics, the results show that all variables, except for the capital formation ratio (GCF), can be considered stationary in first differences. For the variable (GCF), we are unable to reject either the I (0) or I (1) process, possibly indicating that the variable fractionally integrated. The difference stationary of the real exchange rate is consistent with other empirical studies of the real exchange rate. We are use CO-integration Engle-Granger procedure in estimating equilibrium exchange rate of the Egyptian pound8.
7 The researcher is used statistical software package Econometric Views 5
pattern CO-integration Engle-Granger in estimating the equilibrium exchange rate of the Egyptian pound.
8 The first step is to determine the degree order of integration of each
fundamental variable in order to determine the stationary test analysis for each time series by testing unit root Unit Root Tests.
Second step, now we are use least square method to estimate the relation
between Non-Stationary Variables.
Third step is to test whether there long term equilibrium relationship
between fundamental variables through integration to determine the degree order of integration of error in the regression.
In the final step, if we are reached to the results in the previous step to
(3-4-2) Estimation results A- Stationary test:
While the unit root tests in table (1-3) clearly indicate the need for an alternative estimation procedure to least squares (OLS), standard co-integration analysis requires a strict classification integrated processes, as either a I(0) or I(1) process. No allowance is made for fractionally integrated processes, as may be the case with our GCF variable. Table shows (1-3) shows, Augmented Dickey-Fuller test (ADF) which clearly that the time series suffers from the unit root , which indicates that there Non-Stationary, and the first differences is enough to solve the problem of unit root, that's mean the degree order of Integration for All variables were1 (1) process.
Table (1-3) – shown unit root test of stationary9
Level of Ante First Difference (1)
Level (0)
Variables Constant &
No Trend Constant &
Trend Constant
& No Trend Constant & No Trend
1(1) -2,807852 x
-2,688837 -,664880
-3,972857 xx
LRER
1(1) -4,636575 x
4,459746 x-
,120641 -2,206713
LCFLOW
1(1) -2,924089 x
-2,999898 -,875927
-1,928390 LDOMCR
1(1) -6,949305 x
-6,757688 x
-,416892 -1,765658 LINF 1(1) -8.367071 x -8.499037 x -1.691269 -1.985851 GDEFICIT 1(1) -8,659351 x
-8,382014 x
-,817479 -4,152443
LGDPG
1(1) -3,849444 x
-4,229933 x
-1,994096 -1,458941
LGOVEXP
1(1) -4,224924 x
-4,092089 xx
-1,161818 -1,989992
LOPENESS
1(1) -5,638365 x
-5,766252 x
-1,172865 -3,579134
LTDS
1(1) -3,010029 x
-3,068448 -2,453670
-2,859041 LTOT
9 Based on augmented Dickey-Fuller tests with an intercept but no linear
B - Co –integration process:
1- Estimate integration Regression in the long -term :
In this step we involves Ordinary Least Square (OLS) to estimate the real exchange rate (RER) long run relation between fundamental variables, Table (2-3) show, the results that all fundamental variables are significant10 (10), except for the variable capital formation ratio
(GCF).
In a next stage before proceeding with the results, it should be noted that specification search procedure was adopted to eliminate statistically insignificant variables. This involves a sequential Recursive Process of eliminating variables with the lowest t-statistics with relation in probability to get a more parsimonious description of the model in order to delete the non-significant variables in order to derive an appropriate model, this leads to eliminate capital formation ratio from the model Table (3-3) show these results.
Table (2-3) Co-integration regression in the long term Variable Co-efficient Std.Error t-Statistic Prop.
C LOGCFLOW LOGGCF LOGDOMCR LOGGOVEXP LOGOPENESS LOGTDS LOGTOT GDEFICIT01 LOGINF LOGGDPG 2.109013 0.117405 -0191264 0808057 -.075647 1.01185 -0.18405 0.93180 0.06648 -0.10380 -0.050843 0.875576 0.020242 0.129462 0.238183 0.252992 0.101185 0.049663 0.147843 0.004417 0.036535 0.034851 2.408715 -5.800196 -1.477378 3.392592 -4.251704 9.894609 -3.592297 6.447246 1.504956 -2.829599 -1.458859 0.0263 0.0000 0.1560 0.0031 0.0004 0.0000 0.0019 0.0000 0.1488 0.0107 0.1609 Weighted Statistics R-squared Adjusted R-squared S.E. of regression Sum squared resid Log likelihood Durbin-Watson stat 0.972094 0.957406 0.061266 0.071318 48.05895 2.045861
Mean dependent var S.D dependent var Akaike info criterion Schwarz criterion F- statistic Prob ( F- statistic )
1.420361 0.296859 -2.470597 -1.956824 66.18548 0.000000
10 10 These variables are (CFLOW, DOMCR, INF, GDEFICIT, GDPG,
Table (3-3) Co-integration regression after the elimination insignificant statistically variables
Variable
Co-efficient
Std.Error t-Statistic Prop.
C LOGCFLW LOGDOCR LOGGOVP LOGOPES LOGTDS LOGTOT GDEFICI01 LOGINF LOGGDPG 1.470426 -0.120847 0.946548 -1.246458 0.969768 -0.228849 1.063611 0.008162 -0.101155 -0.069304 0.783635 0.020693 0.225342 0.231585 0.101808 0.037115 0.131272 0.004422 0.037568 0.033482 1.876417 -5.840038 4.200502 -5.382291 9.525469 -6.165929 8.102346 1.845918 -2.692566 -2.069854 0.0753 0.0000 0.0004 0.0000 0.0000 0.0000 0.0000 0.0798 0.0140 0.0516 Weighted Statistics R-squared Adjusted R-squared S.E. of regression Sum squared resid Log likelihood Durbin-Watson stat 0.968888 0.954888 0.063052 0.079510 46.42780 2.145962
Mean dependent var S.D dependent var Akaike info criterion Schwarz criterion F- statistic Prob ( F- statistic )
1.420361 0.296859 -2.428520 -1.961454 69.20468 0.000000
Now, Augmented Dickey-Fuller test (ADF), results that all fundamental variable in the model is stationary of integrated of order 1(1), and also the error term (vt) is stationary of order I (0) process,
(i.e. Time series for residuals from regression). Then we say that's clearly a strong evidence that the overall variables in this model are Co-integrated as highlighted in table (2-3), (i.e. linear Combination between these variables do not have a random direction) , and there are long-term equilibrium relationship between these variables .
Overall, Table (2-3) presents the long run RER estimates, the table shows that all of the estimates on the group of fundamental variables accumulated have the expected sign and are significant these means the real exchange rate RER reflected at the 97 percent, and indicates that the corresponding hypothesis can be accepted at the
1and 5 percent confidence interval as the following estimation
analysis:
1 - Government spending to GDP ratio (GOVEXP):
this theory) while consume the largest part of their spending non-tradables compared with the private sector. This reflects the policy of Egyptian authorities to consolidate the fiscal stance and scale back government operations in order to give the private sector greater investment opportunities, while the overall fiscal consolidation continued, expenditures on food subsidies and investment goods increased consumption.
2 – Capital Formation to GDP factor (GCF) indicates that is insignificant statistically and therefore was eliminated from the model.
3 - Net capital account as a percentage of GDP factor (CFLOW):
likely decline compared with recent years as investor confidence is down due to the political instability.
4 – Trade Barrier (Openness):
The severity of trade restriction expressed by open economy policy a broad and customs restrictions. A liberalization of the current account usually leads to an increase of imports, a worsening of the current account, and thus a depreciation of the RER, in the other mean that whenever the Egyptian economy more open and liberalized thus will lead to an appreciation in the real exchange rate in the same time depreciation of the Egyptian pound, this result may be confirm that lower tariffs in a small country always requires a decrease in the real value of the local currency11. So the decrease in the domestic price for
imported goods as a result of lower tariff increases the demand for imports and leads to deterioration the trade balance, and to back one more time to the equilibrium in the trade balance requires deprecation in the real value of the local currency. Thus explained as, the more restrictions would be limit imports, and reduce the demand for foreign currency, which appreciation the real exchange rate value of the local currency, thus actually was happened in Egypt during period (1981 - 2011) the trade balance was increased while, the openness reduce restrictions on imports that lead to higher prices imports , due to the low elasticity of imports in case of Egypt economy12, whereas the most of the imports of intermediate goods
needed for production, or necessary goods. Thus the opposite is right.
11 Edward, S., and S. van Wijnbergen. (1987) "Tariffs, the Real Exchange
Rate, and the Term Of Trade .Oxford Economics Paper
12 Existing bilateral US-Egypt tariff reductions can still unilaterally be
5 – Terms of trade (TOT):
An improvement in terms of trade will have a positive impact on the real exchange rate, and thus lead to an appreciation of The RER in the other side lower the Egyptian pound value. the result consistent with the case of the Egyptian economy unlike the most of developing countries13 (13), because substitution effect which arises from the
improvement in the terms of trade more than the income effect occurs at the same time, Terms of trade Defined as the ratio of world priceof a country's export price over the world price of its import which indicates that where the relatively high prices of exports (compared priced imports) improvement in the terms of trade , while indicating the relatively high prices of exports (compared) priced imports to increase in terms of trade because these improvement leads to higher real income , and then increase demand for non-tradables.
Consequently high prices reflected in rising real exchange rate and similar deterioration in terms of trade exchange lead to lower real exchange rate14, according to the impact of income effect which
explaining the increase of the real exchange rate during the second half of the 1980s and the second half 1990s due to increase of terms of trade.
In response to the large depreciation, the terms of trade improved considerably during the period 1987-1991, albeit not in a monotonic way. Part of the beneficial effects of the depreciation was in fact reversed in 1989, due to lower export prices (mainly oil and cotton). These unfavorable conditions did not continue and during 1990s Egypt`s terms of trade improved again, mainly due to higher oil prices associated with the Gulf War and a contraction of wheat prices (one of Egypt`s largest imports). Between 1992 and 1994, the terms of trade worsened by about 20 percent, as the price of oil weakened, while the prices of other commodities remained relatively stable. In 1995 and 1996, the terms of trade did not change substantially, as higher oil prices in 1996 were offset by higher import prices of wheat and maize. Since 2008, the country has become a major exporter of natural Gas via pipelines to only a narrow range of neighboring economies.
13 see Leendert Colijin , Economic Research Department, Country Risk
Research , country report Egypt , Rabobank Nederland , may 2011 .
14 Edwards, Exchange Rates misalignment In The Developing Countries ,the
On the import side, Industry and development related goods (60%) dominate, with consumer goods accounting for only 20% of import value, which is all appropriate to a developing country. The large structural trade deficit is partly compensated by surpluses on services balance, where revenues are derived from tourism (expected to be down in 2011 and 2012) and the Suez Canal transit fees (likely to remain unaffected by the turmoil).
6 – Foreign Debit service to export ratio (TDS):
Indicates that if the debt service ratio falls permanently, this will improve the sustainability of the current account and thus lead to an appreciation of the real exchange rate thus depreciation the Egyptian pound value. This results consistent with what has happened in Egypt during the period after apply open economy policy there for increase in foreign debt volume this appeared during the early 1980s and until 1989 and pass due loans, unlike what was happened after had been Egypt associated in the war of Kuwait to liberation in 1991 and starting in implementing the economic reform program and in that year Paris club was waived of half official foreign debt due and rescheduling Second half, the result to appreciation in the Egyptian pound. There is a clear jump in the series associated with the Paris club dept relief agreed with the Egyptian authorities in July 1991.
The debt relief entailed a cumulative reduction in the net present value of the outstanding foreign dept stock of 55 percent. additional military dept owed to the united states was also forgiven in 1991 in turn this has reduced the dept service ratio From 42 percent in 1990 to below 10 in 1996 ,an average savings of over US$ billion dollars a year in debt service payments.
The researcher concluded from the results table (3-3) to satisfactory results, where long-term factors significant statistically, and then it can provide the real exchange rate equilibrium derived from these estimates with reasonable degree of accuracy.
C- Error correction Mechanism (ECM) for the real exchange rate: -
and can use this error term to tie the short-run behavior of RER to its long-run value after elimination of the speed of adjustment . In the light of previous results, which confirms that all the variables have a degree Stationary at I (I) process and also the Error Term stationary I (0) process, Then Error Correction Mechanism (ECM) used by Engel and Granger to corrects disequilibrium in the short-term .
LOG(RERt) =α0 ECM t-1+ ∑pt-1ƴi DRERt-i+∑qt-0 δ D Xt-i+∑si=0τ D Wt-i+ Vt
(3-3)
Where:
DLOG (RERt): First differences of the real exchange rate .
DXt-i: First differences fundamental variables.
DWt-i: First differences economics policy variables.
t: refers to time
i: refers to the periods of delay.
Therefore, we just showed the following equation (3-4) conclude the characterization the estimation for error correction:
DLog (RERt*) = β 0 + β 1DLog ( TOT ) + β 2DLog(INF) + β 3DLog ( GOVEX )+ β 4
DLog ( OPENESS ) +β 5 DLog ( DOMCR ) + β 6 DLog ( TDBS ) + β 7 DLog
(GDEFICIT ) + β 8LOG (D NOMRATE ) + β 9 DLog ( CFLOW ) + β 10 DLog
(GDPG ) + Vt (3-4)
Table (4-3) presents the short-term estimates of equations (3-3),(4-3)following the Co-integration procedure . Overall, the table shows that all of estimates on fundamental variables and nominal deprecation have the expected sign and significant at 97th percent,
which addition, the estimate on the error correction model estimate (ECM) is presented negative sign which is highly significant and thus attests to the significance of the Co-integration procedure. That reflects the dynamic Mechanism for Error Correction for the RER.
It is also worth highlighting that the estimated Error
Correction Mechanism (ECM) coefficient on the lagged RER of
(-0.575837) implies a relatively slow speed of adjustment to shocks in
the fundamental variables.
happen initially in case of the real exchange rate overvalued in the previous period than equilibrium value , meaning that the speed of partial adjustment in the direction of equilibrium in the long term behavior up to (-0.575) of the total change in the values of variables in the short term , that indicates relationship deviation in the short-term behavior to equilibrium requirements in the long short-term are corrected every four years.
In addition error correction model shown that even in the short term, the real exchange rate is affected by temporary
fluctuations and short term of fundamental variables (terms of trade,
capital inflows, degree of openness, government consumption, inflation, technological progress , foreign debt service ratio, expansion
of domestic credit, government budget deficit), as well as the estimates
showed that the effects are short-term for these variables as shown error correction model comply with influences short-term as stated earlier .
Table (4-3) DRER: Error Correction Regression In short term behavior Prop. t-Statistic Std.Error Coefficient Variable 0.0014 0.0009 0.0002 0.0000 0.0050 0.0005 0.0000 0.6127 0.0282 0.0746 0.0001 0.0290 0.0268 -3.921796 -4.145341 4.828751 -7.174768 3.284645 -4.397031 7.712715 -0.516987 -2.429006 1.916040 5.109645 2.414447 -2.454803 0.011165 0.017137 0.168228 0.178154 0.117926 0.051939 0.109259 0.003944 0.020418 0.025421 0.036161 0.048977 0.234576 -0.043786 -0.071037 0.812332 -1.278213 0.387345 -0.228379 0.842681 -0.002039 -0.049596 0.048707 0.1847690 0.11825 -0.575837 C DLOGCFLW DLOGDOR DLOGGOVP DLOGOPES DLOGTDS DLOGTOT DGDEFICIT DLOGINF DLOGGDPG DNOMRATE DUMMY ECM(-1) Weighted Statistics -0.010032 0.175134 -3.468271 -2.849747 50.01906 0.000000 Mean dependent var
S.D dependent var Akaike info criterion Schwarz criterion F- statistic Prob ( F- statistic ) 0.975619 0.956114 0.036689 0.020191 61.55579 1.972554 R-squared Adjusted R-squared S.E. of regression Sum squared resid Log likelihood Durbin-Watson stat
D- The impact of macroeconomics policies and the exchange rate deprecation policy for the Egyptian Pound:
Defined as the Excessive supply in domestic credit that is unmatched by higher growth in the economy. Under a flexible exchange rate, excessive monetary expansion will lower interest rate, boost the domestic demand for non-tradables and deterioration in the trade balance, and thus induce an appreciation in the RER thus lead to depreciation of the Egyptian pound, in the same meaning in reading Mendel Fleming model confirms the validity of these relationship, and also in the case of expanding credit in the without right degree of economic growth.
Under fixed exchange rate, an excessive monetary expansion would be immediately reversed by a capital outflow leaving he RER unchanged. Meanwhile under flexible exchange rate regime, expansion will lead to a lower interest rate which will increase in domestic consumption and lower saving and thus increase the demand for non-tradable goods trade, and also this leads to appreciation of the real exchange rate.
2 - Expansion in overall economic policies expressed inflation (INF):
Inflation factor indicates that government intervention in determining the exchange rate during the 1980s due to the increase of the money supply. That led to high rates of inflation and therefore appreciation of the real exchange rate and the depreciation of the Egyptian pound. During the economic reform period-which began in 1991 – the government has used monetary policy, and central bank intervention (through the purchase of excess foreign currency) to avoid increase in nominal exchange rate15. So while the real exchange
rate influenced positively by monetary policy, especially with the Egyptian government's use the monetary policy through printing money (increase the money supply) to finance the budget deficit, the results indicate that continuous increase in prices and then appreciation of the real exchange rate. And also during the implementation of the reform program, the Egyptian government has stipulated expansion monetary policy through the issuance of treasury bills, which lead to the increase of both capital inflows and
15 Kamar, B. and Damyana Bakardzhieva. (2003) "Economic Trilemma and
the current account surplus. At the same time, the central bank intervened in the monetary policy to purchase foreign exchange surplus, to reduce the increase in nominal rate of the Egyptian pound, and avoid the loss of competitive advantage for Egyptian exports.
3 - Expansionary fiscal policy expressed Budget deficit (GDEFICIT):
The ratio of fiscal deficit to lagged high powered money. Under a flexible exchange rate, an increase in the fiscal deficit relative to the monetary base in the previous period (loose fiscal policy) will increase domestic demand for non-tradables, and thus lead to an appreciation of REER. Under a fixed exchange rate, loose fiscal policy will initially boost domestic demand with the upward pressure on interest rates dampened by capital inflows and no impact on the RER. In the higher demand for non-tradables will put upward pressure on inflation, and thus lead to a RER appreciation that lead to depreciation of the Egyptian pound, whereas expansionary fiscal policy will lead to increased domestic demand, which followed by a deterioration of the trade balance, followed by reduction of the local currency . The increase in the budget deficit could lead to increased demand for non-tradable goods trade, causing increase prices and then the increase of exchange rate equilibrium relatively. The government in Egyptian economy consumes exportable, importable and non-tradables. Government revenue derives from lump sum taxes, proceeds from import, tariffs, taxation of foreign borrowing by the private sector, and from borrowing abroad. The government's budget constraint states that the value of government expenditure (including foreign debt service) has equal the value of government revenue.
4 - Exchange rate policy:
temporary effects due to nominal depreciation, monetary policy and/or fiscal policy, the policy makers can use Nominal depreciation to speed moved closer process of the real exchange rate toward its equilibrium rate. These confirm that the nominal depreciation in the exchange rate policy may not be only sufficient to correct the real exchange rate direction, may be found another factors solve the problem.
Overall, the results stipulated that error correction (ECM) model for the real exchange rate concluded the dynamic real exchange rate RER in the short term, and also the right assumption to speed (slow) moved closer process of the real exchange rate toward its equilibrium rate effects due to short-term policies such as nominal depreciation, monetary policy and/or fiscal policy. Thus means that any changes moving in the Nominal and Real Exchange Rate affect the Dynamic real exchange rate (RER) behavior in the short run.
F-The Equilibrium real exchange rate index of the Egyptian pound:
The equation (1-3) provides the real exchange rate behavior in the long- term. according to (Edwards, 1989), (El Badawi, 1994) and (Mongardini,1998) estimation model , these are in fact estimates of the βi coefficients in equation (1-3) to Measure the equilibrium real
exchange rate of the pound against the U.S. dollar in the long term ERER as following :-
We are used for Co-integration regression to the fundamental variables in the long term, as shown in Table (5-3) in the equilibrium value real Egyptian pound against the U.S. dollar, and that reconfigure time series convenience for the fundamental variables in order to reflect the Fundamental Macroeconomics Sustainable Values by following Hedrick-Prescott Filter16, the Table (5-3) and figure
(1-3),(2-3) Reflecting the real exchange rate index value (RER) of the Egyptian pound against the U.S. dollar, and the equilibrium real
exchange rate index value (ERER) following the Hedrick-Prescott
Filter during (1981 - 2011), as well as the deviation of the equilibrium
real exchange rate of the Egyptian pound against the U.S. dollar.
16Hoodrick, Robert, and Edward C. Prescott (1997), "Postwar U.S Business
Table (5-3) has shown the real exchange rate index (RER), the equilibrium real exchange rate index (ERER) and deviation of the real exchange rate (Misalignment %).
Table (5-3) (RER) (ERER) and (Misalignment %)17
Year RER ERER Misalignment
1981 5.67523646 4.728294233 16.6855114
1982 5.04680034 4.438157085 12.05998284
1983 4.40096591 4.157489359 5.532343495
1984 3.85089525 3.90184691 -1.323112067
1985 3.41830227 3.689220358 -7.925515848
1986 2.67870396 3.537090808 -32.04485679
1987 2.29757125 3.460230181 -50.60382485
1988 2.03160504 3.464826533 -70.54626588
1989 2.17688797 3.545441329 -62.86742255
1990 3.45306907 3.682303818 -6.638579851
1991 5.85038953 3.841957717 34.32988185
1992 5.48259166 3.988654395 27.24874216
1993 5.00824613 4.106729539 18.00064468
1994 4.73663514 4.19545821 11.4253455
1995 4.2476003 4.263130633 -0.365626052
1996 4.05479889 4.323448803 -6.625480586
1997 3.86979804 4.389959412 -13.44156379
1998 3.63271373 4.473522652 -23.14547704
1999 3.56084854 4.579797103 -28.61533006
2000 3.75112096 4.706033253 -25.45671822
2001 4.24353375 4.839292107 -14.03920393
2002 4.57108884 4.957085546 -8.4443055
2003 5.99111369 5.030967868 16.02616594
2004 6.0546466 5.028633403 16.94588082
2005 5.77883333 4.927377939 14.73403613
2006 5.57495766 4.714757398 15.42971829
2007 5.25300087 4.386842254 16.48883443
2008 4.6998222 3.948304984 15.99033292
2009 3.91417517 3.412479651 12.81740079
2010 3.81091759 2.800215491 26.52122685
Figure (1-3) The Real exchange rate index (RER), The equilibrium
real exchange rate index (ERER)
ERERـــــــــــ
RER ـــــــــــ
Figure (2-3)Deviation of the equilibrium real exchange rate index
ــــ
MIS
On the basis of this table (5-3), the figures (1-3) ,(2-3) and the analysis above , it is therefore conclude the following:
The results shown that during the period (1981 - 1983) the Egyptian pound was undervalued on average (11.43%) it seem to confirm the sizable impact of borrowing and foreign debt service in the beginning of 1980s, as well as lower oil prices significantly in 1982 and the application of fixed exchange
17 Source : prepared by researcher: Hedrick-Prescott Filter (Misalignment =
rate system and government subsidies of the Egyptian pound after a period open economy policy.
during the period (1984 - 1990) was the Egyptian pound was
Overvalued on average (33.14%) is due to the imbalance in the economic sector with the decline in oil prices dramatically and thus the Egyptian economy began suffers from shortcomings and weaknesses in the structural and funding, and Egypt had been tried to continuing directing their investments to infrastructure as a necessity for growth and progress for the following stages, so these infrastructure has funded from external borrowing and by the end of 1980s Egyptian economy began suffers from of poor performance and very low rates of economic growth, and imbalances in the macroeconomic structure , thus increased reliance on the outside world to meet the Egyptian consumer needs of the intermediate goods and investment, in addition to worsen government budget deficit during the same period.
during the period (1990 - 1995) the Egyptian pound was
undervalued on average (18.13%) due to mainly in that period the Egyptian government forces to begin adopting the installation and structural economic reforms program with the World Bank in the beginning of the 1990s , in 1990, 1991 the Egyptian pound exchange rate is substantially large depreciations , in addition to adopting tight government policies this suggests that the Egypt's real exchange rate has on average moved closer to its equilibrium rate after four years reform program adaption in 1991 these represents the impact of the succession of the installation and structural economic reforms program.
However, the period (1996 - 2002) the Egyptian pound is
inflation, although this the period shown an inflation rate higher than United States , resulted in a depreciation in the real exchange rate led to appreciation in the Egyptian pound value.
The real exchange rate has begun on average moved far from its equilibrium rate because of bad climate faced Egyptian economy started from the Southeast Asia crisis, and Luxor accident tourism in 1997 and September 11, 2001 as well as the conflicts in the region since the occupation of Iraq and the Arab-Israeli conflict , making the area classified as a war zone , in addition the economy undergone in a recession which stop the capital inflow to Egypt, the justification to the sharp fall tourist Revenue by accident terrorist attack on tourists in Luxor in 1997, as well as the Southeast Asia crisis in 1997, and also the events of September 11, 2001 attack on the World Trade center building at USA. Egyptian Monetary policy-makers made large depreciations to treat the real exchange rate distortions for the Egyptian pound against the U.S. dollar.