ISSN 2286-4822
www.euacademic.org DRJI Value: 5.9 (B+)
Impact of Health and Education on Economic
Growth and Development of Pakistan in the Long
Run and Short Run:
(Evidence from Time Series Data)
AHSAN KHAN1
The Superior College, School of Management Sciences Lahore, Pakistan YASIR NAVEED The Superior College, School of Management Sciences Lahore, Pakistan IJAZ HAIDER National University of Modern Languages Faisalabad Campus, Pakistan
Abstract:
This study is undertaken to determine the causal and dynamic linkage of per capita GDP with educational and health related factors, particularly in case of Pakistan in the long run and in the short run. Unit root tests, ADF, Phillip Perron test and ARDL approaches are applied to model on time series data from 1972 to 2013 of 42 years. Secondary data collected from official websites of WDI, WBG, IMF, MOF and SBP mainly. Health is measured by health expenditures, life expectancy and infant mortality rate. Education on the other side is represented by taking educational expenditure, primary enrollment and secondary enrollment. All of the independent variables showed a positive relationship with per capita GDP, but educational expenditures and primary enrollment showed an inverse relationship with the economic health of Pakistan in the short run. It is strongly recommended that government should increase expenditures on education sector to more than 5% of GNP instead of just 2% as stated in PES (2014), especially to make a positive impact on enrollment at
the primary level and to increase research publications. The findings of this study are very important and helpful for policy makers in formulating various development policies, for managerial decision makings and forward planning. Finally, the government should allocate more than 5% of GDP instead of just 0.4%, according to the PES (2014), for health sector to decrease the death rate, to increase the health level of the population, especially of women.
Key words: GDP, Economic Growth, Health and Education, ARDL and WALD Test.
1. Introduction
and significant impact of health on economic growth of a country. Here health quality is expressed by increasing rate of life expectancy and increase in public expenditures on health sector as for example, Bloom et al. (2001), Acemoglu D. et al. (2003), Bedia and Christophe (2008), Maria J. et al. (2013). On the other side education sector also showed as finds by Basten S. and Cuaresma J. C. (2014), Musila, J. W. and Belassi, W. (2004), positive and significant impact on the GDP per capita of a country. Education situations are measured by secondary enrollment and primary education see, for instance, Xie T. (2013), Hanushek A. E. and WoBmann L. (2007), Mehrara, M. and Musai, M. (2013), Maria R. T. (2014), the education sector has a positive relationship with economic growth and development of a country. The education sector has a positive impact on economic growth and development of a country as stated by Agasisti T. (2014), Akhmat et al. (2014). This positive relationship between education and growth was also observed by Benavot A. (1989) and Afzal M. et al. (2010). According to Munda S. W. and Odebero S. (2014), Jin L. and Jin J. C. (2014) there is positive impact of education on economic growth. But this study shows negative link between educational expenditures and GDP in the case of Pakistan in the short run. Similarly, primary enrollment also expressed inverse relationship with GDP per capita.
2. Literature Review
Particular studies are available in the literature which has re-estimated the economic growth and development, using different time series econometric techniques. Selected studies are reviewed as a representative of all this type of studies because it is impossible to review all in this study.
The researchers analyzed the long run association of education with research productivity, which leads to economic growth and development by using a panel co-integration technique. Their results showed that GDP increased by 0.898 % as a result of the increase in research publications by 1.425 %. They further showed that 1.128 % increase in educational expenditures had increased number of citations by 0.968 % and patents by 0.714 %. They also stated that if there is increase in school life expectancy then there will increase of 0.41% in research and development. Finally, educational research support the students and researchers to face the toughest competitions in the world, it established new ideas, theories, and businesses which leads to economic growth and development.
Recently, Agasisti T. (2014) measured the efficiency of public spending on education for European Union countries by considering data from 2006 to 2009 of 20 European countries. A researcher based his work on a current policy as suggested by the European Community about the provision of efficiency and equity of education by allocating minimum public funds to the education sector. Here expenditure per student were used as input and on the other side OECD-PISA test scores were used as output. Research applied bootstrap Data Envelopment Analysis (DEA) to assess the efficiency scores.
Recently, Maria R. T. (2014) quantified a positive correlation between level of education and fertility at individual (micro) and country (macro) level in Europe. She had taken the date of 27 European Union countries from 2006 to 2011 of two Euro-barometer surveys. Researcher discussed that the number of women is increasing in the economic activities in Europe, which leads to more investment in human capital formation. She tried to remove the conflict of reproductive behaviour and fertility level of women. Results showed a positive impact on the education level of women on lifetime fertility of women.
economic growth by using the cross sectional data of thirty six rich nations. Internet education was represented by interment usage rates. Regression is applied to the data of average annual percentage of internet users of 36 countries over the period from 1995 to 2004.
Bucci A. (2014) conducted a comparative study on influence of innovation, population and product market competition on economic growth in the presence of human capital investment and in the absence of human capital investment. The findings were calculated by applying the aggregate production function. Bucci stated that Lucas (J. Monet Econ 22(1):3-42, 1988) growth model with human capital formation and link between population and economic growth rate showed unclear results in accordance with their availability of empirical evidences.
Munda S. W. and Odebero S. (2014) conducted a research about the interrelationship between cost of education and academic performance of a student near about the study of Barro R. J. (2013). Researchers had divided the schools into two categories that is County schools which are of boarding type and District's schools of Kenya. Data was collected from open and closed ended questionnaires through class teachers about the specific thirteen District's schools and seven County schools.
Basten S. and Cuaresma J. C. (2014) calculated the macroeconomic impact of development in education on economic growth of developing countries of Africa as estimated by Hanushek A. E. and Woessmann L. (2012). They computed positive and significant relationship between investment in education sector and GDP growth, especially in the case of African lower developed countries. They suggested increasing flow of investment in education, especially at post-primary level for the rapid and stable economic growth.
education on economic growth and development. But in case of Pakistan there are various studies related to health and economic growth only and several are related to education and economic growth only. But there is acute shortage of such study that can explore the impact of health and education on economic growth and development of Pakistan in combining form by using ARDL approach. The present study will fill this gap by using annual data from 1972 to 2013.
3. Methodology and Data Sources
3.1. Data
Secondary data of various, given below, dependent variable and independent variables were taken from World Development Indicators 2014, International Monetary Fund, World Bank Group, United Nations, Pakistan Economic Survey, Federal Bureau of Statistics and Handbook of Statistics of State Bank of Pakistan ranging from 1972 to 2013 for 42 years. It is cause and effect relationship based study where GDP per capita is a dependent variable and on the other hand, health expenditures, life expectancy, infant mortality rate, education expenditures, primary enrollment and secondary enrollment are independent variables.
ARDL approach is applied on time series data to estimate the direction and strength of the short run and long relationship of GDP per capita with specified independent variables of health and education sector.
3.2. Method
3.2.1. Estimation Command:
LS D(GDP) GDP(-1) EE(-1) HE(-1) IMR(-1) LE(-1) PE(-1) SE(-1) D(EE(-1)) D(HE(-1)) D(IMR(-1)) D(LE(-1)) D(PE(-1)) D(SE(-1)) C
3.2.2. Estimation Equation:
D(GDP) = C(1)*GDP(-1) + C(2)*EE(-1) + C(3)*HE(-1) + C(4)*IMR(-1) + C(5)*LE(-1) + C(6)*PE(-1) + C(7)*SE(-1) + C(8)*D(EE(-1)) + C(9)*D(HE(-1)) + C(10)*D(IMR(-1)) + C(11)*D(LE(-1)) + C(12)*D(PE(-1)) + C(13)*D(SE(-C(12)*D(PE(-1)) + C(14)
3.2.3. Substituted Coefficients:
D(GDP) = -0.48425*GDP(-1) + 0.5786*EE(-1) + 0.1089*HE(-1) + 2.17476*IMR(-1) + 2.77860*LE(-1) + 0.132*PE(-1) + 0.2876*SE(-1) - 0.00373*D(EE(-1)) + 0.00411*D(HE(-1)) + 2.48604*D(IMR(-1)) + 4.18371*D(LE(-1)) - 0.00170*D(PE(-1)) + 0.03349*D(SE(-1)) - 3751.71813
4. Findings
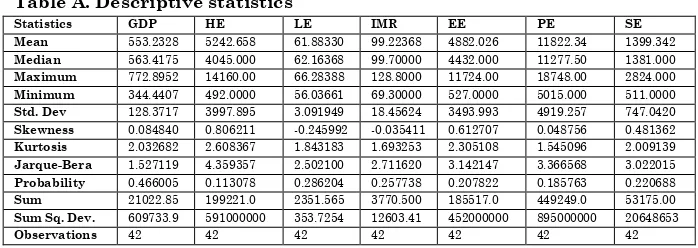
Econometric techniques have been applied to test the affiliation between various series of data. First of all descriptive statistics are applied in order to examine the statistical behaviour of the data. Descriptive statistics are used to examine the distribution of data to estimate the arithmetic mean, median, standard deviation, minimum and maximum rage, variance, skewness and kurtosis. All above discussion will be helpful to state an opinion about the behaviour of time series.
Various empirically investigated results about the GDP per capita and other independent variables related to health and education sector will be discussed in this section. A short summary of estimated results is given below in Table A for the period of 1972 to 2013 for 42 years.
Table A. Descriptive statistics
Statistics GDP HE LE IMR EE PE SE Mean 553.2328 5242.658 61.88330 99.22368 4882.026 11822.34 1399.342
Median 563.4175 4045.000 62.16368 99.70000 4432.000 11277.50 1381.000
Maximum 772.8952 14160.00 66.28388 128.8000 11724.00 18748.00 2824.000
Minimum 344.4407 492.0000 56.03661 69.30000 527.0000 5015.000 511.0000
Std. Dev 128.3717 3997.895 3.091949 18.45624 3493.993 4919.257 747.0420
Skewness 0.084840 0.806211 -0.245992 -0.035411 0.612707 0.048756 0.481362
Kurtosis 2.032682 2.608367 1.843183 1.693253 2.305108 1.545096 2.009139
Jarque-Bera 1.527119 4.359357 2.502100 2.711620 3.142147 3.366568 3.022015
Probability 0.466005 0.113078 0.286204 0.257738 0.207822 0.185763 0.220688
Sum 21022.85 199221.0 2351.565 3770.500 185517.0 449249.0 53175.00
Sum Sq. Dev. 609733.9 591000000 353.7254 12603.41 452000000 895000000 20648653
Observations 42 42 42 42 42 42 42
4.1. Correlation analysis
Correlation analysis is required to observe the correlation between GDP per capita and other independent variables. However, correlation analysis is not a strong measure to identify the relationship; it is not a complete measure to verify the cause and effect relationship. All the independent variables showed a positive relationship with GDP per capita instead of infant mortality rate.
Table B. Correlation matrix of GDP to health and education sector
GDP HE LE IMR EE PE SE
GDP 1.000000 0.961504 0.980604 -0.983643 0.974843 0.970065 0.977543 HE 0.961504 1.000000 0.924471 -0.955475 0.992793 0.938525 0.979848 LE 0.980604 0.924471 1.000000 -0.992669 0.943208 0.979057 0.949573 IMR -0.983643 -0.955475 -0.992669 1.000000 -0.966633 -0.988077 -0.973409 EE 0.974843 0.992793 0.943208 -0.966633 1.000000 0.953363 0.983628 PE 0.970065 0.938525 0.979057 -0.988077 0.953363 1.000000 0.970184 SE 0.977543 0.979848 0.949573 -0.973409 0.983628 0.970184 1.000000
4.2. Unit root analysis
inference involving time series models is called a unit root in Econometrics.
4.3. Augmented dickey fuller (ADF)
An augmented Dickey-Fuller test (ADF) is a type of test in statistics and Econometrics to test the unit root in a time series sample. For the larger and more complicated set of time series models, it is an augmented version of the Dickey-Fuller test. The ADF is a negative number which is used in the test. There will be stronger rejection of the hypothesis as the more negative, it is that there is a unit root at some level of confidence. Methodology equation (Akash et. al, 2011) under Augmented Dickey Fuller (ADF) for the unit root in the Auto regressive Model (AR) model is as given:
yt = α yt-1 + µt
yt is variable under study for the given time period of ‘t’, α is
coefficient µt is the error term.
Δyt = (α -1) yt-1+ µt and Δyt = δ yt -1+ µt
Δyt = First difference operator for the underlying variable.
Estimation and testability of this model for unit root is equal to δ = 0
4.4. Phillip Perron (PP) test
The Phillips-Parron (PP) test was introduced by Peter C. B. Phillips and Pierre Perron. It is a unit root test in statistics. The Phillips-Perron test, as stated by Davison and MacKinnon (2004), report that it performs worse in finite samples than the augmented Dickey-Fuller test.
Wt = β0 +β1 wt-1+β2t (t-T/2) + µt
Unit root tests, Augmented Dickey Fuller and Phillip Perron tests are applied to test the non-stationarity.
Table C. Unit root analysis
Variables ADF (ρ) value
(at level)
ADF (ρ) value (1st difference)
PP (ρ) value (level)
PP (ρ) value (1st difference)
GDP 0.9252 0.0039 0.9450 0.0037
HE 0.9938 0.0457 1.000 0.0118
LE 0.9796 0.2994 0.0024 0.3994
IMR 0.8539 0.1129 0.9675 0.1622
EE 0.9963 0.0000 0.9990 0.0000
PE 0.8556 0.0070 0.9492 0.0000
SE 0.9989 0.0010 0.9989 0.0010
(At 5% level of significance)
4.5. Autoregressive Distributed Lag Model (ARDL)
As stated by Giles D. (2013), ARDL is an abbreviation for Autoregressive Distributed Lag. ARDL model approach is used to test the existence of long run relationships between economic time series data. ARDL model can be used to estimate the Cointegration and to test the long run and short run connections, even when the variables may include a mixture of stationary and non-stationary time series.
Table D: ARDL
The estimation sample is: 1972 - 2013
Variables Coefficient Std. Error t-Statistic Prob.
GDP(-1) -0.484252 0.190880 -2.536945 0.0188
EE(-1) 0.578620 0.008055 0.718320 0.4801
HE(-1) 0.108920 0.006598 0.165006 0.8704
IMR(-1) 2.174766 4.173642 1.719066 0.0996
LE(-1) 2.77860 27.21787 1.939116 0.0654
PE(-1) 0.132001 0.003711 0.355652 0.7255
SE(-1) 0.287561 0.037470 0.500569 0.6216
D(EE(-1)) -0.003735 0.005727 -0.652178 0.5210
D(HE(-1)) 0.004115 0.016829 0.244502 0.8091
D(IMR(-1)) 2.48604 22.19320 2.319902 0.0300
D(LE(-1)) 4.1837 161.8229 1.224695 0.2336
D(PE(-1)) -0.001701 0.003667 -0.463974 0.6472
D(SE(-1)) 0.033496 0.032910 1.017801 0.3198
Table E: Summary Statistics:
R-squared 0.596367 Mean dependent var 11.71077
Adjusted R-squared 0.517367 S.D. dependent var 10.58390
S.E. of regression 8.481285 Akaike info criterion 7.398902
Sum squared resid 1582.508 Schwarz criterion 8.014715
Log likelihood -119.1802 Hannan-Quinn criter. 7.613837
F-statistic 2.500386 Durbin-Watson stat 2.105204
Prob(F-statistic) 0.028089
be rejected in the short run in the case of infant mortality rate, life expectancy and secondary enrollment. On the other hand alternative hypothesis (H1) will be rejected in case of education expenditures, health expenditures and primary enrollment.
As above results of Table E show that the impressive value of R Square (R2) is 0.5964, it means that 59.64 % of the dependent variable that is GDP per capita depends mainly upon or explained by all considered independent variables. It is a high dependency ratio, no doubt, because independent variables include various socio-economic factors which have significant impact on economic growth and economic development of a country, just 40.36 % of GDP per capita is explained by the variables outside of this model. R square (R2) and S.E. of regression are two most important numbers Startz, R. (2009). Our regression accounts for 59.64 percent of the variance in the dependent variable and the estimated standard deviation of the error term is 8.48. Five other elements, “Sum squared residuals,” “Log likelihood,” “Akaike info criterion,” “Schwarz criterion,” and “Hannan-Quinn criter.” are used for making statistical comparisons between two different regressions. This means that they don’t really help us learn anything about the regression, we are working on; rather, these statistics are useful for deciding if one model is better than another. For the record, the sum of squared residuals is used in computing F-tests, the log likelihood is used for computing likelihood ratio tests, and the Akaike and Schwarz criteria are used in Bayesian model (Inductive logic) comparison.
in log(volume) - which is exactly the story we got from looking at the R-squared. “Adjusted R-squared” makes an adjustment to the plain-old R square to take account of the number of right hand side variables in the regression. R square measures what fraction of the variation in the left hand side variable is explained by the regression. When you add another right hand side variable to a regression, R square always rises as it is a numerical property of least squares. The adjusted R square, subtracts a small penalty for each additional variable added.
“F-statistic” and “Prob(F-statistic)” come as a pair and are used to test the hypothesis that none of the explanatory variables actually explain anything. Put more formally, the “F-statistic” computes the standard F-test of the joint hypothesis that all the coefficients, except the intercept, equal zero. “Prob(F-statistic)” displays the p-value corresponding to the reported F-statistic. In this example, there is essentially no chance at all that the coefficients of the right-hand side variables all equal zero. Our final summary statistic is the “Durbin-Watson,” the classic test statistic for serial correlation.
A Durbin-Watson close to 2.0 is consistent with no serial correlation, while a number closer to 0 means there probably is serial correlation. The “D-W,” as the statistic is known, of 2.11 in this example is a very strong indicator of the absence of serial correlation. Summery result shows that the value of Prob(F-statistic) is 0.028 which is less than 0.05 it means that this model is overall good fit.
4.6. Wald Test
estimate. A Wald test can be used for dichotomous variables and models for continuous variables in a great variety of different models. The maximum estimate of a parameter of interest is compared with the proposed value with the assumption that the difference between the two will be approximately normally distributed, under the Wald statistical test.
Table F: Wald Test
Test Statistic Value Df Probability
F-statistic 3.349482 (6, 22) 0.0169
Chi-square 20.09689 6 0.0027
According to Wald Test, F-statistic value is within the critical value band at 0.05 (5 %) level of significance. But it is less than the upper bound value and greater than lower band value. Upper band value is 3.646 and lower band value is 2.476. In considering the case intercept and no trend the value of ‘k’ is 6. ‘k’ is the number of forcing variables. Table F shows the results of Wald test. The F-statistic in Wald test is 3.349 which are within the critical value band. It shows that there is a long run relationship between GDP and independent variables. Estimated value of Chi-square is 20.07 which is greater than tabulated value. It shows an association between GDP per capita and independent variables of health and education. So, the null hypothesis will be rejected.
5. Conclusion and Policy Implications
5.1. Conclusion
institutions for the sake of economic growth and development in addition to a lot of structural changes specifically in health and education sector. By gaining a lot of information from this study one can get ideas, philosophies and experiences to implement the reform program to the health sector and the education sector. Policies about health sector are applicable to various public and private sector hospitals and policies regarding education sectors can apply to all types of educational institutions so that measures to improve both the sectors must be translated into practice. This study explored the change process that can apply to health and education sector to make advancements in Pakistan. It is a point of precaution that this study is limited to the considered data set only that can make improvements in health and education sector for the rise in the GDP per capita. There is a strong reflection of health and education related particular variables with economic growth and development of Pakistan, as evident from the data. Model and results developed in this research are comparatively more effective to apply in public sector health and educational institutions as compare to health and educational institutions in the private sector. More managerial efforts are required in public health and educational sectors in case of Pakistan. The concluding area of this study will serve and highlight the importance of the generalization the role of health and education sectors in the economic growth and development of Pakistan.
5.2. Policy implications
Afzal et. al. (2010), suggested that to increase literacy rates in order to achieve various economic growth and development targets. This study strongly recommended that there is an urgent need to remove the backwardness, dualism and all other problems of education and health sector.
for the rapid and sustainable economic growth. Literacy rates of Islamabad, Punjab and Sindh are desirable up to a specific level, but more focus is needed in case of Baluchistan, KPK and FATA. Rs. 20 billion has been allocated for 188 projects of HEC in Federal Budget of 2014-15. In case of health, which is very important for per capita GDP growth, it is enough to say that the government has allocated just 0.4 % (about Rs. 80 billion) of its GDP; it should also to be increased to 5 %. The level of public expenditures on health and education sectors is not up to a satisfactory level, which induces to make a comparative study about the role of private and public facilities to improve the education level and health status.
Health and education sectors of Pakistan are also facing a problem of old, less trained and inefficient staff. Government of Pakistan has allocated huge funds to develop the health sector and it is successful up to a particular level. Government is needed to develop the confidence of public on government health facilities by developing the caring attitude of its staff in the health sector. A strong coordination between young and old staff is also strongly required in order to develop the health sector of Pakistan. Provision of all contracted facilities to entire new or young staff of the health sector is compulsory in order to establish a progressive and prosperous health sector in the absence of strikes etc.
Provision of rewards, pay, status and best authorities will promote our education sector and on the other side will check the process of brain drain. In reality, a policy enables one to reach the targets by “trial and error” (Tang, 2006).
Acknowledgments
First and foremost, I would like to express my sincere gratitude to my research supervisors Prof. Dr. Muhammad Ilyas and Prof. Farooq Anwar Bajwa for the continuous support of my research work, for his excellent supervision, caring, patience, motivation, enthusiasm, immense knowledge and providing me with an excellent atmosphere for doing and completing my work. His guidance helped me in all the time of research and writing of this paper. I could not have imagined having a better advisor and mentor for my MS research study. One simply could not wish for a better or friendlier supervisor.
REFERENCES
Acemoglu, D, James Robinson, Simon Johnson. "Disease and Development in Historical Perspective." Journal of the
European Economic Association (Wiley) 1, no. 2/3 (2003):
397-405.
Afzal, Muhammad. "Relationship between school education and economic growth in Pakistan." Pakistan Economic and
Social Review (Department of Economics, University of
the Punjab) 48, no. 1 (2010): 39-60.
Agasisti, Tommaso. "The Efficiency of Public Spending on Education: an empirical comparison of EU countries."
European Journal of Education, Research, Development
and Policy 49, no. 1 (2014).
macroeconomic variables (money supply, inflation, interest rate, exchange rate, industrial production and res." African Journal of Business Management 5(27) (November 2011): 10940-10964.
Akram. "The Long Term Impact of Health on Economic Growth in Pakistan." Journal of Health, 2009: 1-17.
Analyst, Research. "The Role of Health in Economic development." Knowledge Note: MFAT staff managing
the New Zealand Aid Programme, 2011: 1-7.
Banergee. "Economic growth and regional disparities in the Slovak republic." Composition of Economic Studies, 2010: 279-403.
Barro, Robert J. "Economic growth in a Cross Section of Countries." Quarterly Journal of Economics, 1991: 407-443.
Barro, Robert J. "Health and Economic Growth." Annals of
Economics and Finance 14-2, no. A (2013): 305-342.
Basten, S, Cuaresma and Jesus Crespo. "Modelling the macroeconoic impact of future trajectories of educational development in least developed countries." International
Journal of Educational Development, 2014.
Batabyal. "Human capital use, innovation, patent protection and economic growth in multiple regions." Internation
Regional Scientific Review, 2012.
Bedia, F. and Dumont, Jean Christophe, AKA. "Health, education and economic growth: Testing for long run relationships and causal links." Applied Econometrics
and International Development, 2008: 101-113.
Benavot, Aaron. "Education, Gender, and Economic
Development: A Cross-National Study." American
Sociological Association 62, no. 1 (1989): 14-32.
Bloom. "The Effect of Health on Economic Growth: Theory and Evidence." National Bureau of Economic Research,
Bucci, Alberto. "Population, competition, innovation, and economic growth with and without human capital investment." International Review of Economics, 2014: 61-84.
Force, The Task. "Task Force on Improvement of Higher Education in Pakistan." 2002.
Giles, Dave. "ARDL Models - Part I." March 2013.
Hammond, Thompson. "Divergence and mobility in attainment across US labor market areas." Internation Regional
Scientific Review, 2010: 397-420.
Hanushek W, Eric A. and Ludger. "The Role of Education Quality in Economic Growth." World Bank Policy
Research Working Paper 4122, 2007: 1-94.
Jin, Lawrence Jin and Jang C. "Internet Education and Economic Growth: Evidence from Cross-Country Regrsssions." Economies 2 (2014): 78-94.
Kronstadt, K. Alan. "Education Reform in Pakistan." 2004. Lee. "A Longitudinal Analysis of the Impact of Health Shocks
on the Wealth of Elders." Journal of Population
Economics (Springer) 21, no. 1 (2008): 217-230.
Ljungberg, Anders Nilsson and Jonas. "Human capital and economic growth: Sweden 1870-2000." Springer-Verlag 2008, 2009: 71-95.
Mamuneas, Andreas Savvides and Thanasis Stengos. "Economic Development and the Return to Human
Capital: A Smooth Coefficient Semiparametric
Approach." Journal of Applied Econometrics (Wiley) 21, no. 1 (2006): 111-132.
Mankiw, N. Gregory, David Romer and David n. Weil. "A Contribution to the Empirics of Economic Growth."
Quarterly Journal of Economics, 2014: 407-437.
Public Expenditure Approach." World Applied Sciences
Journal, 2013: 408-413.
Muhammad, Afzal, Muhammad Shahid Farooq, Hafiz Khalil Ahmad, Ishrat Begum adn M. Abdul Quddus.
Relationship between school education and economic growth in Pakistan: ARDL Bounds Testing Approach to
Cointegration. JSTOR, 2010.
Mujahid-Mukhtar, Qaiser Abbas and Eshya. "The Role of Human Capital in Economic Growth: A Comparative Study of Pakistan and India [with Comments]." The
Pakistan Development Review (Pakistan Institute of
Development Economics, Islamabad) 39, no. 4 (2000): 451-473.
Munda, Samwel Wamalwa. "The Influence of Education Costs on Students' Academic Performance in Kenya: An Empirical Study of Bungoma County Secondary Schools." Asian Journal of Educational Research 2, no. 1 (2014): 1-11.
Musila, J W, Belassi and Walid. "The Impact of Education Expenditures on Economic Growth in Uganda: Evidence from Time Series Data." The Journal of Developing
Areas, 2004: 123-133.
Naeem, Akram, Ihtsham ul Haq Padda and Mohammad Khan. "The Long Term Impact of Health on Economic Growth
in Pakistan." The Pakistan Development Review
(Pakistan Institute of Development Economics) 47, no. 4 (2009): 487-500.
Nasir, Qaisar Abbas and Zafar Mueen. "Endogenous Growth and Human Capital: A Comparative Study of Pakistan
and Sri Lanka [with Comments]." The Pakistan
Development Review (Pakistan Institute of Development
Economics, Islamabad) 40, no. 4 (2001): 987-1007.
growth." RIT Economics Department Working Paper No.
12-06, 2012.
_______. Northern Illinois University, Rockford College, Rock Vally College, University of Illinois College of Medicine at Rockford. The Role of higher Education in Economic
Development. Alliance for the Rock River Region: NIU
Outreach, 2005.
Pakistan. Pakistan Economic Survey 2013-14. Islamabad:
Government of Pakistan, 2014.
Phillips, P. C. B., Perron,P. Testing for a Unit Root in Time
Series Regression. 1988.
Psacharopoulos, George. The contriution of education to
economic growth: International comparisons. 1984.
Punjani, Neelam. "Health Sector of Pakistan: Redefining Roles and Overcoming Challenges." 2014.
Qadri, Abdul Waheed. "Human Capital and Economic Growth: Time series evidence from Pakistan." Pakistan Business
Review, 2011: 815-833.
Startz, Richard. EViews Illustrated for Version 7. USA: University of Washington, 2009.
Tang, Tuck Cheong. "Money demand function for Southeast Asian countries, An empirical view from expenditure components." Journal of Economic Stdies, 2007: 476-496. Torre, Alberto Bucci and Davide La. "Population and economic growth with human and physical capital investments."
International Review of Economics (Springer-Verlag),
2009: 17-27.
Tsai, Chun-Li. "Human Capital Composition and Economic Growth." Social Indicatiors Research (Springer) 99, no. 1 (October 2010): 41-59.
Vila E, Bernardi Cabrer and Jose M. Pavia. "On the relationship between knowledge creation and economic performance." Technological and Economic Development
Viswanath, K. L. N. Reddy and Vishwanath Pandit. "Human Capital Contrubutions to Economic Growth in India: An Aggregate Production Function Analysis." Indian
Journal of Industrial Relations (Shri Ram Centre for
Industrial Relations and Human Resources) 44, no. 3 (2009): 473-486.
Vogl, Tom S. "Education and Health in Developing Economies."
Princeton University and NBER, 2012: 1-19.
Wasti, S. Ejaz. Pakistan Economic Survey. Islamabad: Ministry of Finance, Government of Pakistan, 2013-14.
Weil, David N. "Accounting for the Effect of Health on Economic Growth." The Quarterly Journal of Economics
(Oxford University Press) 122, no. 3 (2007): 1265-1306. WHO. Data and statistics. UNO: World Health Organization,
2014.
Woessmann, Eric A. Hanushek and Ludger. "Does better schools lead to more growth? Cognitive skills, economic outcomes, and causation." Journal of Economic Growth, 2012: 267-321.
Xie, Tongwei. "Does Regional Education Inequality Affect China's Economic Growth." International Academic
Workshop on Social Science, 2013: 348-352.
Zhuang, Chuanguo Zhang and Lihuan. "The composition of human capital and economic growth: Evidence from China using dynamic panel data analysis." China
Economic Review 22, no. 1 (2011): 165-171.
Information about Authors:
Ahsan Khan (ahsankhaneco@yahoo.com), Yasir Naveed
(yasir.naveed99@gmail.com) and Ijaz Haider