Calculation and Analysis of the Effective Electromagnetic
Parameters of Periodic Structural Radar Absorbing Material
Using Simulation and Inversion Methods
Ding Zhou1, 3, Xiaozhong Huang2, 3, *, Zuojuan Du2, 3, and Qiang Wang2, 3
Abstract—Effective electromagnetic parameters (EEPs) of periodic structures fabricated mainly by carbonyl iron powders are calculated in this paper. A method of inverting the scattering parameters obtained from simulation software was used. The effect of the absorbent volume ratio and the cycle length on EEPs was studied and analyzed. The correlation of the shapes with EEPs was also researched. The empirical formulas were proposed to calculate EEPs, in which the interaction between two adjacent cells was considered. By using this method, any material could be designed as a periodic structure with controlled EEPs, and the values of EEPs were located between the electromagnetic parameter (EP) of air and that of the original material by a specific rule. The EEPs can be used to design new absorbers as the fundamental data of electromagnetic property of some fresh materials.
1. INTRODUCTION
To enhance the radar absorptivity, much attention was paid to the composite materials [1, 2] and multi-layered methods [3, 4] for a radar absorbing materials (RAMs) designation [5]. EEPs, determined by the effective complex permittivity and effective complex permeability of a structural medium, can evaluate the response of the medium in electromagnetic field regardless of its internal structure. Therefore, the investigation on EEPs is significant for the designation and prediction of a radar absorber. Li et al. have found that absorbing property could be greatly improved via changing a traditional slab to a structure of multi-layered periodic square array [6]. However, the relationship between the structure and its EEPs has not been studied. If EEPs of the periodic structures could be well mastered, they would be easily used as the fundamental data of electromagnetic property of some fresh materials.
Many methods were presented to obtain EEPs of RAMs and to explain the mechanism. Here we classify these studies on EEPs into three types. The first type is the study on EEPs of particulate disperse system [7, 8]. These methods usually assume that the globular particles with a permittivity
ε1 are distributed in a background material εg, for example, the Rayleigh formula:
εeff−εg
εeff+2εg =f
ε1−εg
ε1+2εg, where f is the volume fraction. The second type is the study on EEPs of structural RAMs such as honeycomb structure. As reported by Smith, a finite difference time domain (FDTD) method was used to obtain EEPs of honeycomb structure in three orthogonal directions [9]. Zhang et al. adopted a finite element method (FEM), and they used the Hashin-Shtrikman (HS) theory to study the experimental EEPs of the honeycomb structure [10]. Moreover, He et al. found that EEPs could be deduced by strong fluctuation theory while honeycomb pores were regarded as circular-section fibers [11]. However, in all the methods mentioned above, the interactions between two adjacent cells were usually ignored. The
Received 5 September 2016, Accepted 27 October 2016, Scheduled 15 November 2016
* Corresponding author: Xiaozhong Huang ([email protected]).
1 Institute of Physical and Electronic, Central South University, Yuelu District, Changsha, Hunan, China. 2Institute of Aeronautics
58 Zhou et al.
last type is the study on EEPs of the double negative materials [12–14]. To obtain their EEPs values, scattering coefficients which are related to the interaction of two neighbor cells, are usually calculated using the simulation software.
We studied EEPs of the structure of periodic square array fabricated by carbonyl iron powders (CIP). The effect of the absorbent volume ratio and the cycle length on EEPs was studied and analyzed. Empirical formulas were proposed to calculate EEPs. Moreover, EEPs of any other periodic structures could be inferred by analyzing its internal interaction. Our work can provide more options to the researchers who want some new materials to design an absorber.
2. THEORY
The method to obtain EEPs of a medium based on inverting scattering coefficient was used [15]. The model was built as a square array. Then we changed the side length of the square and the cycle length of the periodic array to find how they affected the EEPs. In this theory, periodic array structure was assumed as a homogeneous slab regardless of its internal structure. Transmission coefficient S21 and
reflection coefficient S11 must be firstly obtained from simulation. According to the transmission-line
theory, S21 and S11 can be calculated by complex refractive index n and complex wave impedanceZr
based on the following formulas (1) and (2).
S11 =
i
2
1
Zr −Zr
sin(nk0p)
cos(nk0p)−
i
2
1
Zr +Zr
sin(nk0p)
(1)
S21 =
1
cos(nk0p)−
i
2
1
Zr +Zr
sin(nk0p)
(2)
where k0 = wc, n = √εr,eff ·μr,eff, Zr =
μ
r,eff
εr,eff , k0 is the wave vector, and P the thickness of the slab. Subsequently, formulas (3) and (4) show n and Zr obtained by inversing formulas (1) and (2), separately.
n = 1
k0p
±arcos
1 2S21
(1−S112 +S212 )
+ 2mπ
, m⊂N (3)
Zr = ± (1 +S11)
2−S2 21
(1−S11)2−S212
(4)
Here, a series of results would be obtained from Eq. (3) because of the multiple-valued function
arcos. A modified method of Kramers-Kronig was utilized to find the true n, since the true n often changed in different frequency bands [16, 17]. Electromagnetic parameters (EPs) of our material were both positive and continuous with varied frequency. Upon the characteristics of the original material and a small value ofp,ncould be determined whilemin formula (4) was equal to zero in any frequency. Thus, effective electromagnetic parameters would be obtained by formula (5).
εr,eff =n/Zr, ur,eff =n·Zr. (5)
3. MODEL
To findεr,eff and μr,eff,S11 and S21 must be obtained first. Software computer simulation technology
Figure 1. Schematic diagram of one cell of the model.
Figure 2. Electromagnetic parameters of absorbent.
EPs of the absorbent part were obtained from actual measurement and shown in Figure 2. Some small hollow rings were prepared as test samples in which paraffin was used to replace nylon as their permittivities were close. Then, the rings were tested and analyzed by a vector network analyzer. Using theory of transmission in coaxial line, the equipment calculated and exported EPs of the samples. Average values of EPs of the samples were calculated as the actual test values.
We obtained the model consisting of absorbent and air where the absorbent was set up as a periodic square array. S11 and S21 could be calculated by the software using the finite element method in the
frequency domain. EEPs of the model would be obtained by the method mentioned in the previous section. By changing the length of absorbent (G) and the length of cycle (L), we could get a series of structures and calculate their EEPs.
4. RESULTS
4.1. Different Volume Ratio of Absorbent
Lwas set up as an invariable, and its value was fixed at 10 mm. Then we changed the value ofGto make the volume ratio of absorbent vary from 10% to 100%. Volume ratio of absorbent was defined as “g” which was equal toG2/L2. With each value of g, we built a model, got its S11 and S21 by simulation,
calculated its EEPs by formula (5), and found how EEPs changed withg as shown in Figure 3. It can be found that EEPs of the medium decreased with the reduction ofg. As the medium consisted of two parts, absorbent and air, EEPs of the medium were changed between the EPs of the two. However, the variation of effective permittivity and effective permeability were not the same. ε and ε changed greatly whengwas large. On the other hand,μ and μwere almost in linear relation with the changes of g. These results were in accord with part of the conclusions mentioned in [11], in which EEPs of honeycomb structure were studied. It was beneficial for the purpose of surface impedance matching, becauseεr could be close to μr by changing the parameter g.
4.2. Different Length of Cycle
We set up the volume ratio of absorbentg as an invariable, 90%. Then we changed the length of cycle
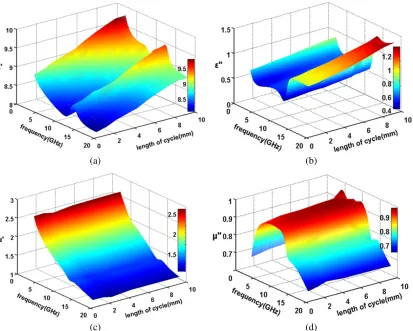
L from 1 to 10 mm. How the EEPs changed with L was shown in Figure 4. It can be seen that both
60 Zhou et al.
(d)
(a) (b)
(c)
Figure 3. EEP of mediums with different volumes ratio of absorbent. (a) Real part of permittivity with different volumes ratio of absorbent; (b) imagine part of permittivity with different volumes ratio of absorbent; (c) real part of permeability with different volumes ratio of absorbent; (d) imagine part of permeability with different volumes ratio of absorbent.
5. DISCUSSIONS
According to the above calculated results, we obtained the experimental formulas to compute the real and imagine parts of permittivity, as reflected in formulas (6) and (7).
εeff,real = εr,real 13.85
0.858×eg/0.371+ 0.668
+ (2.758×g/10)×(L−10) (6)
εeff,imagine = εr,imagine
1.78 (0.005×e
g/0.174+ 0.0853) + (0.058×g/10)×(L−10) (7)
Both formulas include two parts. The first half is an exponential function which shows the relation between the volume ration g and the permittivity (as shown in Figure 3). The second half is a linear function which shows the relation between the length of cycle and the permittivity (as shown in Figure 4). It was found that the amplitude of variation caused by changingLwould also be affected by the volume ratiog.
Because the formulas were obtained based on the data from a limited number of simulations, they were inaccurate because the real and imagine parts of permittivity of the absorbent were far away from 14 and 2. The cycle length that was more than 15 mm could also cause some errors. In addition, Equations (6) and (7) were valid in the range from 2 GHz to 18 GHz. For other cases, EEPs could be calculated by modeling the new structure using the same method.
(d)
(a) (b)
(c)
Figure 4. EEP of mediums with different length of cycle. (a) Real part of permittivity with different length of cycle; (b) imagine part of permittivity with different length of cycle; (c) real part of permeability with different length of cycle; (d) imagine part of permeability with different length of cycle.
from [11]. Equations (9) and (10) were upper and lower bound formulas from HS theory, which were often used to evaluate the critical EEPs of a composite material.
εe = 1 2
(1−2g) (1−εr) +
(1−2g)2(1−εr)2+ 4εr
(8)
εe,HS−U = g2−g+g·εr
+ (2−g)·εr ·εr (9)
εe,HS−L = (1 +g)·εr+ (1−g)
(1−g)·εr+ (1 +g) (10)
In Equations (8), (9) and (10), the effective permittivity depends on the volume ration alone. Figure 5 shows the data calculated based on these equations and ours when the cycle length is set as 10 mm and 5 mm.
62 Zhou et al.
(a) (b)
Figure 5. The comparison of experimental formula and other equations. (a) Real part of effective permittivity withg; (b) imagine part of effective permittivity with g.
(a) (b)
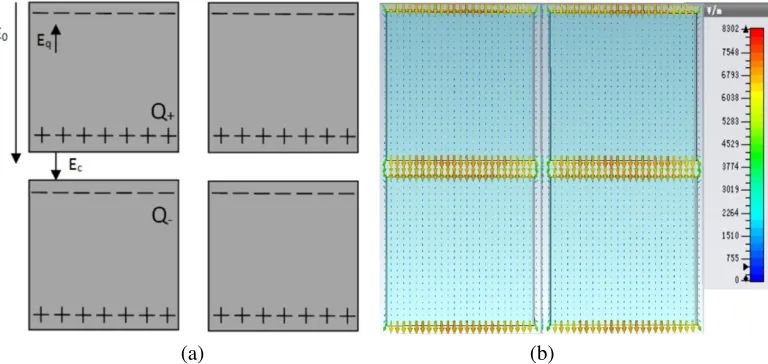
Figure 6. Electric field and electric capacity coupling. (a) Schematic of the physical model; (b) electric field distribution from simulation.
As shown in Figure 6(a), in the first square, the two boundaries perpendicular to applied electric fieldE have different polarized charges Q+ and Q. It means that the nearest boundaries of two squares
The comparison of effective permeabilities obtained by other formulas and the experimental formula was shown in Figure 7. It can be seen that the effective permeabilities calculated using those methods were almost the same. The results shown in Figure 7 imply that the magnetic coupling may be weak. The maximum magnetic field strength still appeared in the gap between two squares, but its value was 7.89 A/M. The maximum magnetic field strength of the applied magnetic field was 5.15 A/M. The enhancement of magnetic field was quite small compared with that of electric field.
In conclusion, when the value of “g” was large, and permittivity or permeability was large, the
Figure 7. Comparison of effective permeabilities calculated by using different methods.
(c) (a)
(b)
64 Zhou et al.
interaction between two adjacent cells could not be ignored, and our proposed formulas could be used to obtain accurate value of EEPs. When the value of “g” was small, and permittivity or permeability was small, EEPs obtained by those methods would be almost the same as shown in Figure 7.
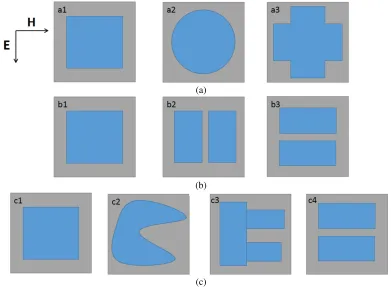
By analyzing the interaction in interior structure, EEPs of other structures can be estimated. As shown in Figure 8(a), we changed the square to other shapes such as round and cross with the same g
(a)
(c) (b)
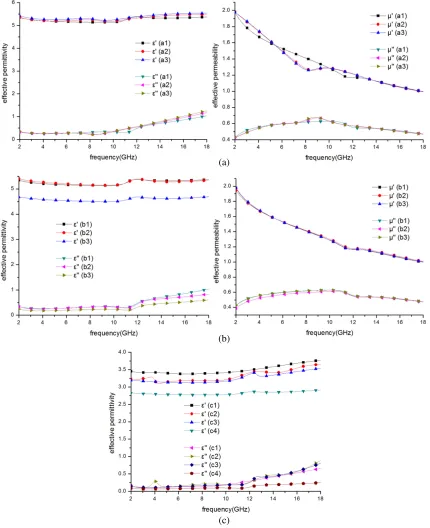
and L, and calculated their EEPs. It was found that EEPs of these structures were almost the same, as shown in Figure 9(a). It may be because the total interaction was unchanged.
In Figure 8(b), when we divided one square to two rectangles with the cutting face perpendicular to the magnetic field direction (b1 to b2), the EEPs were barely changed. However, when we divided one square to two rectangles with the cutting face perpendicular to the electric field direction (b1 to
b3), the value of permittivity became smaller while the value of permeability was still not changed, as shown in Figure 9(b).
Therefore, under the condition of a lager permittivity, we could give an inference: in one cell, the more the gaps with cutting face perpendicular to the electric field direction existed, the lower the effective permittivity would be. For an irregular shape such as “c2” in Figure 8(c), it can simplified to “c3”, and we found that the permittivity remained almost the same along with the transformation. Moreover, we found that the permittivity of “c3” was smaller than that of “c1” but bigger than that of “c4”. The results are shown in Figure 9(c) which proves our inference.
6. CONCLUSION
EEPs of carbonyl iron powder designed as periodic square array were calculated using the methods of simulation and inverting the scattering parameters. The effect of the absorbent volume ratio and the cycle length on EEPs was studied. According to the obtained results, the empirical formulas to calculate EEPs of the periodic structure were proposed. By analyzing the interaction inside a cell and between two cells, EEPs of other different shapes could be evaluated. The gaps with cutting face perpendicular to the electric field direction would lead to smaller effective permittivity. Using this method, we could obtain a series of EEPs from one material. These EEPs can be regarded as the fundamental data of electromagnetic property of some fresh materials to design new absorbers.
REFERENCES
1. Choi, I., D. Y. Lee, and D. G. Lee, “Radar absorbing composite structures dispersed with nano-conductive particles,” Compos. Struct., Vol. 122, 23, 2015.
2. Li, Y. N., T. Wu, K. Y. Jin, Y. Qian, N. X. Qian, K. D. Jiang, W. H. Wu, and G. X. Tong, “Controllable synthesis and enhanced microwave absorbing properties of Fe3O4/NiFe2O4/Ni heterostructure porous rods,”Appl. Surf. Sci., Vol. 387, 190, 2016.
3. Lee, S. E., W. J. Lee, K. S. Oh, and C. G. Kim, “Broadband all fiber-reinforced composite radar absorbing structure integrated by inductive frequency selective carbon fiber fabric and carbon-nanotube-loaded glass fabrics,”Carbon, Vol. 107, 564, 2016.
4. Eun, S. W., W. H. Choi, H. K. Jang, J. H. Shin, J. B. Kim, and C. G. Kim, “Effect of delamination on the electromagnetic wave absorbing performance of radar absorbing structures,”Compos. Sci. Technol., Vol. 116, 18, 2015.
5. Liu, S. H., Electromagnetic Shielding and Radar Absorbing Material, 286–332, Chemistry Industry Press, Beijing, 2013.
6. Li, W., T. L. Wu, W. Wang, P. C. Zhai, and J. G. Guan, “Integrating non-planar metamaterials with magnetic absorbing materials to yield ultra-broadband microwave hybrid absorbers,”J. Appl. Phys., Vol. 116, 044110, 2014.
7. Giordano, S., “Effective medium theory for dispersions of dielectric ellipsoids,” J. Electrostat., Vol. 58, 59, 2003.
8. Wu, M. Z., H. J. Zhang, and X. Yao, “Microwave characterization of ferrite particles,”J. Phys. D: Appl. Phys., Vol. 34, 889, 2001.
9. Smith, F. C., “Effective permittivity of dielectric honeycombs,”IET Microw. Antenna. P, Vol. 146, 55, 1999.
66 Zhou et al.
11. He, Y. F., R. Z. Gong, X. Wang, and Q. Zhao, “Study on equivalent electromagnetic parameters and absorbing properties of honeycomb-structured absorbing materials,” Acta. Physica. Sinica, Vol. 57, 5261, 2008.
12. Hasar, U. C., J. J. Barroso, C. Sabah, Y. Kaya, and M. Ertugrul, “Differential uncertainty analysis for evaluation the accuracy of S-parameter retrieval methods for electromagnetic properties of metamaterial slabs,” Opt. Express, Vol. 20, 29002, 2012.
13. Hasar, U. C., J. J. Barroso, C. Sabah, I. Y. Ozbek, Y. Kaya, D. Dal, and T. Aydin, “Retrieval of effective electromagnetic parameters of isotropic metamaterials using reference-plane invariant expressions,”Progress In Electromagnetics Research, Vol. 132, 425, 2012.
14. Smith, D. R., S. Schultz, P. Markos, and C. M. Soukoulis, “Determination of effective permittivity and permeability of metamaterials from reflection and transmission coefficients,” Phys. Rev. B, Vol. 65, 195104, 2002.
15. Smith, D. R., D. C. Vier, Th. Koschny, and C. M. Soukoulis, “Electromagnetic parameter retrieval from inhomogeneous metamaterials,” Phys. Rev. E, Vol. 71, 036617, 2005.
16. Akyurtlu, A. and A. G. Kussow, “Relationship between the Kramers-Kronig relations and negative index of refraction,” Phys. Rev. A, Vol. 82, 055802, 2010.
17. Peiponen, K.-E. and J. J. Saarinen, “Generalized KramersKronig relations in nonlinear optical-and THz-spectroscopy,” Rep. Prog. Phys., Vol. 72, 056401, 2009.