Window Subtracted Wave Band Selection Method
for the FTIR/ATR Spectrum Analysis
Jun Xie1, Han Zhang1, Jianfeng Li2, and Fuhong Cai1, *
Abstract—The rapid quantification method of human serum glucose was established by using the Fourier transform infrared spectroscopy (FTIR) and attenuated total reflection (ATR). Based on the optimal predicting effect, a subtraction band model combining with optimal single continuous wave band was developed. The spectrum (1600–900 cm−1) was selected as the base band. Then, window subtracted partial least squares (WSPLS) based on the spectrum was carried out, and the optimal two continuous bands were found. The results show that the prediction effect of the base band model is obviously better than that of the whole spectral model, and WSPLS model is even better than base band model. Finally, an independent test set was tested for model verification. V-SEP and V-RP were 0.831 mmol/L and 0.882, respectively by the compensation model.
1. INTRODUCTION
Infrared spectroscopy is an effective analysis technology for determination of structure of matter and materials. It is an online, real-time, in-situ determination of the quantitative analysis methods. It has the advantages of short measurement time, high accuracy, non-destructive testing and continuous determination. Fourier transform infrared spectroscopy (FTIR) and attenuated total reflection (ATR) infrared spectroscopy [1–4] have wide application in the measurement of the quality of agricultural products and food [5–10], cell metabolism measurement [5], and enzyme activity analysis [6]. For example, data from FTIR/ATR could quantify corn syrup, high fructose syrup, and inverted sugar in Mexican honey when optimal calibrations were performed with partial least squares (PLS) [7].
Human blood is a complex multi-ingredients system. Using FTIR/ATR technology to directly measure blood components needs to overcome many difficulties. Prediction accuracy by the spectra of various components in the blood content has not reached the level of clinical application [10–15]. Spectral modeling optimization of human blood spectrum is one of the most important research fields. Partial least squares (PLS) regression is a statistical method that bears some relation to principal components regression. Instead of finding hyper planes of maximum variance between the response and independent variables, it finds a linear regression model by projecting the predicted variables and the observable variables to a new space. Because both independent variables and dependent variables are projected to new spaces, the PLS family of methods are known as bi-linear factor models [16–19].
PLS has been most widely used in the spectral analysis of model calibration. It is better than multiple linear regression, which often incurs collinearity, and better than principal component regression which is a spectral matrix decomposition to eliminate noise faults. PLS is also popularly adopted for comprehensively screening spectroscopic data, extracting information variables and overcoming spectral co-linearity. PLS factor is an important parameter, corresponding to the number of spectral integrated variables on behalf of sample information. If the PLS factor was set too small, the sample information
Received 7 November 2017, Accepted 16 April 2018, Scheduled 2 May 2018 * Corresponding author: Fuhong Cai ([email protected]).
in the spectra could not be fully used, and the model accuracy would be decreased. However, in case that the PLS factor was set too big, noises would be led into the model, and the prediction ability would be decreased too. Therefore, it is very necessary to select a reasonable PLS factor.
Besides PLS factor, wave band selection is also necessary because the prediction effect of PLS is difficult to improve when the signal-to-noise ratio (SNR) of the wave band is relatively low. The spectroscopic analysis of a single blood component requires mitigating the interference of other components and noise. Improving prediction effect, reducing model complexity and designing specialized spectrometers with high SNR are all important. Therefore, appropriate chemometric methods are necessary for wave band optimization [20, 21].
Moving window partial least squares (MWPLS) [14] is a commonly utilized continuous wavelength selection method. The best single band model can be chosen by MWPLS.
A direct and fast quantitative analysis method of blood glucose was established by FTIR/ATR technology in the present study. At first, the special spectrum was selected as the base band. Second, window subtracted partial least squares (WSPLS) was carried out based on the special spectrum. Then, the best two single continuous bands were found. Finally, the independent test set was tested for model verification.
2. EXPERIMENTAL AND METHODS
2.1. Experimental Materials, Instruments, and Measurement Methods
One hundred and eighty-six human serum samples were collected. Glucose concentration of the samples was measured by routine clinical method with BC-3000Plus automatic blood cell analyzer (Shenzhen Mairea Company). Glucose concentration ranged from 4.09 to 17.82 mmol/L, and the mean values and standard deviations were 6.33 and 2.31 mmol/L, respectively. The instrument used for the experiment was a VERTEX 70 FTIR spectrometer (BRUKER Company) equipped with a KBr beam splitter and a deuterated triglycine sulfate KBr detector. The scanning scope of the spectrum was 4000–600 cm−1 with a horizontal ATR sampling accessory with a diamond internal reflection element on a ZnSe crystal (SPECAC Company, 45◦ angle of incidence, 3 times reflective). Each sample was measured three times, and the mean value of the three measurements was used for modeling. The spectra were measured at 22◦C±1◦C and 41%±1% RH.
Model Evaluation Indicators and Division Method for Sample Sets
Sixty-two samples were randomly selected from all 186 samples as the validation set; the remaining 124 samples were grouped as the modeling set. The modeling set was divided into similar calibration set (84 samples) and prediction set (40 samples) for a total of 20 times. For each divisioni, modeling root mean square error of prediction and modeling correlation coefficients of prediction were denoted as M-SEPiand M-RP,i, respectively. Their mean values and standard deviations for all divisions were denoted as M-SEPAve, M-RP,Ave, M-SEPStd, and M-RP,Std, respectively, serving as the basis for discussing the prediction accuracy and stability of the modeling. The model parameters were selected according to the minimum M-SEPAve. Finally, the selected model was validated in the validation set, and the validation root mean square error of prediction and validation correlation coefficients of prediction were calculated and denoted by V-SEP and V-RP, respectively.
The similarity of the sample sets was defined by the predictive bias of cross-validation (leave-one-out mode) for PLS model based on the whole spectral region. The predictive bias of each sample was calculated and is called Partial Least Square Cross-validation Predictive Bias, denoted by PLSPB. If the mean value and standard deviation of PLSPB in calibration set were close to those in prediction set, the calibration set and prediction set were defined similar.
2.2. WSPLS Method
A window is moving by any position and any length in a continuous band. The window band is cut off, and the remaining two bands are retained. The PLS model was established by the two remaining bands. The variable parameters were as follows: (1) beginning wavenumber (BW) or its serial number, (2) number of wavenumbers (NW), and (3) PLS factor (F). In order to reduce the number of model. An initial band was selected as the original searching band. The searching range for the WSPLS method in the current work was from 1600 to 900 cm−1, and the number of wavenumbers was 364 (defined as NWA). The serial numbers of the BW were set from 1 to NWA. NW was set from 1 consecutively to NWA. In addition, F was set from 1 to 20. To consider predictive effects corresponding to different wave band positions, BW was fixed, and the remaining parameters (NW and F) were arbitrarily changed. The local optimal model corresponding to the BW was selected according to the minimum M-SEPAve. Meanwhile, in considering predictive effects corresponding to different wave band lengths, NW was fixed, and the remaining parameters (BW and F) were changed arbitrarily. The local optimal model corresponding to the NW was also selected according to the minimum SEPAve. The global optimal band and local optimal band corresponding to every parameter were both obtained simultaneously. The above algorithm platform was built by us by R software version 3.2.5.
3. RESULTS AND DISCUSSION
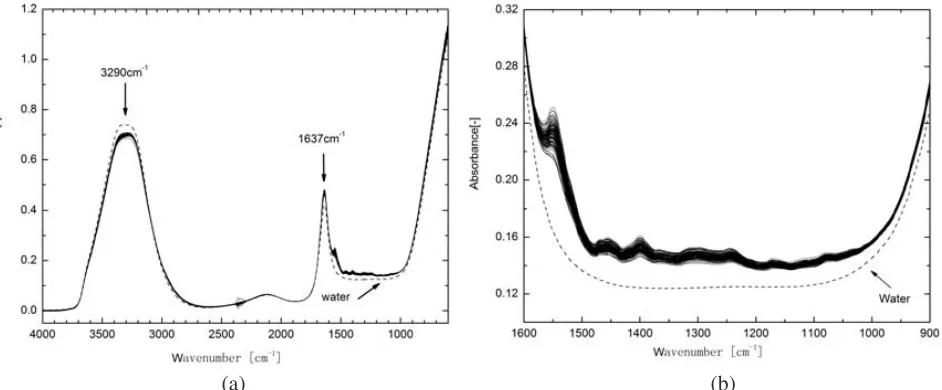
FTIR/ATR spectra of 186 serum samples and 3 deionized water samples were shown in Figure 1(a). Spectra heavily overlap each other. And it is impossible to distinguish them.
(a) (b)
Figure 1. (a) FTIR/ATR spectra of 186 human serum samples. (b) FTIR/ATR spectra in band 1600–900 cm−1.
The band 2400–2300 cm−1 is a blind area of VERTEX 70 FTIR spectrometer, and the curves are abnormal. However, it will not affect the research because spectra near 2350 cm−1 are often eliminated. There is a strong absorption of water molecules near the band 1637 cm−1. The spectra of band 1600– 900 cm−1 were magnified and shown in Figure 1(b). It was obvious that the spectra of different samples are very different. Model optimization was implemented mainly in this band.
Table 1. Distribution of chemical values in the calibration set and the prediction set (unit: mmol/L).
min max mean Standard deviation Calibration set 4.09 17.82 6.34 2.34
One hundred and twenty-four samples were used as the calibration set for modeling, and the remaining 62 samples which are completely independent of the modeling samples were used to test the model. Chemical value distributions of the calibration set and prediction set are indicated in Table 1 which shows that the range of the prediction set is within the range of the calibration set.
The M-SEPAveof the local optimal model for each BW and each NW are shown in Figure 2(a) and Figure 2(b), respectively.
(a) (b)
Figure 2. (a) The optimal M-SEPAve for each beginning wavenumber. (b) The optimal M-SEPAve for each number of wavenumbers.
For the global optimal model, the corresponding B, N, F, M-SEPAve, M-RP,Ave were 1555 cm−1, 88, 12, 0.741 mmol/L and 0.924, respectively. Thus, the band 1555–1387 cm−1 was eliminated. The corresponding remaining wave bands were the combination of bands 1600–1556 cm−1 and 1385– 900 cm−1.
The prediction effect, stabilities of the optimal model and whole region model are summarized in Table 2. The results showed that the optimal model was obviously better than the whole region model, and number of wavenumbers was reduced greatly. The WSPLS model has been further improved.
The model based on the combination bands 1600–1556 cm−1 and 1385–900 cm−1 was validated by the validation set.
Table 2. Comparison of three bands.
band (cm−1) window width factor M-SEPAve (mmol/L) M-RPAve
4500–600 2022 18 1.609 0.741
1600–900 364 14 0.918 0.896
1600–1556 and 1385–900 276 12 0.741 0.924
The PLS regression coefficients corresponding to all wavenumbers were calculated by using the data of the modeling set when F was the optimal value 12. The PLS regression coefficients are shown in Figure 3.
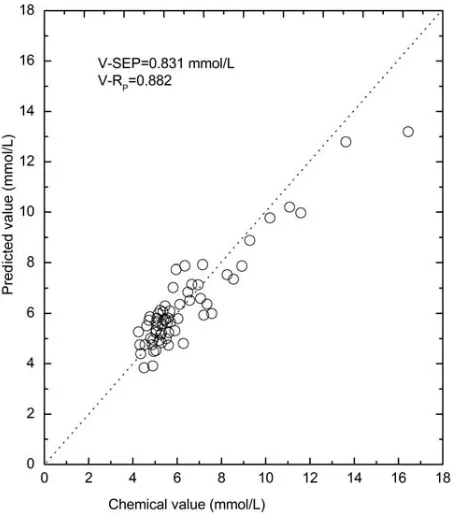
Then, the predicted glucose values of the validation samples were calculated using the obtained PLS regression coefficients and the spectra of validation samples. The relationship between the predicted values and chemical values of glucose for 62 validation samples is shown in Figure 4. The V-SEP and V-RP are 0.831 mmol/L and 0.882, respectively, which show a rather good validation effect.
Figure 4. Relationship between the predicted values and the chemical values of glucose for the validation samples.
4. CONCLUSIONS
ACKNOWLEDGMENT
This work was financially supported by the Natural Science Foundation of Hainan Province (No. 417087), the Science and Research Project of Hainan Province Education Department (No. Hnky2015-1), and the Research Fund for Advanced Talents of Hainan University (No. kyqd1577).
REFERENCES
1. Saguer, E., P. A. Alvarez, and J. Sedman, “Study of denaturation/aggregation behaviour of whole porcine plasma and its protein fractions during heating under acidic pH by variable-temperature FTIR,” Food Hydrocolloids, Vol. 33, 202–209, 2013.
2. Engel, J., G. J. Postma, and I. van Peufflik, “Pseudo-sample trajectories for variable interaction detection in Dissimilarity Partial Least Squares,”Chemometrics and Intelligent Laboratory Systems, Vol. 146, 89–101, 2015.
3. Gurbanov, R., M. Bilgin, and F. Severcan, “Restoring effect of selenium on the molecular content, structure and fluidity of diabetic rat kidney brush border cell membrane,”Biochimica et Biophysica Acta, Vol. 1858, 845–854, 2016.
4. Boll, M. S., K. C. Doty, and R. Wickenheiser, “Differentiation of hair using ATR FT-IR spectroscopy: A statistical classification of dyed and non-dyed hairs,” Forensic Chemistry, Vol. 6, 1–9, 2017.
5. Nunes, K. M., M. V. O. Andrade, A. M. P. Santos Filho, M. C. Lasmar, and M. M. Sena, Food Chemistry, Vol. 205, 14–22, 2016.
6. Anjos, O., M. G. Campos, P. C. Ruiz, and P. Antunes, “Application of FTIR-ATR spectroscopy to the quantification of sugar in hone,”Food Chemistry, Vol. 169, 218–223, 2015.
7. Gallardo-Velazquez, T., G. Osorio-Revilla, M. Zu˜niga-de Loa, and Y. Rivera-Espinoza, “Application of FTIR-HATR spectroscopy and multivariate analysis to the quantification of adulterants in Mexican honeys,”Food Research International, Vol. 42, 313–318, 2009.
8. Bozkurt, O., M. Severcan, and F. Severcan, “Diabetes induces compositional, structural and functional alterations on rat skeletal soleus muscle revealed by FTIR spectroscopy: A comparative study with EDL muscle,” Analyst, Vol. 135, 3110–3119, 2010.
9. Rios-Corripio, M. A., M. Rojas-Lopez, and R. Delgado-Macuil, “Analysis of adulteration in honey with standard sugar solutions and syrups using attenuated total reflectance-Fourier transform infrared spectroscopy and multivariate methods,”CyTA Journal of Food, Vol. 10, 119–122, 2012. 10. Salman, A., I. Lapidot, A. Pomerantz, L. Tsror, Z. Hammody, R. M. Huleihel, and S. Mordechai,
Spectroscopy — An International Journal, Vol. 24, 261–267, 2010.
11. Sarraguca, M. C., A. Paulo, M. M. Alves, A. M. A. Dias, J. A. Lopes, and E. C. Ferreira,Analytical and Bioanalytical Chemistry, Vol. 395, 1159–1166, 2009.
12. Ostrovsky, E., U. Zelig, I. Gusakova, S. Ariad, S. Mordechai, I. Nisky, and J. Kapilushnik, “Detection of cancer using advanced computerized analysis of infrared spectra of peripheral blood,”
IEEE Trans. Biomed. Eng., Vol. 60, 343–353, 2013.
13. Ghiaci, M., M. Tghizadeh, A. A. Ensafi, N. Zandi-Atashbar, and B. Rezaei, Journal of the Taiwan Institute of Chemical Engineers, Vol. 63, 39–45, 2016.
14. Jiang, J. H., R. J. Berry, H. W. Siesler, and Y. Ozak, “Wavelength interval selection in multicomponent spectral analysis by moving window partial least-squares regression with applications to mid-infrared and near-infrared spectroscopic,”Analytical Chemistry, Vol. 74, 3555– 3565, 2002.
15. Cheng, F., V. Dupont, and M. V. Twigg, “Temperature-programmed reduction of nickel steam reformingcatalyst with glucose,”Applied Catalysis A: General, Vol. 527, 1–8, 2016.
17. Tenenhaus, M., V. Esposito Vinzi, Y.-M. Chatelinc, and C. Lauro, “PLS path modeling,”
Computational Statistics & Data Analysis, Vol. 48, 159–205, 2004.
18. Liu, Y. F., X. Chen, B. Zheng, Z. Y. Xu, and G. T. He, “Detection of the contents of the ingredient of food by using the NIR spectroscopy and the backward interval partial least-squares,” Advanced Materials Research, Vol. 726, 4337–4341, 2013.
19. Montgomery, D. C. and G. C. Runger,Applied Statistics and Probability for Engineers, Wiley, New York, 2003.
20. Chen, H., T. Pan, J. Chen, and Q. Lu, “Waveband selection for NIR spectroscopy analysis of soil organic matter based on SG smoothing and MWPLS methods,”Chemometrics and Intelligent Laboratory Systems, Vol. 107, 139–146, 2011.