Feed Matching Improvement for Center Fed Reflectarray
Muhammad M. Tahseen* and Ahmed A. Kishk
Abstract—Standing wave between the feed and the reflectarray (RA) deteriorates the matching and antenna gain. A phase perturbation method is investigated to improve the matching of the antenna. The proposed method requires a change or deformation of the RA area facing the feed. A small circularly polarized reflectarray (CPRA) is used as an example. The reflectarray size is 6.25λ×6.25λ, which is corresponding to 25×25 elements. The feed is circularly polarized (CP) with aperture diameter 1.2×λ. The proposed method provides an acceptable compromise between achieving the matching and gain reduction. The field distribution on the symmetric line between the RA center and the feed is observed to show the behavior of the standing wave before and after implementing the proposed technique. The measured return loss becomes better than 10 dB, and a gain reduction is 0.2 dB. A measured maximum aperture efficiency of 55.4%, a 1-dB gain bandwidth of better than 33%, and the 1.5-dB axial ratio bandwidth of 33.2% are achieved.
1. INTRODUCTION
Parabolic reflectors and array antennas have been used extensively for long distance communication. Due to the bulky size, fabrication complexity in curved surface and the smaller beam scanning ability of the parabolic reflectors, reflectarrays (RAs) are recently introduced as an alternative antenna that combines the advantages of reflectors and arrays. RA is lighter weight, has a less fabrication complexity due to the planar surface, has wider scanning capability and has low cost [1].
RA consists of an array of elements, which are subject to reflect a preadjusted phase accounted for the spatial delay in collimating the energy to a specified direction. Several methods have been proposed to accomplish the phase compensation. For linear polarization, varying element size [2], stacked patches with variable length [3], multi-resonant dipoles [4], and disk elements attached to phase-delay lines [5] are used. For circular polarization (CP), an element rotation technique is used [6]. For dual-band RA design, a slotted circular ring with phase delay transmission line element working in the C-band is implemented, while a slotted circular ring element for the Ka-band is presented, in [7]. Broadband circularly polarized RA (CPRA) has been designed in [8], using cross-bowtie elements while element rotation technique was applied to phase compensation. In the center fed RA, standing waves are generated between the feed and the RA due to multiple reflections of the trapped waves. These standing waves reduce the feed matching level and bandwidth.
In this paper, assuming that the critical area in the RA that interacts with the feed is the area facing the feed, a phase perturbation technique is proposed to improve the feed matching. A study of the field behavior between RA and feed is performed on the central line between RA and feed. The RA performance in terms of feed reflection coefficient and antenna gain is presented and compared with the original RA.
Figure 1. Sketch of the RA principle.
2. CPRA MODEL AND PHASE PERTURBATION METHOD
The fundamental principle of the RA is to convert the incident field with spherical to planar wavefront, in the transmit mode, while converting back the planar wavefront to the spherical one in the receiving mode working on the principle of focusing energy to the focal point, as shown in Figure 1.
2.1. The Element Design
The 0.25λ cross bowtie element illustrated in Figure 8 is analyzed by the CST microwave studio, at 30 GHz. The comprehensive analysis on the element performance is presented in [8]. The sub-wavelength elements are used to broaden the bandwidth. The denser or closer the elements are, the more phase compensation is required at each location, which results in a smoother phase variation and smaller phase errors in the scattered field, resulting in improved overall antenna performance. Thus, sub-wavelength 0.25λunitcell is used, instead of conventional 0.5λelements. The elements are printed on a cheap FR-4 substrate with dielectric constant 4.5, loss tangent 0.02, and thickness 0.8128 mm. FR-4 substrates are not usually recommended for this frequency band due to their high losses. The reflection phase characteristic is obtained from the unitcell analysis in a periodic environment alongx- andy-directions to compensate for the spatial delay at the RA surface. A left-hand circularly polarized (LHCP) plane wave normal incidence is used. Due to the presence of a GND plane at the back, the reflected wave is RHCP, which is considered as the co-polar component and should be maximized while the LHCP wave component is minimized. The element is designed on the principle of creating a circular polarization between two orthogonal electric field components with 90◦ degrees phase difference between them. The vertical to horizontal cross-bowtie lengths are used in creating circular polarization. The cross-bowtie length ratio of the shorter to the longer is chosen optimum at 0.6. Before rotation, the co- and cross-polar (x-pol) wave component magnitudes versus frequency are shown in Figure 2. It is evident from the plot that the unitcell has a tendency to operate in a wideband providing small losses in the whole operating band. The element rotation technique is used to compensate for the spatial delay at each element. The cross-bowtie element is rotated in counter clockwise (CCW). The reflected amplitude and phase curve are obtained with element rotation, and results are shown in Figure 3. The results indicate that the linear reflected wave phase curve is achieved, which provides wider CPRA bandwidth while the amplitude losses are very small at all rotation angles [8].
2.2. The Reflectarray Model (Reference RA Performance)
26 28 30 32 34 36 38 -40 -35 -30 -25 -20 -15 -10 -5 0 Frequency (GHz)
Co- and X-pol. Reflection (dB)
LCPLCP RCPLCP
Figure 2. Co-polar and cross polar components versus frequency of the simulated cross-Bowtie element.
0 50 100 150
-0.21 -0.18 -0.15 -0.12 -0.09 -0.06 -0.03 0
Rotation Angle (degrees)
Reflection Coefficient (dB)
0 50 100 150 0
60 120 180 240 300 360 420
Reflected Phase (degrees)
Figure 3. Simulated reflected wave amplitude and phase vs cross-Bowtie rotation at 30 GHz.
26 28 30 32 34 36 38
-40 -35 -30 -25 -20 -15 -10 -5 0 Frequency (GHz)
Reflection Coefficient (dB)
S11(dB) S21(dB)
Figure 4. Ports reflection and isolation of simulated CP feed performance.
26 28 30 32 34 36 38
-3 -2 -1 0 1 2 3 Frequency (GHz)
Phase Center (mm)
Phase Center variation
Figure 5. Phase center location from feed aperture of the simulated CP feed.
aperture. The feed contains two ports for supporting both polarizations (LHCP/RHCP) to transmit or receive. The feed dimensions are given in [8]. The feed port reflection and isolation, phase center variation, axial ratio versus frequency, and co- andx-pol components in the radiation pattern for Y Z (φ = 90◦) and XZ (φ = 0◦) plane are shown in Figure 4 to Figure 7. First, the CPRA is designed based on the phase requirements [8] and used as a reference to evaluate the method used to improve matching (Reference RA). The feed is located at the focal point withf/D= 0.59. The proposed phase perturbation principle is explained in detail in the upcoming section.
2.3. Phase Perturbation Method
Phase perturbation is used to the elements facing the feed, to reduce the standing wave between them. In this case, it is desired to perturb the phase reflection towards the feed to reduce the standing wave ratio. The CPRA prototype with the proposed method is shown in Figure 8. The analysis is with respect to two parameters: the perturbed area and perturbed element angle. The minimum central element arrays of the area of 7.5 mm and 12.5 mm (which is equal to 3×3, and 5×5) are considered in the analysis, while it is important to mention that 12.5 mm (5×5 central RA elements) is equivalent to the feed aperture diameter. The effects on the matching and gain are compared with the original CPRA.
26 28 30 32 34 36 38 0
2 4 6 8 10
Frequency (GHz)
Axial Ratio (dB)
Frequency vs. Axial Ratio
Figure 6. Axial ratio of the simulated CP feed.
-50 0 50
-40 -35 -30 -25 -20 -15 -10 -5 0
Θ (Deg)
Radiation Pattern (dB)
RHCP φ=90 RHCP φ=0 LHCP φ=90 LHCP φ=0
Figure 7. Normalized radiation pattern in XZ andY Z plane at 30 GHz of the simulated CP feed.
Figure 8. A prototype of Ka-Band CPRA with proposed technique along a photo of the CPRA with a zoom on the feed blocked are with 5 × 5 central elements perturbed from the original rotation by 30◦.
Figure 9. Simulated reflection coefficient comparison, of the various perturbed angles for 3×3 elements.
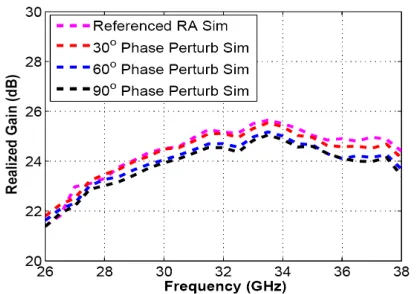
Figure 10. Simulated gain comparison, of the various perturbed angles for 3×3 elements.
Figure 12. Simulated gain comparison, of the various perturbed angles for 5×5 elements.
Figure 13. Simulated and measured axial ratio comparison of the RA compared with the reference and the phase perturbed antenna.
Figure 14. Radiation pattern for Y Z (φ= 90◦) plane for the reference RA, and the RA with implementing 30◦ phase perturbation at 30 GHz.
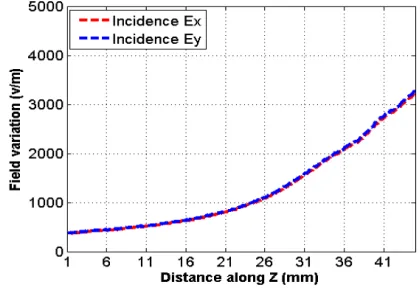
Figure 15. Simulated standing waves analysis along the focal distance for incident electric field
x- and y-components.
coefficient minimization while the minimum gain drop is 0.1 dB. The gain versus frequency for the phase perturbation to 3×3 central elements is shown in Figure 10. The same analysis is repeated for a 5×5 central elements (equivalent to the feed aperture diameter) for different perturbation angles where the simulated and measured results are shown in Figure 11 and Figure 12. To keep small effect on the gain, we recommend using the 5×5 element case with 30◦ perturbation. As the 60◦ perturbation shows much better matching, a significant gain reduction is observed. So, here we make a compromise by satisfying a minimum 10 dB return loss and keeping smaller gain loss.
size of (6.25λ×6.25λ) is 1.18λ, which is close to the true time delay phase compensation (1.0λ). The true time delay phase compensation method is used to widen the RA bandwidth, while the path loss variation in the presented RA is close to that in the true time delay case. Therefore, the measured broadband performance of the antenna makes sense. As the RA size increases, the path loss variation also increases accordingly due to the dominant spatial delay factor that hinders in wider RA bandwidth. The performance comparison between the reference RA and proposed RA, with 30◦ perturbation to the 5×5 central elements, is shown in Table 1.
Table 1. Performance Comparison of Reference and Proposed RA Antenna (at 30 GHz).
Measured Gain
(dB)
Gain BW (1-dB%)
Matching BW (10-dB%)
ap
(%) Reference RA
(w/o Phase Perturbation) 24.47 32.21 12.5 (Avg) 57 Proposed RA
(30◦ Phase Perturbation) 24.28 32.82 33.4 55.4
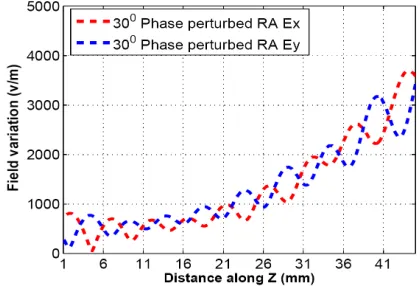
For a deeper understanding, we look at the field distribution on the central line between the RA and the feed. This will allow us to observe the field variation in a standing waveform. The simulated magnitude of the x- and y-components of the incident electric field along the central line is shown in Figure 15. The standing waves generated from the reference RA (before perturbation and after perturbation) are shown in Figure 16 and Figure 17, respectively. The phase difference in the x- and
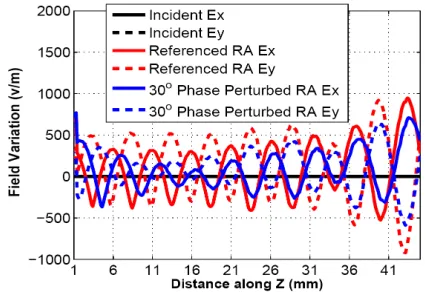
y-components, between the incident field and the fields generated by the reference RA, is shown in Figure 18, which depicts that the phase difference variation along the line, and in this case, it is less than 40◦. Similarly, the same fields in terms of co-(RHCP) andx-polar (LHCP) components are shown in Figure 19 to Figure 21. The phase difference inx- andy-components between the incident field and the fields generated by the proposed RA where 30◦ perturbation is applied in the central blocked area of 5×5, is shown in Figure 22, which depicts that the phase difference variation along the line is reduced and varied in less than 30◦. These field components are compared with the incident fields, to observe the field change before and after perturbation, as shown in Figure 23. It is evident from these results that implementing the proposed phase perturbation technique in the blocked area in RA reduces not only the scattered field’s amplitude but also the phase difference between scattered field wave components, which as a result improves the feed matching. The field data obtained from the above field analysis are
Figure 16. Simulated standing waves analysis along the focal distance for scattered electric field
x- and y-components of the reference RA (before performing phase perturbation).
Figure 18. Simulated standing waves analysis along the focal distance for phase difference variation in electric field x- and y-components of the reference RA.
Figure 19. Simulated standing waves analysis along the focal distance for incident electric field RHCP and LHCP components.
Figure 20. Simulated standing waves analysis along the focal distance for scattered electric field RHCP and LHCP components of the reference RA (before implementing phase perturbation).
Figure 21. Simulated standing waves analysis along the focal distance for scattered electric field RHCP and LHCP components of the reference RA (after implementing phase perturbation).
Figure 22. Simulated standing waves analysis along the focal distance for phase difference variation in electric field x- and y-components of the proposed RA.
Table 2. VSWR and reflection coefficient Comparison of Reference and Proposed RA (at Focal Point 37 mm).
VSWR (dB)
VSWR (Linear)
|Γ|
(Linear)
|Γ|
(dB) Reference RA
(w/o Phase Perturbation) 5.2 1.83 0.29 −10.7 Proposed RA
(30◦ Phase Perturbation) 3.03 1.41 0.17 −15.3
used to calculate the VSWR based on the ratio between maximum and minimum values, and reflection coefficient magnitude is further calculated from the VSWR at the focal point (37 mm away from the RA). The results are summarized in Table 2. These results exhibit that using the proposed phase perturbation technique at the central RA aperture elements in a center-fed RA reduces the reflection coefficient more than 4.5 dB, which is in agreement with those obtained at the feed port.
3. CONCLUSION
In this paper, a novel technique for improving the matching of the center fed reflectarray is investigated. The phase corrections of the elements in the area facing the feed are found to be effective. A comprehensive analysis of the field distribution on a line between the RA and feed is made to observe the behavior of standing waves before and after perturbation. The standing wave field analysis also authenticates the accuracy of the presented results. However, the phase perturbation method is found more flexible as we are able to make a compromise between the required matching level and the gain loss. Final measured results using the proposed phase perturbation method provide 5 dB matching improvement over 30% bandwidth. The maximum measured aperture efficiency of 55.4%, a 1-dB gain bandwidth of 33%, and the 1.5-dB axial ratio bandwidth of 33.2% are achieved.
REFERENCES
1. Huang, J. and J. A. Encinar,Reflectarray Antennas, John Wiley Sons Inc., Hoboken, NJ, 2007. 2. Polar, D. M., S. D. Tarkington, and H. D. Rigors, “Design of millimeter wave microstrip
reflectarrays,” IEEE Transactions on Antennas and Propagation, Vol. 45, No. 2, 1997.
3. Encinar, J. A., “Design of two-layer printed reflectarray using patches of variable size,” IEEE Transaction on Antennas and Propagation, Vol. 49, 1403–1410, 2001.
4. Deguchi, H., K. Mayumi, M. Tsuji, and T. Nishimura, “Broadband single layer triple-resonance microstrip reflectarray antennas,”Proc. EuMA, 29–32, Italy, 2009.
5. Hasani, H., M. Kamyab, and A. Mirkamali, “Broadband reflectarray antenna incorporating disk elements with attached phase delay lines,”IEEE Antennas and Wireless Propagation Letters, Vol. 9, 2010.
6. Huang, J. and R. J. Pozorzelski, “Ka-band microstrip reflectarray with elements having variable rotation angles,” IEEE Transaction on Antennas and Propagation, Vol, 46, No. 5, 650–656, May 1998.
7. Han, C., C. Rodenbeck, J. Huang, and K. Chang, “C/Ka dual frequency dual layer circularly polarized reflectarray antenna with microstrip ring elements,”IEEE Transaction on Antennas and Propagation, Vol, 52, No. 11, 2871–2875, 2004.