THE INFLUENCE OF RAPID pH DECLINE AND HIGH
MUSCLE TEMPERATURE ON THE WATER HOLDING
CAPACITY AND SOFTNESS OF BEEF
by
KHEANG CHY TAING
A thesis submitted in fulfillment of the requirements for the degree of
MASTERS OF SCIENCE
School of Life Sciences and Technology Victoria University of Technology
WER THESIS 664.9297 TAI 30001008242580 Taing, Kheang Chy
TABLE OF CONTENTS
TABLE OF CONTENTS I
ACKNOWLEDGMENTS IV
DEDICATION V
LIST OF ABREVIATION VI
LIST OF TABLES VI
Chapter 2 VI Chapter 3 VII Chapter 4 V D
LIST OF FIGURES X
Chapter 1 IX Chapter 2 IX Chapter 3 IX Chapter 4 IX
ABSTRACT X
CHAPTER 1 - LITERATURE REVIEW 1
1.1 INTRODUCTION 1
1.1.1 Meat Softness 1 1.1.2 The Water Holding Capacity of Meat 2
1.2 M U S C L E S T R U C T U R E 3 1.2.1 Muscle Fibres 3 1.2.2 Myofibrillar Proteins 4 1.2.3 Cell Membrane 5 1.2.4 Cytoskeletal Filaments and Costomeres 5
1.3 P R O T E I N D E N A T U R A T I O N A N D W A T E R H O L D I N G C A P A C I T Y 5 1.3.1 The Effect of Temperature and Rapid p H Decline on Protein Denaturation 6
1.3.1.1 Sarcoplasmic Proteins 6 1.3.1.2 Myofibrillar Proteins 7 1.3.1.3 Sarcoplasmic and Myofibrillar Proteins 9
1.3.2 Factors Affecting the Rate of p H Decline and Protein Denaturation 9
1.3.2.1 The Effect of Electrical Stimulation on pH Decline 10 1.3.2.2 The Effect of Temperature on pH Decline 11 1.3.2.3 The Effect of Muscle Fibre Type on pHDecline 12 1.3.2.4 Methods for Measuring Protein Denaturation 13 1.4 M U S C L E S T R U C T U R A L C H A N G E S D U E T O O N S E T O F R I G O R M O R T I S A N D
T H E I R EFFECTS O N W H C 14
1.4.1 Rigor Mortis 14 1.4.2 Muscle Shortening 15 1.4.3 Changes in Filament Spacing 16
1.4.4 The Formation of Extracellular Space 17
1.5 P R O T E O L Y S I S A N D W H C 18 1.5.1 Degradation of Z-Disks 19 1.5.2 Degradation of Contractile Filaments 20
1.5.3 Degradation of Cytoskeletal Proteins 20
1.5.6.1 The Warner-Bratzler shear 23 1.5.6.2 The Myofibrillar Fragmentation Index 23
1.6 THE SOFTNESS OF MEAT 24
1.6.1 Factors Affecting the Softness of Raw Meat 25 1.6.1.1 The Effects of Connective Tissues and Marbling on Meat Softness 25
1.6.1.2 The Effects of Myofibrillar Proteins on Meat Softness 26
1.6.2 Sensory Evaluation of Softness 27
1.6.2.1 Trained or Untrained Panel 27
1.6.2.2 Scoring System 27 1.6.3 Instrumental Methods for Assessing the Softness of Raw Meat 28
1.7 C O N C L U S I O N 31
1.9 A I M S 33 R E F E R E N C E S 35
CHAPTER 2 - DEVELOPMENT OF THE MYOFIBRILLAR FRAGMENTATION INDEX A N D INSTRON COMPRESSION F O R M E A S U R E M E N T S O F
M U S C L E SOFTNESS 45
2.1 T H E MYOFIBRILLAR FRAGMENTATION INDEX 45
2.1.1 Introduction 45 2.1.2 Materials and Method 46
2.1.3 Results and Discussion 47
2.1.4 Conclusion 49 2.2 D E V E L O P M E N T OF INSTRON COMPRESSION FOR M E A S U R E M E N T S OF
M U S C L E SOFTNESS 50 2.2.1 Introduction 50 2.2.2 Materials and Method 51
2.2.3 Results and Discussion 53
2.2.4 Conclusion 57 2.3 INVESTIGATION OF THE USE OF INSTRON COMPRESSION A N D SENSORY
EVALUATION TO EVALUATE DIFFERENCES IN M U S C L E SOFTNESS D U E TO T E M P E R A T U R E A N D pH DECLINE RATES O N THE SOFTNESS OF BEEF
M U S C L E S 58 2.3.1 Introduction 58 2.3.2 Materials and Methods 58
2.3.3 Results and Discussion 59
2.3.4 Conclusion 63 2.4 D E V E L O P M E N T OF INSTRON COMPRESSION T O E V A L U A T E M U S C L E
SOFTNESS CAUSED B Y EARLY POST-MORTEM HIGH TEMPERATURE 65
2.4.1 Introduction 65 2.4.2 Materials and Method 66
2.4.3 Results and Discussion 70
2.4.4 Conclusion 74 2.5 O V E R A L L CONCLUSION 75
CHAPTER 3 - THE EFFECTS OF EARLY POST-MORTEM HIGH
TEMPERATURE ON MUSCLE SOFTNESS AND WATER HOLDING
CAPACITY OF BEEF 94
3.1 Introduction 943.2 Materials and Method 96 3.3 Results and Discussion 99
3.4 Conclusion 107 R E F E R E N C E S 109
CHAPTER 4 - THE INFLUENCE OF TEMPERATURE AND pH DECLINE RATES
ON THE SOFTNESS AND WATER HOLDING CAPACITY OF BEEF MUSCLES
120
4.1 Introduction 1204.2 Materials and Methods 122 4.3 Results and Discussion 124
A C K N O W L E D G M E N T S
During m y Masters Research at the Victoria University of Technology, there have been m a n y people w h o have helped and supported m e . Whether their contribution w a s little or a lot, without their help, this research would have not been possible.
Firstly, I sincerely thank and appreciate the support and encouragement from my family during m y Masters Research.
To my principal supervisor, Dr Robyn Warner, thank you for your encouragement, your intellectual input and your belief in m e to see m e through the difficult times. I hope it was a rewarding and worthwhile experience for you. Without your support this research would not have been possible and I truly appreciate it.
To my co-supervisor Dr Mary Millikan, thank you for being with me since the start and supporting m e through tough times. Your moral support and encouragement were priceless.
To Dr Graham Trout, my former principal supervisor, you were there at the start but unfortunately w e went our separate ways. It was an experience to remember and thank you for you help and support during your supervision of m e . M a y your future endeavors be successful.
To all the friends that I have made during my study and who have provided help, companionship and support. Those w h o are still studying, I wish them all the best in their research and future endeavors.
Amal Shihata Goran Gambirosa Matthew Knight
Levent C a n Jeremy Cottrell Stephanie Coronado Sandra McKechnie Karoline Telbach Lily Salvatore Theresa H a y Matthew
Ken-To Brian White, Jim Heaney and Pam, thanks guys for your friendships and welcoming me into your house during m y board with you. Your friendship will be treasured.
Special thanks to staffs at VUT, namely Dennis Cox, Judy Bond, Swati Baindor-Hudson, Beverly Thomson, Brian Hanrahan, Vilnis, Neil Diamond and the librarians on Werribee
campus w h o have helped in m a n y different ways during m y study.
Special thanks also to the Meat and Livestock of Australia for providing me the scholarship and financial support to undertake a Masters Research degree.
It was difficult to find meat samples to conduct experiments and my researches would not have been possible without the support and help from commercial abattoirs. John Skelton
and his team from Bellandra Meat W o r k s deserve a very big thank you. John had not only allowed us to collect samples from his abattoir but also personally conducted the hot boning for the V U T meat research students despite his busy schedule. Special thanks also to Glenn Jacobson from P & R Meats and Neal Lovett from S B A Meats w h o also provided samples.
1. Bruce B e n h a m from Food Science Australia for all the research equipment modification and w h o w a s always willing to help and provide and being friendly his excellent
services.
2. Nicole D'Souza Muskens from Victorian Institute of Animal Science w h o helped m e with s o m e method developments and gave overwhelming support during a large experiment at CSIRO-Brisbane.
3. D r e w e Ferguson, Peter Torley and Frank S h a w from CSIRO-Brisbane w h o have offered help and support over the past years.
4. Dr. John Thompson, In H o H w a n g and their team from University of N e w England for allowing m e the opportunity to undertake a major experiment with them at C S I R O -Brisbane. Dr. John Thompson and In H o H w a n g have provided support through the years.
5. Eugene Chai from University of Melbourne for discussion of meat compression methodologies.
DEDICATION
I owe this research thesis to my mother who has been my mentor, supporter and a great mother. If it had not been for her support, I would have not had the commitment and
courage to complete m y research. I truly appreciate the thousands of things that she did for m e during m y study while all I had to do was to study. It had been a journey as m u c h for m e as it had been for her.
For all that you are and for all that you have done, thanks mum.
LIST OF ABREVIATION
W o r d
Adductor
adenosine triphosphate analysis o f variance Biceps femoris
bovine serum albumin dark, firm and dry dithiothreitol
electrical stimulation
Ethylene glycol bis (P-aminoethylether) NN-tetraacetic acid Instron compression
Longissimus dorsi
myofibrillar fragmentation index pale, soft and exudative
Psoas major
reddish, firm, normal reddish, soft, exudative rigor buffer
Semitendenosus Semimembranosus sensory evaluation
sodium dodecylsulfate-polyacrylamide gel electrophoresis Sternomandibularis
temperature
Warner-Bratzler shear water holding capacity
Abbreviation
AD
A T PANOVA
BF
BSA
DFD
DTT
ES
EGTA
IC
LD
MFI
PSE
PM
RFN
RSE
RB
ST
SM
SE
SDS-PAGE
STM
Temp
WBS
W H C
LIST OF TABLES
Chapter 2
Table 2.1.1: The effects of homogenisation speed and time and days of ageing (day 1 vs day 14) on the M F I values of beef Longissimus dorsi muscles. The means are least square
means 77 Table 2.1.2: The effects of homogenisation method ( M ) , the ageing days (D) and the phase
(P) of the samples on the M F I values of'beef Longissimus dorsi muscles. The means are
least square means 80 Table 2.2.1: Sensory evaluation (SE) of softness and Instron compression at 3 different
depths for 4 Semimembranosus muscles. The number of judges used for the whole Semimembranosus muscle on day 1, muscle blocks on days 1 and 6 were 16,16 and 9
respectively 81 Table 2.2.2: Correlation matrix showing Pearson's correlation coefficients (r) between
Instron compression (IC) measurements and sensory evaluation scores 82 Table 2.3.1: The effects of muscle electrical stimulation (ES ) and chilling rate on the
and Longissimus dorsi muscle block on day 1 and the Semimembranosus muscle block
on day 14 assessed by sensory evaluation 83 Table 2.3.2: The effects of muscle electrical stimulation (ES) and chilling rate on the
softness of Semimembranosus and Longissimus dorsi muscle block on day 1 as measured by the Instron compression load (Kg) at 5,10, 15 and 19 m m compression
depths 84 Table 2.3.3: The effects of electrical stimulation (ES) and chill rate on the softness of
Semimembranosus muscle block on day 14 as measured by the Instron compression
loads (Kg) at 5, 10,15 and 19 m m compression depths 85 Table 2.3.4: Pearson correlation coefficients (r) and their respective P values between the
Instron compression (IC) loads at 5, 10, 15 and 19 m m depths and the sensory evaluation (SE) of softness of the whole Semimembranosus and Longissimus dorsi muscles on day 1, the Semimembranosus and Longissimus dorsi muscle blocks on day 1
and the Semimembranosus muscle blocks on day 14 samples 86 Table 2.3.5: Pearson correlation coefficients (r) and the respectively values (P) between the
p H and temperature decline rate constants (pH K and T e m p K ) with the Instron compression (IC) loads at 5, 10, 15 and 19 m m depths and the sensory evaluation of softness of the whole Semimembranosus and Longissimus dorsi muscle on day 1, the Semimembranosus and Longissimus dorsi muscle block on day 1 and the
Semimembranosus muscle block on day 14 87 Table 2.4.1: The effects of early postmortem temperature control (37 vs 14 °C) on muscle
softness (as measured by sensory evaluation and Instron compression (IC)), p H decline
rate (pH K ) and sarcomere lengths on beef Longissimus dorsi muscles 88 Table 2.4.2: Pearson conelation coefficients (r) and respective P values between sensory
evaluation of softness and two Instron compression methods (Method A and Method B )
at 5, 8, 11 and 13 m m compression depths 89 Table 2.4.3: Pearson corcelation coefficients (r) and respective P values between the p H
decline rate constant (pH K ) and fat content (%) with the softness assessment by
sensory evaluation and two Instron compression methods (Method A and Method B ) at
5, 8, 11 and 13 m m compression depths 90
Chapter 3
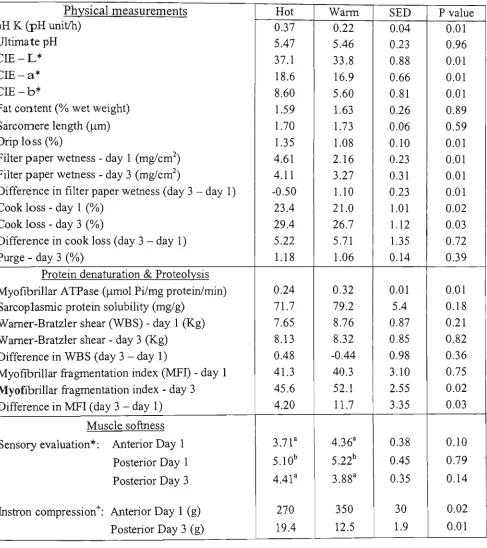
Table 3.1: The effects of early post-mortem temperature (hot 37 °C vs. warm 14 °C) on meat quality, protein denaturation, proteolysis, W H C and on the softness measurements
on beef Longissimus dorsi muscles. The means are least squares m e a n 110 Table 3.2: Pearson correlation coefficients (r) between various biochemical and physical
measurements of'beef Longissimus dorsi muscles to show their relationships due to the effects of post-mortem high (hot 37 °C) and m e d i u m (warm 14 °C) temperature control.
114 Table 3.3: Pearson correlation coefficients (r) between muscle softness as measured by
sensory evaluation (SE) and Instron compression (IC) at 5 m m compression depth with various biochemical and physical measurements of'beef Longissimus dorsi muscles. 115
Chapter 4
anti-Table 4.2: The effects of muscle electrical stimulation and chilling rates on the W H C and protein denaturation as measured by drip loss, purge day 14, filter paper wetness, myofibrillar Ca2+-ATPase activity, sarcoplasmic and total protein solubility. Each
value is a least squares m e a n 138 Table 4.3: The effects of muscle electrical stimulation and chilling rates on proteolysis as
measured by the Warner-Bratzler shear ( W B S ) on day 1 and 14, difference in W B S (day 14 - day 1), W B S ageing rate constant (K), myofibrillar fragmentation index ( M F I ) day 1 and 14, and difference in M F I (day 14 - day 1). Each value is a least
squares m e a n 139 Table 4.4: The effects of muscle electrical stimulation and chilling rates on the softness of
Semimembranosus and Longissimus dorsi muscles on day 1 and on the
Semimembranosus muscle on day 14 as measured by the sensory evaluation and the Instron compression (IC) load at 10 m m compression depth. Each value is a least
squares m e a n 140 Table 4.5: Pearson correlation coefficients (r) with their respective P values (P) for the
softness evaluation by the Instron compression (IC) load at 10 m m compression depths and b y sensory evaluation with the p H and temperature decline rate constants (pH K
and T e m p K ) for the L D and S M muscles for days 1 and 14 post-mortem 139 Table 4.6: Pearson correlation coefficients (r) of various biochemical and physical
measurements of the Longissimus dorsi and Semimembranosus muscles with muscle softness on day 1 as measured by Instron compression (IC) load at 10 m m compression depth and sensory evaluation (SE) and the p H and temperature decline rate constants
LIST O F F I G U R E S
Chapter 1
Figure 1.1: Diagram of the organisation of skeletal muscle from the gross structure to the
molecular level 42 Figure 1.2: Diagram showing the location of different myofibrillar proteins within the
sarcomere 43 Figure 1.3: A simplified diagram showing the structure and protein composition of
costarneres in muscle relative to the Z-disks and the myofibrillar lattice. 44
Chapter 2
Figure 2.2.1: Diagram showing the set up for the Instron compression of the
Semimembranosus muscle blocks using a cylindrical probe 91 Figure 2.3.1: Diagram showing the set up for the Instron compression of the Longissimus
dorsi muscle blocks using a cylindrical probe 92 Figure 2.4.1: Sample allocation from the Longissimus dorsi muscle for laboratory analyses
and softness assessment by the sensory evaluation and Instron compression (Method A
and Method B) for days 1 and 3 93
Chapter 3
Figure 3.1: Temperature decline curves of beef Longissimus dorsi muscles incubated in water bath at high and medium temperature (37 vs 14 °C) early post-mortem until rigor
(pH< 5.8) and then transferred to a 2 °C ice-bath 116 Figure 3.2: The effects of early post-mortem high and medium temperature (37 vs 14 °C)
on the p H decline of beef Longissimus dorsi muscles 117 Figure 3.3: The effects of early post-mortem high and medium temperature on the amount
of cook loss on days 1 and 3 of beef Longissimus dorsi muscles 115 Figure 3.4: The effects of early post-mortem high and medium temperature on the amount
of drip on days 1 and 3 of beef Longissimus dorsi muscles 119
Chapter 4
Figure 4.1: The effects of muscle electrical stimulation and chilling rates on the pH decline
rate of beef Semimembranosus muscles 143 Figure 4.2: The effects of muscle electrical stimulation and chilling rates on the p H decline
rate of beef Longissimus dorsi muscles 144 Figure 4.3: The effects of muscle electrical stimulation and chilling rates on the temperature
decline rate of beef Semimembranosus muscles 145 Figure 4.4: The effects of muscle electrical stimulation and chilling rates on the temperature
THE INFLUENCE OF RAPID pH DECLINE AND HIGH MUSCLE
TEMPERATURE ON THE WATER HOLDING CAPACITY
AND SOFTNESS OF BEEF
ABSTRACT
The research in this thesis had two aims. The first was to develop an instrumental method to measure the softness of raw meat and the second w a s to investigate the influence of rapid
p H decline and high muscle temperature post-mortem on the water holding capacity ( W H C , that is, the muscles' ability to retain fluid) and softness of beef.
For the instrumental analysis of muscle softness, different Instron compression (IC) methods were compared to sensory evaluation (SE) of meat. The instrumental methods involved compression of small muscle blocks (approximate size 4x5x6cm) parallel and perpendicular to the muscle fibre direction at 20 m m depths and also attaching cylindrical cores of meat (4.5 c m diameter) to the compression head to prevent the samples from collapsing. The most suitable method was compression of muscle blocks perpendicular to the muscle fibre direction to 5 m m depth, as this method was able to show that rapid p H decline and high muscle temperature gave softer meat than slow p H decline at a lower temperature. However, this method did not conelate with the S E scores; the S E method was not able to differentiate the variation in softness between samples.
In another experiment, two chill rates (fast and slow) and two E S times (10 and 4 0 sees)
were used on beef carcasses to obtain a wide range of p H and muscle temperature decline
rates. T h e L D and Semimembranosus ( S M ) muscles were used to study the effects in two
different muscles. T h e differences in p H and temperature decline rates between the four
treatments were m u c h higher in the L D muscle than the S M muscle. Although the L D had
larger differences in temperature and p H decline rates between treatments than the S M
muscle, it had lower protein denaturation levels and higher W H C than the S M . This could
have been due to the higher proportion of fast-glycolytic fibre types in the S M than the L D
muscle.
It was found that the muscles with higher temperature and faster pH decline tended to be
more tender on day 1 than the muscles with lower temperature and slower p H decline and
tended to coreelate with softer muscles. This supported the hypothesis that higher muscle
temperature and faster p H decline tended to cause softer muscles. However, the S M was
firmer than the L D muscle and this was perhaps because the shape and structure of the S M
muscle affected the softness more than the biochemical effects of rapid p H decline and high
temperature.
Overall, it was found that fast pH decline rate and high temperature resulted in greater
protein denaturation, reduced W H C , some tendency to show faster tenderisation and hence
softer beef muscles. The results of the experiments showed that the W H C has a direct
CHAPTER 1
1.0 LITERATURE REVIEW
1.1 INTRODUCTION
The WHC of muscle is important to the meat industry because weight loss affects financial value
as meat is sold b y weight and the expelled juice produces a pool of liquid which is unattractive to
the consumers. It is also important in processed meat with respect to the water binding capacity
of the muscle and the requirement to optimise yield. M a n y physical properties of meat such as
colour, flavour, texture, softness of raw meat, juiciness and tenderness of cooked meat are
influenced b y the W H C . G o o d quality meat is juicier with higher palatability (tenderness) and
W H C and acceptability than poor quality meat (Warner, 1994).
1.1.1 Meat Softness
Meat which has a high proportion of bound water is firm and has a tight structure that has a dry or
sticky feature. This is a quality defect in which a muscle has a high ultimate p H (usually pH>6.0,
but the cut-off can be as low as 5.8 and as high as 6.3, with variations existing between countries;
Tarrant, 1981) and is referred to as Dark, Firm and D r y ( D F D ) or dark-cutting (DC). In contrast,
meat with poor W H C k n o w n as Pale, Soft and Exudative (PSE) is lighter in colour, appears more
watery and has a loose structure (Judge et al, 1989; Lawrie, 1991). P S E meat is caused b y both
rapid p H decline and the attainment of low p H while the muscle temperature is high. P S E is a
major problem in pork but under certain cases beef also exhibit conditions similar to P S E with
lighter colour and watery characteristics (Sayre and Briskey, 1963; Penny, 1969; Offer, 1991).
Fischer and H a m m (1980) found in beef that 6 4 % of the Psoas major ( P M ) muscles that had fast
p H fall post-slaughter were similar to P S E pork but less pronounced.
Although it is not formerly reported, soft-watery beef is recognised by the beef industry as a
significant problem, particularly in the export market where beef is shipped from Australia to
Japan (Graham Trout, personal communication). T h e first sign of the problem is that there is
usually substantially more fluid expelled from the meat and this accumulates in the v a c u u m bag
prior to and during export. Secondly, the Japanese c o m m o n l y cut their beef into thin slices for
into thin slices but is also seen as an inferior quality due to the loss of fluid and its paler
appearance. This usually results in complaints. Since the Japanese pay a premium for their beef
and their market is one of our major export markets, it is vital that Australian beef is trusted and
recognised as of high quality (Graham Trout, personal communication) by either minimising the
soft and watery problem or being able to detect the cuts that exhibit the problem so they can be
excluded. In addition, soft meat is a problem on the shelves of domestic supermarkets as soft
texture looks inferior and is judged by the consumer as a less acceptable product.
Much research has shown that protein denaturation and the structural changes after rigor mortis
are two mechanisms which have major effects on the W H C of meat (Sayre and Briskey, 1963;
Penny, 1969; Honikel et al, 1981; M o n i n and Laborde, 1985; Offer and Cousins, 1992; Wilson
III and van Laack, 1999; Joo et al, 1999). However, proteolysis and m e m b r a n e integrity are also
thought to play a role in determining the W H C of meat (Honikel et al, 1981; Boakye and Mittal,
1993; Cheah et al, 1995; Lee et al, 2000; Tornberg et al, 2000), although the mechanisms of the
effect are unclear. This review will discuss h o w protein denaturation, the structural changes due
to the onset of rigor mortis, muscle proteolysis and m e m b r a n e integrity can affect the W H C and
softness o f beef. In addition, methods for measuring proteolysis and meat softness will be
reviewed.
1.1.2 The Water Holding Capacity of Meat
Water holding capacity is defined as the ability of meat to retain water and can be expressed by a
number of measurements that include water binding capacity, expressible juice, and exudate or
drip loss. Loss of water from the muscle occurs w h e n muscle surfaces are cut and exposed and as
the carcasses are further cut into smaller pieces for retail where the water loss can exceed 1 0 %
(van Lack and Solomon, 1994). T h e muscle of a freshly killed animal contains about 7 5 % water
(Lawrie, 1961), of which 8 5 % is located within the muscle cell, mainly in the vicinity of the thick
and thin filaments. The other 1 5 % is located in extracellular spaces. Water in muscle can be
classified as "free water" (95%) and "chemically bound" ( 5 % ) (Trout, 1988; Lawrie, 1991). The
chemically bound water is held tightly by electrostatic interaction with the polar and charged
groups of muscle proteins (Judge et al, 1989). The "free water" is held within the muscle by
Clearly a n y changes in the W H C of muscle would c o m e from the "free" water that is free to
migrate throughout the muscle structure. Since the major portion of water is held b y the
myofilaments, changes in this structure such as swelling or shrinkage will affect the water
distribution within the muscle. According to Offer and Trinick (1983), the interfilament spacing
is affected by p H , sarcomere length, ionic strength, osmotic pressure and whether the muscle is
relaxed or in rigor. B y varying these factors, the thick and thin filament spacing can vary from
320 to 5 7 0 A , which conesponds to a threefold change in volume.
1.2 MUSCLE STRUCTURE
There are three types of muscle; cardiac, smooth and skeletal. Cardiac muscle is present in the
walls of the heart and smooth muscle occurs in the digestive tract and blood vessels. T h e skeletal
muscle as the n a m e suggests is attached to bones, often through the tendons. Both the skeletal and
cardiac muscles are striated due to their alternating light and dark bands as observed under a light
microscope (Bechtel, 1986). In general, 3 5 - 6 5 % of the carcass weight of meat animals is
composed of skeletal muscle (Judge et al, 1989) and is economically important. It is this type of
muscle that will be discussed exclusively but briefly in this review.
The structure of muscle is organised in a hierarchy manner with each level being composed of
smaller sub-structures (Figure 1.1). Starting from the outside, the muscle is composed of muscle
bundles and within these bundles are m a n y smaller sub-units called muscle fibres or muscle cells.
Sheaths of connective tissues called the epimysium, perimysium and endomysium respectively
separate the muscles, muscle bundles and the muscle fibres. T h e muscle fibres contain important
cell organelles such as the mitochondria, cell nuclei, sarcoplasmic reticulum, myofilaments,
T-tubules and energy sources such as glycogen. The major portion of the muscle fibre is the
myofilaments which are the proteins responsible for muscle contraction that give rise to
m o v e m e n t (Bechtel, 1986; Judge et al, 1989; Lawrie, 1991).
1.2.1 Muscle Fibres
Approximately 80% of the muscle fibre volume is composed of myofibrils (Figure 1.1. ID) which
are rod-like structures of approximately 1 u m in diameter (Bechtel, 1986). These fibres
fibres run at an angle to the long axis. The fibre lengths vary from a few millimeters up to 34 c m
(Bailey, 1972).
The myofibrils consist of alternating light and dark bands (thus causing the visible striations)
which gives rise to periodicity k n o w n as the sarcomere (Figure 1.1.IE). A sarcomere is a
complete unit that is defined from one Z-disk to the next, and contains contractile units called
myofilaments which are predominantly the thick and thin filaments (Figure 1.1.IK & 1.1L). The
thick filaments consist of the myosin molecules which are described as rod-like molecules with a
large spherical head propped up at one end (Judge et al, 1989). Myosin constitutes about 4 3 % of
the total muscle proteins and each myosin is comprised of two subunits, the myosin light and
heavy chains. The thin filament constitutes 3 2 % of the total muscle proteins and is composed of
three proteins (actin, tropomyosin and troponin) of different shapes chemically bound together
(Maruyama, 1985). Actin is the major component of the thin filament. T h e thin filaments are
attached to the Z-disk protein, lying in between are the thick filaments that are held together by
other proteins, s o m e of which are located in the M-line (Judge et al, 1989).
The arrangement of the thick and thin filaments is a three dimensional lattice. Six thin filaments
sunound each thick filament and three thick filaments sunound each thin filament (Figure
1.1.1F-I). In each muscle fibre there are about 2000 myofibrils of 1 u m diameter (Bailey, 1972). This
arrangement becomes very important w h e n various postmortem changes occur that cause the
structure to expand or contract, affecting W H C and tenderness.
1.2.2 Myofibrillar Proteins
Apart from proteins of the thick and thin filaments, other myofibrillar proteins that are of
importance and significant abundance are a-actinin, connectin (titin), desmin, nebulin, N2 line
proteins and M-line proteins (Figure 1.2). a-Actinin is the main component of the Z-disk and
composes about 2 % of the total myofibrillar protein. Connectin extends longitudinally along the
thick filament from each end of the Z-disk and is about 1 0 % of myofibrillar protein. S o m e
portion of it is elastic which is believed to act as a shock absorber and scaffold for the alignment
and structural integrity within the sarcomere (Maruyama, 1985; Bechtel, 1986; Judge et al,
Desmin constitutes about 1 % of myofibrillar protein and is located at the end of the myofibrils. It encircles the Z disks, connects the adjacent myofibrils and plays an important role in structural organisation. Nebulin is a large protein that runs along the thin filament and constitutes about 3 % of myofibrillar protein (Maruyama, 1985). The N2 line is a structure located at the I band that runs parallel to the Z-disks (Maruyama, 1985). It consists of various proteins (Figure 1.3) and is
suggested to also contain titin and nebulin (Taylor et al, 1995). M-line proteins constitute about 2% of myofibrillar proteins and act to stabilise the rod portion of the myosin molecules of the thick filament (Judge et al, 1989).
1.2.3 Cell Membrane
The cell membrane is also known as the sarcolemma and it is about 7 nm thick. It consists of carbohydrates, proteins, glycoproteins (mainly on the outer m e m b r a n e surface) and predominantly phospholipids. It is quite elastic which allows flexibility during stretching and contraction. The cell m e m b r a n e performs m a n y important functions, some of which are to contain the contractile units and to regulate the uptake and release of molecules by the muscle cell (Bechtel, 1986; Judge etal, 1989).
1.2.4 Cytoskeletal Filaments and Costomeres
The costameres are protein structures that connect the myofibrils to the cell membrane (Figure 1.3). They are located at the surface of the muscle cell and occur periodically along the myofibril
at the level of each I-band and exhibit s o m e structural strength (Taylor et al, 1995). Spectrin and vinculin are two major proteins of the costameres. Spectrin links the actin filaments to the m e m b r a n e proteins and plays an important part in maintaining the shape and elasticity of the cell membrane.
1.3 PROTEIN DENATURATION AND WATER HOLDING CAPACITY
Protein denaturation is any change in native conformation of a protein that leads to one or more changes in the chemical, biological, physical properties of the protein. Denaturation of proteins
Lack and Solomon, 1994). The extent of denaturation is indicated b y the reduction in protein
solubility and extractability relative to the undenatured protein extracts and specifically in myosin
by myofibrillar A T P a s e activity (Penny, 1977; Tanant and Mothersill, 1977; Wilson and van
Laack, 1999; Joo et al, 1999).
1.3.1 The Effect of Temperature and Rapid pH Decline on Protein Denaturation
Rapid pH decline in muscle pre-rigor and/or the attainment of low muscle pH while the
temperature is high post-slaughter causes protein denaturation and hence reduced W H C . Tarrant
and Mothersill (1977) showed that a greater muscle depth in the carcass resulted in slower
temperature decline which accelerated the rate of p H decline and caused increased amount of drip.
M a n y researchers have shown significant conelations between the amount of drip, cooking loss
and loss o f W H C with rapid p H decline in muscles during the pre-rigor period or with low p H and
high temperature (Bendall and Wismer-Pedersen, 1962; Penny, 1977; Babiker and Lawrie, 1983;
Klont et al, 1996; B o w k e r et al, 1999; Geesink et al, 2000; Claeys et al, 2001). A s a result, it
is essential to understand what and h o w proteins are denatured. Unfortunately m u c h of the data
available is for pork and not for beef.
In the context of WHC, proteins are usually classified into two groups, the sarcoplasmic proteins
and the myofibrillar proteins. Although it is perceived that myofibrils hold the bulk of the water
in the muscle, denaturation of both groups of proteins has been extensively studied.
1.3.1.1 Sarcoplasmic Proteins
Sarcoplasmic proteins constitute about 30-34% of the total muscle proteins (Lawrie, 1991). They
are suspended in the sarcoplasm and play important roles in cellular metabolism. There is a
conelation between the concentration of sarcoplasmic proteins and the amount of drip, generally,
the lower the drip the higher the protein concentration in the drip and vice-versa (Penny, 1977;
S a v a g e s al, 1990).
Savage et al (1990) found in pork that the drip loss ranged from 3.9-15.1% by weight with the
m g / m L . Savage et al. (1990) suggested that it is the denaturation and/or precipitation of the
sarcoplasmic proteins that causes low protein concentration in a large amount of drip.
Water can be bound to a protein surface, and it is estimated that 0.5 g of hydration water is bound
to each g r a m of muscle proteins. However, since only about 2 0 % of the total meat weight is
protein, the binding of water to the surface of protein molecules is too small to account for the
observed changes in water content of meat due to drip (Offer and Trinick, 1983). Although there
is a conelation between sarcoplasmic protein denaturation and the W H C , there are disputes about
whether this is a cause and effect relationship since sarcoplasmic proteins hold only about 3 % of
the water and hence cannot be responsible for drip loss of more than this (van Lack and Solomon,
1994, den Hertog-Meischke et al, 1997). Since a drip loss of up to 1 5 % in s o m e muscles has
been observed, the origin of drip can not be only from the sarcoplasmic proteins but rather is an
indication of denaturation of other proteins, possibly causing changes in the muscle structure.
1.3.1.2 Myofibrillar Proteins
Myofibrillar proteins accounts for approximately 50-55% of the total protein content of the
muscle (Lawrie, 1991) and their denaturation can be measured b y protein solubility and
myofibrillar A T P a s e activity. Sayre and Briskey (1963) reported a loss of myofibrillar protein
solubility of pork muscle with rapid p H fall (pH < 6 at 1 hr) post-slaughter regardless of the
temperature at rigor onset. Although the ultimate p H w a s the same at 2 4 h, samples that had a
slower p H decline resulted in less myofibrillar denaturation. With rapid p H decline, the protein
solubility w a s less than 5 0 % at rigor onset and only 2 5 % at 2 4 h. Furthermore, m e d i u m to low
p H at the onset of rigor mortis or within the first few hours after slaughter combined with high
temperature greatly reduced both the sarcoplasmic and myofibrillar protein solubility.
Using pH at 90 minutes postmortem to measure the rate of pH decline, Penny (1969) found a
significant correlation between myosin A T P a s e activity, protein solubility and W H C . H e reported
high values of myosin ATPase, protein solubility and W H C between p H 5.9 and 6.9 and
decreased values for p H below 5.9. This reveals that the faster the p H decline, as measured by the
p H at 9 0 minutes postmortem, the lower the protein solubility and myosin A T P a s e activity, which
are indicators of greater protein denaturation. Thus the rate of p H decline can be a good indicator
Penny (1967) used C a A T P a s e activity, M g A T P a s e activity and protein solubility with K C 1
and pyrophosphate solutions to study the effect of p H and temperature on washed rabbit
myofibrils. H e found that myofibrils were denatured b y heating at 35-42 °C at p H values between
4.8-5.6, and that the rate of deactivation of both myosin A T P a s e activity and loss of protein
solubility were similar. Furthermore, the thermodynamic properties such as enthalpies and
entropies of activation were similar suggesting that the three properties, C a2 + A T P a s e activity, M g2 + A T P a s e activity and protein solubility, were being changed simultaneously. Penny (1967) also found muscles from carcasses which were held at 37 °C for 4 h after rigor resulted in 5 0 %
loss of solubility and 3 0 % loss of C a2 + A T P a s e activity compared with normal post rigor samples.
Conelation coefficients between the WHC of meat and protein solubility have indicated that
sarcoplasmic proteins start to lose solubility immediately after death while myofibrillar proteins
are m o r e affected later, largely after completion of rigor mortis (Sayre and Briskey, 1963). They
said that there is a highly significant negative conelation between myofibrillar protein solubility
and high muscle temperature at the onset of rigor mortis. This conelation partly agrees with the
work of Offer (1991) and van Laack and Solomon (1994) w h o suggested that the presence of
adenosine triphosphate ( A T P ) maintains the myosin A T P a s e activities and hence significantly
protects the myosin (myofibrillar protein) from denaturation. However, they (Offer, 1991; van
Lack and Solomon, 1994) also reported that the formation of the actomyosin complex between
myosin and actin during rigor mortis has even a greater protective effect in preventing the myosin
from denaturation.
A n important physical change in myofibrillar proteins as a result of denaturation is the shrinkage
of the head of the native myosin molecules which appears to explain the reduction in W H C (Offer
et al, 1989). It has been found that the heads of the native myosin molecules are 19 n m long, but w h e n treated under conditions similar to those which cause P S E (pH 6.0, 35 ° C for 5 or 10 mins)
and loss of myosin A T P a s e activity, the heads shrank to 17 n m . Shorter myosin heads will draw
the thick and thin filaments closer thus reducing the interfilament volume and consequently, more
water will be expelled into extracellular spaces. This small change is said to be enough to account
for the increased myofibrillar shrinkage in P S E meat (Offer et al, 1989; van Lack, 1994) and
1.3.1.3 Sarcoplasmic and Myofibrillar Proteins
So far our discussions on protein denaturation have looked at h o w sarcoplasmic and myofibrillar
proteins denature separately, however, the denaturation of one protein m a y affect the denaturation
of the other. M a n y authors (Bendall and Wismer-Pedersen, 1962; Penny, 1967; Warner et al,
1997) have reported that denaturation of sarcoplasmic proteins causes s o m e of them to precipitate
onto the myofibrils and postulated that this m a y reduce the W H C of the myofibrils.
However, this may not be a cause and effect relationship. Monin and Laborde (1985) reported
that a sarcoplasmic and myofibrillar mixture has better W H C than myofibrils alone and they
suspected that it w a s due to a positive effect of sarcoplasmic protein on the myofibril's W H C .
They said that myofibrils are sensitive to p H and incubation temperatures. A t high temperature
and low p H , this positive interaction is suppressed and the W H C of myofibrils dominate. If
sarcoplasmic proteins precipitate onto the myofibrils and reduce their W H C , then they expect the
sarcoplasmic and myofibrillar mixture to have lower W H C than myofibrils alone w h e n incubated
in conditions denaturing to sarcoplasmic proteins, however, the observed differences were quite
small.
Offer (1991) hypothesised that because postmortem glycolysis generally reduces the muscle pH
from 7 to about 5.5, s o m e protein denaturation will occur because this low p H is not the
physiological p H usually experienced b y muscle proteins in the living state. H e also suggested, if
the extent of glycolysis is abnormally high such that it results in ultimate p H lower than 5.5, then
the muscle proteins will suffer m o r e denaturation than usually experienced postmortem. In
contrast, D F D meat has higher ultimate p H (above 6) than both P S E and normal meats (pH about
5.5), yet protein denaturation of D F D muscles does not differ from normal muscles while P S E
muscles have the highest protein denaturation (Penny, 1969; Judge et al, 1989; Lawrie, 1991;
Warner et al, 1997). D F D meat is firmer and has better W H C than normal meat. It is well
k n o w n that the ultimate p H affects the W H C of meat through the effects on the myofibrillar
lattice (Offer and Trinick, 1983; Offer, 1991; van Lack and Solomon, 1994).
1.3.2 Factors Affecting the Rate of pH Decline and Protein Denaturation
There are a number of factors which influence the rate of p H decline, the major ones being
electrical stimulation, muscle temperature, muscle fibre type, species and animal factors which
will only discuss the effects of electrical stimulation, temperature and muscle fibre type on the
rate of p H decline.
1.3.2.1 The Effect of Electrical Stimulation on pH Decline
Electrical stimulation is used to achieve rapid rigor to prevent cold shortening and associated
toughness (Crystall and Devine, 1991; Bendall, 1980). However, since it accelerates postmortem
glycolysis and increases the rate of p H decline, greater losses in W H C and drip have been
observed in beef carcasses which have been E S possibly due to protein denaturation (Offer 1991).
Electrical stimulation affects the pH decline rate of different muscles differently. By measuring
the temperature of beef muscles at 1, 3 and 2 4 h post-slaughter and chilling the carcass over night
at 2.5 °C, D e n Hertog-Meischke et al. (1997) found that low voltage E S had greater effect on the
p H decline of the S M muscle than the L D . T h e S M muscle had a m u c h faster p H decline and
slower temperature fall than the L D , and reached a lower ultimate p H . H o w e v e r the ultimate p H
did not differ between E S and non-stimulated muscles. Electrically stimulated samples had lower
sarcoplasmic protein solubility than non-ES samples suggesting that one of the effects of E S is
increased sarcoplasmic protein denaturation. The S M had higher drip loss and filter paper
wetness than the L D and this was probably caused by the different p H decline rates. Since the
ultimate p H and sarcomere lengths did not differ between E S and non-ES in the S M muscles, the
drip loss difference m a y have been due to additional myosin denaturation b y high
temperature/low p H condition caused b y E S . D e n Hertog-Meischke et al (1997) accounted for
these effects due to the differences in fibre types of the S M and the L D muscles. In addition, the
above effects could also be accounted for by temperature differences due to the location and thus
depth of the muscles within the carcass.
Babiker and Lawrie (1983) found that ES and incubation of bovine LD muscles at 30 °C resulted
in a m u c h faster p H decline than just incubation at 40 °C without electrical stimulation.
According to B o w k e r et al. (1999) and Maribo et al. (1999), the faster p H decline should have
also resulted in higher cooking loss or drip loss, but surprisingly Babiker and Lawrie (1983) found
no significant differences in the W H C between the stimulated and non-stimulated muscles.
However, they (Babiker and Lawrie, 1983) did find higher loss of W H C in muscles that had been
carried out. Perhaps this w a s too short a time to allow drip formation in order to observe
significant differences between treatments.
1.3.2.2 The Effect of Temperature on pH Decline
Of all the factors that affect the rate of pH decline, temperature is the most important. Sayre and
Briskey (1963) reported in an experiment they conducted that the sarcoplasmic protein solubility
of muscles held at temperatures below 35 °C or above 35 °C before the onset of rigor were all
similar. H o w e v e r , at onset or just after rigor, muscle temperature affected the solubility of
sarcoplasmic proteins if the p H fell below 6.0. Muscles that entered rigor above 35 °C with rapid
p H decline (or low p H ) gave the lowest protein solubility. Muscles that entered rigor above 35 °C
also gave lower sarcoplasmic protein solubility even though their ultimate p H w a s higher than
samples which entered rigor at a lower temperature but had similar or lower ultimate p H . O n the
other hand, w h e n muscles entered rigor at a p H > 6.0, or had a high ultimate p H then the protein
solubility w a s not affected by temperature, and hence retained high protein solubility. These
results emphasise the importance of temperature interaction with the rate of p H decline at rigor
onset (Sayre and Briskey, 1963).
Muscle depth also illustrates the effects of temperature on the rate of pH decline. Muscles deeper
within the carcass will experience higher temperature for a longer period post-slaughter. Tanant
and Mothersill (1977) found that in bovine Adductor ( A D ) , Semitendinosus (ST) and Biceps
femoris (BF) muscles, at 8 c m depth, a high temperature of 30 °C lasted for 3 h while the p H values of less than 6 were obtained. The average p H decline rate of the four muscles between 1
and 4 h postmortem at different depths were 0.05-0.07 units/h at 1.5 c m and 0.22-0.29 at 8 cm.
This is considered rapid p H decline for beef muscles and examination of these samples at 2 days
postmortem revealed paler, softer and wetter appearance at 8 c m than 1.5 depth. The muscles
developed a mild P S E as can often be observed in pork.
The effects of temperature on the pH decline as indicated by varying muscle depth is clearly
reflected b y the denaturation of sarcoplasmic and myofibrillar proteins (Tanant and Mothersill,
1977). Denaturation of sarcoplasmic proteins is indicated b y almost total loss of creatine kinase
activity during rigor onset at 8 c m in the A D and S M muscles and faster depletion of A T P at 8 c m
activity at 8 c m w a s 2 9 % lower than at 1.5 c m depth in beef A D muscle and the myofibrillar
solubility w a s 3 2 % lower at 8 c m than at 1.5 cm.
1.3.2.3 The Effect of Muscle Fibre Type on pHDecline
Muscle fibres can be basically classified into three types, red, white and intermediate depending
on their physiological and energy metabolism characteristics. It is rare that muscles are composed
of all white, all red or all intermediate fibres and are usually a mixture of both. Hence, red
muscles are those with higher portion of red fibres than found in white muscles and vice versa.
The predominant fibre often determines the quality of meat (Judge et al, 1989; Lawrie, 1991).
Red and white muscle fibres are slow and fast twitch muscle fibres respectively. Red fibres
contract m o r e slowly but can sustain the action for longer periods. This requires constant supply
of energy and thus red fibres have higher oxidative metabolism because of greater utilisation of
the Krebbs cycle and electron transport chain to generate A T P . A s a result of this oxidative
process there is a higher demand for oxygen hence red fibres contain more myoglobin, more
mitochondria, and have a smaller size. . R e d fibres have a higher lipid content which serve as an
oxidative fuel whereas white fibres have a higher glycogen content for immediate supply of A T P .
The reason for this is that white fibres undergo higher anaerobic glycolysis for production of A T P
from the conversion of glycogen to lactic acid that is used for rapid muscle contraction (Judge et
al, 1989; Lawrie, 1991).
It is commonly known that pre-slaughter stress depletes glycogen from muscle fibres and the
different types of muscle fibres are more or less affected by stress due to the differences in energy
metabolism and the initial store of glycogen level. The ultimate p H of red muscles is often higher
due to the lower glycogen content and their buffering capacity is lower than that of white muscles.
Therefore, the tendency of muscles to develop D C or P S E character will depend on the relative
amount of fast and slow twitch fibres they contain. Whereas white muscles will be susceptible to
P S E because of their higher glycogen content and faster energy metabolism (Judge et al, 1989;
Lawrie, 1991).
implied that due to different fibre types in different muscles, the highest p H decline rate did not
result in the highest amount of drip. T h e S T muscle reached p H 6 in 2.8 h while the S M reached
p H 6 in 4.1 h and yet the S T muscle produced 1 6 . 7 % drip compared to 1 9 . 4 % drip in the S M .
They did not measure the protein denaturation or structural changes and thus could not account
for the differences in the W H C measurements.
1.3.2.4 Methods for Measuring Protein Denaturation
Protein Solubility
Protein solubility (sarcoplasmic and myofibrillar) and myofibrillar A T P a s e activities are s o m e of
the methods that can be used to measure protein denaturation. The sarcoplasmic protein solubility
measures the amount of proteins that can be solubilised from the sarcoplasm using a w e a k ionic
strength buffer. T h e total protein solubility measures the total amount of muscle proteins that can
be solubilised by a strong ionic strength buffer (Penny, 1969; W u and Smith, 1987; van Lack and
Solomon, 1994; Warner, 1994). The principal idea is that myofibrillar protein solubility increases
with the ionic strength of the buffer (Penny, 1969; W u and Smith, 1987; van Lack and Solomon,
1994; Warner, 1994) and that denaturation of proteins reduces their solubility relative to the
undenatured protein (Penny, 1977; Tanant and Mothersill, 1977). Since the sarcoplasmic proteins
are already solubilised in the sarcoplasm, only a w e a k ionic buffer of similar ionic concentration
to the sarcoplasm is required to remove or separate them from undissolved muscle proteins. O n
the other hand, myofibrillar proteins require a m u c h stronger ionic buffer to solubilise them.
Hence, myofibrillar protein solubility is taken as the difference between the total and
sarcoplasmic protein solubility (Penny, 1969; M o n i n and Laborde, 1985; Warner, 1994).
Myofibrillar ATPase Activities
The A T P a s e methods c o m m o n l y involve purifying the myofibrils from the whole muscle. The
solution is then diluted to a k n o w n concentration with the addition of appropriate ions (activator)
and A T P . T h e activity of the enzymes is measured b y the amount of inorganic phosphate that is
liberated from the break d o w n of A T P b y the A T P a s e enzymes (Penny, 1967; Ouali, 1984;
Warner, 1994). If the enzymes are denatured then they will be unable catalyse the reaction and
overall their activity will be less compared to the undenatured enzymes. Since these enzymes are
located on the myosin head, their denaturation gives an indication of the condition of the
According to Ouali (1984, 1992), there are three different myofibrillar A T P a s e activity methods:
1) the Ca-activated myofibrillar A T P a s e measures the activity and checks the integrity of the
myosin molecule in the myofibril in the presence of C a2 + ions ( 4 m M ) ;
2) the M g - C a activated myofibrillar A T P a s e measures the activity of the actomyosin complex in
the presence of M g2 + ( 4 m M ) and C a2 + ( 2 m M ) ions, and
3) the M g - E G T A modified activity in the presence of M g2 + ( 4 m M ) ions and E G T A ( I m M , ethylene glycol bis (P-aminoethylether) NN-tetraacetic acid), which is an indicator of the
regulatory complexes tropomyosin and troponin.
Ca-activated myofibrillar ATPase activity is the most commonly used of the three methods as an
indication of protein denaturation in the myosin head. W h e n the myosin molecules are denatured,
the head of the molecules shrink which can subsequently reduce the myofibrillar lattice spacing
(Offer and Trinick, 1983; R a o et al, 1989; Guignot et al, 1993).
1.4 MUSCLE STRUCTURAL CHANGES DUE TO ONSET OF RIGOR MORTIS AND
THEIR EFFECTS ON W H C
1.4.1 Rigor Mortis
Rigor mortis is the loss of extensibility of muscles after death (Judge et al, 1989). It forms as a
result of permanent cross-bridges between actin and myosin that develop once A T P stores are
depleted. A T P is normally required to release bonds between actin and myosin. T h e onset of
rigor mortis can be observed w h e n muscles begin to lose elasticity and extensibility and develop
shortening and tension. Unrestrained muscles are free to shorten more than restrained muscles.
Rigor shortening is different from normal contraction because in normal contraction there is only
about 2 0 % binding of the actomyosin, however, in rigor there is binding in nearly all areas of
overlap between myosin and actin. The rate of rigor development post-slaughter differs between
animals and muscles but is closely related to p H decline and fibre type because both are related to
the metabolism of glycogen and A T P . The faster the p H decline the quicker will be the onset of
1.4.2 M u s c l e Shortening
T h e degree of shortening that a muscle undergoes as it enters rigor mortis is temperature
dependent. A b o v e 10-15 °C, shortening increases with increasing temperature and at a relatively
high temperature (37-50 °C) severe heat shortening is likely to occur. Also with the higher
temperature range, early onset of rigor mortis m a y be induced (Judge et al, 1989). However, if
the muscle temperature is reduced to less than 10 °C before onset of rigor then cold shortening is
2+
also likely to occur. T h e causes of cold-shortening relate to the release of C a or failure of the
calcium p u m p of the sarcoplasmic reticulum due to the low temperature. During onset of rigor
mortis muscles which are held on the carcass have less tendency to shorten, but certain parts of
the muscle m a y have limited freedom to contract and m a y do so while other parts lengthen to
maintain the same overall length (Lawrie, 1991).
Thaw rigor is a severe type of shortening that occurs when muscle that was frozen pre-rigor is
thawed. O n thawing, the rate of A T P break d o w n will be affected by the rate of pre-rigor
freezing; rapidly frozen muscles metabolise A T P faster than slowly frozen muscles and the onset
of rigor mortis is also quicker (Lawrie, 1991). The resulting contraction is caused by sudden
2+
release of C a into the sarcoplasm and m a y cause physical shortening of up to 8 0 % of the
original length of unrestrained muscles, but more c o m m o n l y the shortening is 6 0 % (Judge et al,
1989). 30-40%) exudation or drip loss can occur if the muscle undergoes thaw rigor (Lawrie,
1991).
Although cold shortening tends to be more severe, both cold and heat shortening will cause
sarcomere shortening and hence a reduction in the myofibrillar lattice. In addition, heat
shortening can be accompanied b y protein denaturation and both of these factors will
subsequently lead to loss of W H C of meat and increased drip loss during post rigor storage. The
amount of water loss will depend on the severity of the problem (Judge et al, 1989; Lawrie,
1991). M i n i m u m drip occurs if meat or carcasses are stored at 10-15 °C pre-rigor that coincides
with m i n i m u m shortening. Reducing the muscle temperature from 37 to 15 °C will not only
m i m m i s e heat rigor but also protein denaturation. However, rapid chilling of pre-rigor muscles
m a y induce cold shortening. Through appropriate chilling and muscle restraint, shortening can be
In beef carcasses, cold shortening does not tend to affect muscles deep in the carcass such as the
rump. D u e to the high initial muscle temperature and insulation by the carcass, postmortem
glycolysis would be completed before refrigeration can lower these muscles below 15°C.
Consequently, these muscles are more likely to suffer from the exudative condition similar to P S E
pork (Offer, 1991).
1.4.3 Changes in Filament Spacing
Postmortem glycolysis in a typical muscle will normally reduce the initial muscle pH of 7 to an
ultimate p H of about 5.5 (Swan, 1993). Associated with the reduction in p H , the electrostatic
repulsion between negatively charged myofilaments will decrease. T h e isoelectric point of
muscle proteins where the number of positive and negative charges are equal is at a p H of about
5.0 (van Laack and Solomon, 1994). A s the p H approaches the isoelectric point there will be a
reduction in the negative groups of the myofibrillar proteins which produces less repulsion.
Consequently, the interfilament spacing is reduced and the loss of W H C occurs in addition to the
shortening caused b y temperature as discussed in section 1.4.2 (Judge et al, 1989).
At pH ranges higher or lower than 5.0, there will be excess negative or positive charge
respectively. W h e n this occurs there will be repulsion between filaments resulting in a larger
interfilament space which can hold more water. Attachments of the actin filaments to the Z-line,
the myosin filaments to the M-line and the actomyosin crosslinks are the constraints to the
swelling w h e n the negative charge on the proteins is increased with an increase in p H (Offer and
Trinick, 1983).
Furthermore, as a result of rigor and the formation of actomyosin crossbridges, there is a
reduction in total volume due to sarcomere shortening as well as fibre diameter shrinkage that
leads to smaller filament spacing. T h e filament spacing decreases to about 4 . 4 % smaller than the
original spacing which conesponds to a 9 % decrease in cross sectional area and hence volume of
the myofibrils (Offer and Trinick, 1983; Offer et al, 1989; Offer and Cousins, 1992; T o m b e r g et
al, 2000). T h e fluid that is expelled accumulates between the fibre bundles and between fibres. The reduction in volume can be caused not only b y rigor development but also b y protein
If these principles are true then the loss of water due to p H decline is also inevitable. That is, the
W H C will be affected b y the extent of postmortem p H fall and the lower the ultimate p H , the
lower the W H C (Lawrie, 1991).
1.4.4 The Formation of Extracellular Space
There are several theories as to how the cellular water is distributed during the formation of
extracellular spaces that lead to drip loss. According to Offer and Trinick (1983), Offer et al.
(1989) and Offer and Cousins (1992), initially there are no large channels in the in vivo muscle
and the fibres fill the endomysial network and the fibre bundles fill the perimysial network. At 6
hours postmortem, gaps of variable sizes appear between fibre bundles while b y 24 hours, gaps
appear between fibres as the myofibrils shrink causing the fibres to shrink. T h e cellular water
accumulates around the perimysial then later around the endomysial network resulting in two
extracellular compartments. Gravity then drains these compartments creating the drip.
Honikel et al. (1986) suggested that in living muscle, during contraction the muscle cell volume
does not change, therefore, the distance between myofilaments within sarcomeres must increase,
then decrease during relaxation. During rigor, the fibre diameters decrease which result in a
decrease in muscle volume causing the extracellular space to increase, hence water must migrate
from intracellular to extracellular space. Decreasing the distance between thin and thick filaments
could also cause expulsion of water and influx into the sarcoplasm that will cause dilution of the
sarcoplasmic proteins. In shortened sarcomeres this diluting effect is pronounced since the drip is
higher.
Penny (1977) found that the amount of extracellular space increases with holding temperature and
time post-mortem, up to a limit of about 2 5 % . There is a conelation between the amount of drip
and the increase in extracellular space up to a m a x i m u m of 2 5 % , thereafter, the extracellular space
does not increase even though drip increases due to protein denaturation. During this event, the
sarcoplasmic fluid is thought to be transfened to the extracellular space. T h e rate of increase in
extracellular space is different for different muscles.
To express it simply, there is a redistribution of water within the muscle postmortem due to
leaves the water behind in the extracellular space or pushes the water from the intracellular to the
extracellular space that has increased in size due to the cell shrinkage.
1.5 PROTEOLYSIS AND WHC
It is commonly observed that meat becomes more tender during ageing which makes it easier to
cut and shear during eating or instrumental analysis. U p o n homogenisation, aged meat yields a
higher n u m b e r of small fragments than unaged meat which indicates that the muscle structure is
weakened (Davey and Gilbert, 1969; Koohmaraie, 1988). These changes are largely attributed to
proteolysis in which certain muscle proteins are degraded hence weakening the structure. There
appears to be a significant conelation between tenderisation and the degree of fragmentation of
meat, that is, the amount of fragmentation increases with increasing tenderness as muscles age.
A s a result, the amount of protein degradation occurring in muscles is often conelated with the
increase in tenderness: this change in tenderness is an indicator of proteolysis (Olson et al, 1976;
Calkins and Davis, 1980; Davis et al, 1980; Koohmaraie, 1992; Ferguson et al, 2000; Lee et al,
2000; Geesink et al, 2001).
If protein degradation occurs to the extent that it disrupts the structural integrity of the muscle
fibres, thus changing the myofibrillar lattice structure, then what effects would this have on its
water holding capacity? There is extensive research into the relationship between proteolysis and
tenderisation, however, the effect of proteolysis on W H C is little k n o w n . A s the bulk of the water
in muscle is held in the myofibrils through capillary forces, it would be expected that the loss of
W H C would also relate to the degree of protein degradation and subsequently the change in
tenderness. D o e s this m e a n there is a relationship between the degree of tenderisation and W H C ,
or does proteolysis affect only tenderness without m u c h influence on the W H C ?
The question is, what is happening to meat during ageing and what proteins are being degraded
that results in increasing tenderness? In the following discussion I will review the structural
changes due to proteolysis and h o w these influence the tenderness. Consequently, this m a y
provide better understanding of h o w the proteins that influence the muscle integrity m a y also
M e a t is usually refrigerated at 0-2 ° C during ageing and under this conditions researchers (Penny,
1980; Ouali, 1990; Ouali, 1992; Dransfield, 1994; Goll et al, 1995; Taylor et al, 1995;
Koohmaraie, 1996) have reported the following findings.
1) In beef, after 3 days, breaks at the junction of I-filaments with Z-disk appear, larger gaps
appear later with continuous breaks involving m a n y myofibrils. T h e Z-disk is attached to
o n e end of I-filaments at the fracture site.
2) Degradation occurs in or near the Z-disks, hence weakening the Z-disk.
3) T h e disappearance of electron density of the M-lines.
4) T h e loss of transversal alignment of Z-disks and M-lines.
5) Complete loss of Z-structure does not occur until after 10-15 days storage.
6) Muscle can be stretched to about the same length as in the pre-rigor state after a few days
ageing at 0-4 °C, but the stretching is not reversible.
7) Stretching breaks I-filaments from their junction with Z-disk.
8) Different fibre types have varying rates of Z disks degradation and the appearance of gaps
in I-Z junction also varies between fibre types.
9) In beef, red fibres' Z-disks are twice as thick as white fibres and are claimed to degrade at
a slower rate than white. This is also observed in pork and chicken muscles.
1.5.1 Degradation of Z-Disks
There appears to be confusion over the understanding that fragmentation of muscle fibres is due to
the Z-disk degradation. T h e Z-disk is composed mainly of a-actinin, but researchers have not
found fragments from this protein within the first 3-4 days at 2 ° C storage to confirm that the
Z-disks are being degraded. It is during this early postmortem period that rapid tenderisation, hence
proteolysis occurs (Dransfield, 1994; Uytterhaegen et al, 1994; Alarcon-Rojo and Dransfield,
1995; Taylor et al, 1995; Koohmaraie, 1996). It is only after 14 to 18 days of ageing that the
Z-disks lose structural integrity and density during storage at refrigerated temperature and b y then
m u c h of the tenderisation and major structural changes have already occuned (Ouali, 1990;
Koohmaraie, 1992; Taylor et al, 1995). Often it can be seen in electronmicrographs that the
Z-disks are still attached to one end of the I-filament w h e n there are breaks in the myofibrils (Penny,
1980; Taylor et al, 1995). There appears to be stronger evidence that the myofibrils do not break
1.5.2 Degradation of Contractile Filaments
T h e major myofibrillar proteins myosin and actin do not appear to degrade under refrigerated
storage. Myofibrillar protein degradation is often detectable b y sodium
dodecylsulfate-polyacrylamide gel electrophoresis ( S D S - P A G E ) immunoblotting using antibodies, but so far
there have not been any report showing that the major contractile proteins such as the myosin and
the actin are degraded at refrigerated temperature even after weeks of storage.
On the other hand, one of the most significant early findings is the degradation of myofibrillar
protein troponin-T and the appearance of smaller polypeptides, well recognised as a 30 k D a
component (Penny, 1980). T h e rate of disappearance of troponin-T (in beef) is over a range of
temperatures from 3-35 °C and conelates well with the rate of increase in tenderness
(Koohmaraie, 1992). If the understanding that muscle fragmentation occurs due to breaking in
the myofibrils, then h o w do w e explain the close conelation between the disappearance of
troponin-T and the increase in tenderness, if troponin-T is not part of the Z-disk but is attached to
the contractile proteins instead?
The disappearance of troponin-T during ageing of cold shortened muscles does not reduce
toughness (Koohmaraie, 1992) and it is also doubtful that the disappearance of troponin-T is
related to meat tenderness, apart from the fact that it is a good tenderness indicator (Ouali, 1990).
So the question is, if the disappearance of troponin-T is not directly related to tenderisation nor
has there been m u c h , if any, evidence to support the Z-disk degradation, what is happening during
early postmortem tenderisation?
1.5.3 Degradation of Cytoskeletal Proteins
Cytoskeletal proteins are those that give muscle fibres their structure and integrity (refer to muscle
structure in section 1.2). Important proteins such as nebulin, titin and N2 line proteins (the region
where titin and nebulin merge in the I-band), are also degraded during storage of beef (Taylor et
al, 1995). Both titin and nebulin extend through the I band where breaks in the myofibrils often occur during post-mortem storage. Titin runs along the whole length of the sarcomere attaching