Application of Data Mining Techniques in Higher
Education (With Special Reference to Improving
the Quality)
Amit Agnihitri1 & Bharat Mishra2 1
Research Scholor, MGCG Vishwavidyalaya, Chitrakoot (MP)
2
Dr. Bharat Mishra, Associate Professor, MGCG Vishwavidyalaya, Chitrakoot (MP) Abstract-Data mining is a powerful analytical tool that
enables educational institutions to better allocate resources and staff, proactively manage student outcomes, and improve the effectiveness of alumni development. With the ability to uncover hidden patterns in large databases, community colleges and universities can build models that predict, with a high degree of accuracy, the behaviour of population clusters. By acting on these predictive models, educational institutions can effectively address issues ranging from transfers and retention, to marketing and alumni relations. Data mining frameworks in educational systems are normally designed more for power and flexibility than for simplicity. Most of the data mining frameworks expect the users to possess a certain amount of expertise in order to find the right settings in education sector. India’s education system is often cited as one of the main contributors to the economic rise of India. The size of India’s higher education market is about $40 billion per year. Presently about 12.4 percent of students go for higher education from the country. If India were to increase that figure of 12.4% to 30%, then it would need another 800 to one thousand universities and over 40,000 colleges in the next 10 years. This paper presents the development and present scenario of higher education in India by analyzing the various data and also identifies the key challenges that India’s higher education sector is facing.
1.INTRODUCTION
Data mining is the process of discovering meaningful new correlations, patterns, and trends by sifting through large amounts of data stored in repositories and by using pattern recognition technologies as well as statistical and mathematical techniques” (Gartner Group, 2000). Data mining uses a combination of an explicit knowledge base, sophisticated analytical skills, and domain knowledge to uncover hidden trends and patterns. These trends and patterns form the basis of predictive models that enable analysts to produce new observations from existing data. Data Mining can be used in educational field to enhance our understanding of learning process to focus on identifying, extracting and evaluating variables related to the learning process of students (Han and Kamber, 2000; Pandey and Pal, 2011; Hijazi and Naqvi, 2006; Khan, 2005; Galit, 2007; Al-Radaideh et. al., 2006; Pandey and Pal, 2011; Ayesha et. al., 2010; Bray, 2007; Bhardwaj and Pal, 2011). Data mining techniques can be categorized according to the kind of knowledge to be mined. These kinds of knowledge include association rules, characteristic rules, classification rules, discriminant rules, clustering, evolution, neural network, decision trees, regression, nearest nehibourhood methods and deviation analysis.
Data mining is a powerful tool for academic intervention. Through data mining, a university could predict with 85 percent (Laun, 2004) accuracy which students will or will not graduate. The university could use this information to concentrate academic assistance on those students most at risk. In order to understand how and why data mining works, it’s important to understand a few fundamental concepts. First, data mining relies on four essential methods: Classification, categorization, estimation, and visualization. Higher education institutions can use classification for a comprehensive analysis of student characteristics, or use estimation to predict the likelihood of a variety of outcomes, such as transferability, persistence, retention, and course success. Classification identifies associations and clusters, and separates subjects under study.
2.PURPOSE OF EDUCATIONAL DATA MINING
Educational data mining uses many techniques such as decision tree, rule induction, neural networks, k-nearest neighbor, naïve Bayesian and many others. By using these techniques, many kinds of knowledge can be discovered such as association rules, classifications and clustering (Romero & Ventura, 2007; Romero et. al., 2008). The discovered knowledge can be used to offer a helpful and constructive recommendations to the academic planners in higher education institutes (educating physically challenged) to enhance their decision making process, to improve students’ academic performance and trim down failure rate, to better understand students’ behavior, to assist instructors, to improve teaching and many other benefits because now days the main objective of higher education institutions is to provide quality education to its students and to improve the quality of managerial decisions.
One way to achieve highest level of quality in higher education system is by discovering knowledge from educational data to study the main attributes that may affect the students’ performance. It is very difficult to find out teaching/learning errors in the class room where students multiple disabilities are resided. This research work will be definitely helpful to find out these difficulties occurred during teaching/learning process with physically challenged students
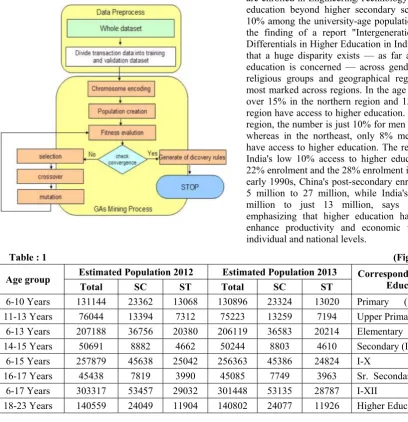
3.METHODOLOGY
generation). Genetic algorithm involves a population of individuals, each one represented by a finite string of symbols, known as the genome, encoding a possible solution in a given problem space. We evolved this population toward better solutions according to the rules of selection strategy, crossover and mutation. The details are as follows:
4.DATA PRE-PROCESSING
The training data set is pre processed by filters, here attribute selection filter is used, which is supervised filter that can be used to select attribute row and column. The main advantages in the given context are that most
of the data which are available in the data sources are labeled and they contain information about the student characteristics as well as the course management events where the modeling process can be applied in many ways. Experts define the curriculum relation degree between the different pedagogical items of database as a matrix E. Then we normalize elements of the matrix P by the given formula
The above formula is the fitness function of the dynamic question generation model, and its three constraints which are described as follows:
Indicates the difference between the degree of difficulty of selected test and the student difficulty level
Represents the degree of relevance between the selected questions and particular topics
Represents the concept relation degree of the (i-1) curriculum with the i curriculum in the constructed learning
α: Degree of competency
wj, 0< wj < 1 and 1 ≤ j ≤ M, weight of topic j. The sum of total wj is 1;
D, 0 ≤ D ≤ 1, competency level for each learner’s status, calculated for each test as:
((Student_Mark) /P)*wi, where P number of question in the test.
dk, 0 ≤ dk ≤ 1, degree of difficulty of test item Ik rj, 1 ≤ j ≤ M, relevance of association between
selected question and topic j. rj is 1 if select question is relevant to the topic j, 0, otherwise;
4.1 Encoding Method
In this study, a serial number is assigned to each curriculum from 1 to n if there are a total of n curriculums in the curriculum database for the learning path generation. Thus, the assigned serial number of each curriculum is combined directly with the serial number of the successive curriculum as strings to represent the generated learning path for the genetic algorithm. The whole individual represented by the chromosomes of all curriculum parameters for the genetic algorithm.
4.2 Initial population size
Generally, the initial population size can be determined according to the complexity of the solved problem. A larger population size will reduce the search speed of the GA, but it will increase the probability of finding a high quality solution. To construct a high quality learning path for an individual learner, the initial population size in this research is chosen as 50 for the generation of a personalized curriculum.
4.3 Fitness function:
The fitness function is a performance index that it is applied to judge the quality of the generated learning path for the GA. In order to generate a personalized learning path for an individual learner based on the pre-test results, the difficult parameters of the curriculum and the concept relation degrees of the curriculum must be considered simultaneously to determine the fitness function. In our method, the learning path constructed by the GA only considers the curriculum for which the learner gives incorrect pre-test results.
4.4 Selection operator
In the selection operation, the chromosome with the larger fitness function value will have a higher probability to reproduce the next generation. The aim of this operation is to choose a good chromosome to achieve the goal of gene evolution. The most commonly used method is Tournament Selection.
4.5 Crossover operation
Partially Mapped crossover operation is used. In this research, the probability of crossover is 0.7
4.6 Mutation operation
Inversion Mutation is used in this study. The inversion mutation (Chang et al., 2009) randomly selects a sub sequence, removes it from the sequence and inserts it in a randomly selected position. However, the sub sequence is inserted in a reversed order. Generally, a lower probability of mutation can guarantee the convergence of the GA, but it may lead to a poor solution quality. A higher probability of mutation may lead to the phenomenon of a random walk for the GA. In this research, the probability of mutation is set to be 0.1.
4.7 Stop criterion.
The genetic algorithm repeatedly runs the reproduction, crossover, mutation, and replacement operations until it meet the stop criterion. The stop criterion is set to be 100 generations, because this criterion can obtain satisfied learning paths for the individual learner
5.CURRENT STATUS OF HIGHER EDUCATION IN INDIA
Knowledge is the driving force in the rapidly changing globalized economy and society. Education general and higher education in particular, is a highly nation-specific activity, determined by national culture and priorities. The emergence of India as a knowledge-based service driven economy has made its human. According to the recent report of HRD ministry [6], presently about 12.4 percent of students go for higher education from the country. Quantity and quality of highly specialized human resources determine their competence in the global market. According to a recent government report [3] two-third of India’s colleges and universities are below standard. Capital its major strength and opportunity for growth. With 700 universities and more than 35,000 affiliated colleges enrolling more than 20 million students, Indian higher education is a large and complex system. The structure of degree-granting institutions is cumbersome primarily due to "affiliation" and funding sources.
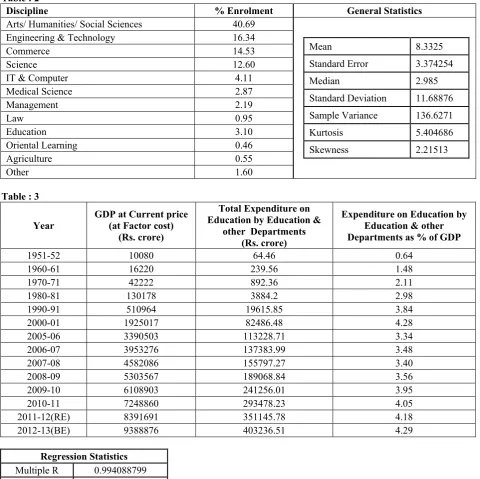
More than 85% of students are enrolled in bachelor's degree programs with majority enrolling in three-year B.A., B.Com. or B.Sc. degrees. One-sixth of all Indian students are enrolled in Engineering/Technology degrees. Access to education beyond higher secondary schooling is a mere 10% among the university-age population in India. This is the finding of a report "Intergenerational and Regional Differentials in Higher Education in India". The report says that a huge disparity exists — as far as access to higher education is concerned — across gender, socio-economic religious groups and geographical regions. The skew is most marked across regions. In the age group 22-35 years, over 15% in the northern region and 13% in the southern region have access to higher education. In the north-central region, the number is just 10% for men and 6% for women whereas in the northeast, only 8% men and 4% women have access to higher education. The report also compares India's low 10% access to higher education with China's 22% enrolment and the 28% enrolment in the US. Since the early 1990s, China's post-secondary enrolments grew from 5 million to 27 million, while India's expanded from 5 million to just 13 million, says the report, while emphasizing that higher education has the potential to enhance productivity and economic value both at the individual and national levels.
Table : 1 (Figure in '000)
Age group Estimated Population 2012 Estimated Population 2013 Corresponding Level of Education
Total SC ST Total SC ST
6-10 Years 131144 23362 13068 130896 23324 13020 Primary (I-V) 11-13 Years 76044 13394 7312 75223 13259 7194 Upper Primary VI-VIII)
6-13 Years 207188 36756 20380 206119 36583 20214 Elementary (I-VIII) 14-15 Years 50691 8882 4662 50244 8803 4610 Secondary (IX-X)
6-15 Years 257879 45638 25042 256363 45386 24824 I-X
16-17 Years 45438 7819 3990 45085 7749 3963 Sr. Secondary ( XI-XII) 6-17 Years 303317 53457 29032 301448 53135 28787 I-XII
Table : 2
Discipline % Enrolment General Statistics
Arts/ Humanities/ Social Sciences 40.69
Mean 8.3325
Standard Error 3.374254
Median 2.985
Standard Deviation 11.68876 Sample Variance 136.6271 Kurtosis 5.404686 Skewness 2.21513 Engineering & Technology 16.34
Commerce 14.53
Science 12.60
IT & Computer 4.11
Medical Science 2.87
Management 2.19
Law 0.95
Education 3.10
Oriental Learning 0.46
Agriculture 0.55
Other 1.60
Table : 3
Year GDP at Current price (at Factor cost) (Rs. crore)
Total Expenditure on Education by Education &
other Departments (Rs. crore)
Expenditure on Education by Education & other Departments as % of GDP
1951-52 10080 64.46 0.64
1960-61 16220 239.56 1.48
1970-71 42222 892.36 2.11
1980-81 130178 3884.2 2.98
1990-91 510964 19615.85 3.84
2000-01 1925017 82486.48 4.28
2005-06 3390503 113228.71 3.34
2006-07 3953276 137383.99 3.48
2007-08 4582086 155797.27 3.40
2008-09 5303567 189068.84 3.56
2009-10 6108903 241256.01 3.95
2010-11 7248860 293478.23 4.05
2011-12(RE) 8391691 351145.78 4.18
2012-13(BE) 9388876 403236.51 4.29
Regression Statistics
Multiple R 0.994088799 R Square 0.988212541 Adjusted R
Square 0.987230253 Std Error 374613.5707
ANOVA
df SS MS F Significance F
Regression 1 1.41E+14 1.41E+14 1006.031 6.08E-13
Residual 12 1.68E+12 1.4E+11
Total 13 1.43E+14
Coefficients Standard
Error t Stat P-value
Lower 95%
Upper 95%
This paper proposed a personalized curriculum generation approach based on GA module for personalized learning path. The proposed learning path generation approach can simultaneously consider the curriculum difficulty level and the sequence exercises in remedial education processes. Empirical study is used to indicate that the proposed approach can generate appropriate tutoring materials to learners based on individual learner requirements. This paper presented the development and present scenario of higher education in India by analyzing the various data and also identifies the key challenges like demand-supply gap, quality education, research and development and faculty shortage in India’s higher education sector through given statistical analysis.
REFERENCES
[1] Chang, Y.C. et al., (2009). "A Learning Style Classification Mechanism for ELearning," Computers & Education, vol. 53, pp. 273-285, 2009
[2] Adriaans Pieter and Zantinge Dolf (1996). Introduction to Data Mining and Knowledge Discovery, Third Edition (Potomac, MD: Two Crows Corporation, 1999); New York: Addison Wesley, 1996 [3] Ahmed S.R., (2004). Applications of data mining in retail business.
Information Technology: Coding and Computing, 2, 455–459. [4] AI-Radaideh Q. A., AI-Shawakfa E. W., and AI-Najjar M. I., (2006).
“Mining student data using decision trees”, International Arab Conference on Information Technology (ACIT'2006), Yarmouk University, Jordan, 2006.
[5] Anglano C., Giordana A. and Bello G., (1997). A network genetic algorithm for concept learning, Proceedings of the ICGA 97, pp. 431-441.
[6] Augier S., Venturini G. and Kodratoff Y, (1995) Learning first order logic rule with agenetic algorithm, Proceedings of the First international Conference on Knowledge Discovery and Data Mining, pp. 21-26.
[7] Ayesha Shaeela, Mustafa Tasleem, Sattar Ahsan Raza, Khan M. I., (2010). “Data mining model for higher education system”, Europen Journal of Scientific Research, Vol.43, No.1, pp.24-29.
[8] Bandyopadhyay, S., and Muthy, C.A. “Pattern Classification Using Genetic Algorithms”, Pattern Recognition Letters, (1995).Vol. 16, pp. 801-808.
[9] Berry M.J., Linoff G.,(1997). Data Mining Techniques for Marketing, Sales and Customer Support, John Wiley and Sons, New York, 1997.
[10] Bharadwaj B.K. and Pal S., (2011). “Data Mining: A prediction for performance improvement using classification”, International Journal of Computer Science and Information Security (IJCSIS),Vol. 9, No. 4, pp. 136-140.
[11] Brabazon A., and Keenan P.. (2004). A Hybrid Genetic Model for the Prediction of Corporate Failure. ComputationalManagement Science, 1 (3-4): 293-310.
[12] Bray M., (2007). The shadow education system: private tutoring and its implications for planners, (2nd ed.), UNESCO, PARIS, France, 2007.
[13] Carrier C. G., & Povel O. (2003). Characterising data mining software. Intelligent Data Analysis, 7, 181–192
[14] Chen M.S., Han J., Yu P.S., (1996). Data mining an overview from a database perspective. IEEE Transactions on Knowledge and Data Engineering 6, pp. 866–883
[15] Cios K.J., Pedrycz W., Swiniarski R.W.,(2000). Data Miming Methods for Knowledge Discovery, Kluwer Academic Publishers, Boston, MA, 2000.
[16] Frawley W., Piatasky-Saprio G., Matheus C., (1991). Knowledge Discovery in Data Bases: An Overview, AAAI/MIT Press, 1991 [17] Galit et. al, (2007). “Examining online learning processes based on
log files analysis: a case study”. Research, Reflection and Innovations in Integrating ICT in Education 2007.
[18] Goldberg D.E., (1989). Genetic algorithm in search, optimization and machine learning, Addison-Wesley, Reading, MA, 1989. [19] Han J., & Kamber M., (2006). Data Mining: Concepts and
Techniques (2nd ed.). Morgan Kaufmann, 2006
[20] Han J., and Kamber M. (2001). Data Mining: Concepts and Techniques, Morgan Kaufmann Publishers, 2001.
[21] Hijazi S. T., and Naqvi R. S., (2006). “Factors affecting student‟s performance: A Case of Private Colleges”, Bangladesh e-Journal of Sociology, Vol. 3, No. 1.
[22] Holland J.H., (1975). Adaption in natural and artificial systems, The University of Michigan Press, Ann Arbor, 1975.
[23] Kennedy J., and Eberhart R., (1995). Particle Swarm Optimization, Proc. IEEE Int. Conf. on Neural Networks (Perth, Australia), IEEE Service Center, Piscataway, NJ. 1995, 4: 1942-1948.
[24] Khan Z. N., (2005). “Scholastic achievement of higher secondary students in science stream”, Journal of Social Sciences, Vol. 1, No. 2, pp. 84-87, 2005..
[25] Lin P. C., and Chen J. S.. (2008). A Genetic-Based Hybrid Approach to Corporate Failure Prediction. International Journal of Electronic Finance, 2 (2): 241-255
[26] Liu J. L., and Lin J. H (2007). Evolutionary Computation of Unconstrained and Constrained Problems Using a Novel Momentum-type Particle Swarm Optimization. Engineering Optimization, 39 (3): 287-305.
[27] Mark, J., Embrechts. (2005). Introduction to Scientific Data Mining: Direct Kernel methods & Applications, Computationally Intelligent Hybrid Systems: The Fusion of Soft Computing and Hard Computing, Wiley , New York, pp. 317-365
[28] Mitra, S., Pal, S. K., & Mitra, P. (2002). Data mining in soft computing framework: A survey. IEEE Transactions on Neural Networks, 13, 3–14.
[29] Olson D., and Shi Y,. (2008). Introduction to Business Data Mining, McGraw-Hill Education, 2008
[30] Pandey U.K., and Pal S., (2011). “A Data mining view on class room teaching language”, (IJCSI) International Journal of Computer Science Issue, Vol. 8, Issue 2, pp. 277-282.
[31] Romero C. and Ventura S. (2007) ‘Educational data Mining: A Survey from 1995 to 2005’, Expert Systems with Applications (33), pp. 135-146.
[32] Romero, C., Ventura S. and Garcia E., (2008) ‘Data mining in course management systems: Moodle case study and tutorial’, Computers & Education, vol. 51, no. 1, pp. 368-384.
[33] Shaw M.J., Subramaniam C., Tan G.W., & Welge M.E. (2001). Knowledge management and data mining for marketing. Decision Support Systems, 31, 127–137.
[34] Shi Y., and Eberhart R., (1998). A Modified Particle Swarm Optimization, in Proc. of IEEE International Conference on Evolutionary Computation (ICEC), pp. 69-72.
[35] Yao X. and Liu Y., (1997). A new evolutionary system for evolving artificial neural networks, IEEE Transactions on Neural Network 8 (1997), no. 3, 694-713.
[36] Luan Jing (2000). Data Mining Applications in Higher Education, SPSS products DMHEWP-1004