International Journal of Nanomedicine
Dove
press
O r I g I N a l r e s e a r c h
open access to scientific and medical research
Open access Full Text article
Formulation development and optimization
of palm kernel oil esters-based nanoemulsions
containing sodium diclofenac
Malahat rezaee1
Mahiran Basri1,2
raja Noor Zaliha raja
abdul rahman3
abu Bakar salleh3
Naz chaibakhsh4
roghayeh abedi Karjiban2
1Institute of Bioscience, 2Faculty of
science, 3Faculty of Biotechnology and
Biomolecular science, Universiti Putra Malaysia, serdang, selangor, Malaysia;
4Faculty of science, University of
guilan, rasht, Iran
correspondence: Mahiran Basri Department of chemistry, Faculty of science, Universiti Putra Malaysia, 43400 UPM serdang, selangor, Malaysia Tel +603 894 6 7266
Fax +603 894 6 6997
email [email protected]
Abstract: Response surface methodology was employed to study the effect of formulation composition variables, water content (60%–80%, w/w) and oil and surfactant (O/S) ratio (0.17–1.33), as well as high-shear emulsification conditions, mixing rate (300–3,000 rpm) and mixing time (5–30 minutes) on the properties of sodium diclofenac-loaded palm kernel oil esters-nanoemulsions. The two response variables were droplet size and viscosity. Optimization of the conditions according to the four variables was performed for preparation of the nano-emulsions with the minimum values of particle size and viscosity. The results showed that the experimental data could be sufficiently fitted into a third-order polynomial model with multiple
regression coefficients (R2) of 0.938 and 0.994 for the particle size and viscosity, respectively.
Water content, O/S ratio and mixing time, quadrics of all independent variables, interaction between O/S ratio and mixing rate and between mixing time and rate, as well as cubic term of
water content had a significant effect (P,0.05) on the particle size of nanoemulsions. The linear
effect of all independent variables, quadrics of water content and O/S ratio, interaction of water content and O/S ratio, as well as cubic term of water content and O/S ratio had significant effects
(P,0.05) on the viscosity of all nanoemulsions. The optimum conditions for preparation of
sodium diclofenac nanoemulsions were predicted to be: 71.36% water content; 0.69 O/S ratio; 950 rpm mixing rate, and 5 minute mixing time. The optimized formulation showed good stor-age stability in different temperatures.
Keywords: response surface methodology, nanoemulsions, palm kernel oil esters, optimization, particle size, viscosity
Introduction
Nonsteroidal anti-inflammatory drugs (NSAIDs) belong to a group of drugs that are most commonly used for the alleviation of pain, fever, and inflammation. NSAIDs are nonselective cyclooxygenase inhibitors, which show a slightly preferential inhibitor activity for cyclooxygenase-2, while many of them prevent cyclooxygenase-1 and cause gastric damage.1,2 Sodium diclofenac is commonly used and is especially
effec-tive in the controlling of severe conditions of inflammation and pain, musculoskeletal disorders, arthritis, and dysmenorrhea.
Although it is one of the best-tolerated classical NSAIDs, like other drugs in this category, it can cause gastrointestinal adverse effects.1 In order to overcome the drug’s
adverse effects, high hepatic first-pass metabolism, and the short biological half-life, the development of a transdermal nanodelivery system like nanoemulsion is beneficial. Formulation as nanoemulsion is one of the nanoscience approaches that has been progressively considered in pharmaceutical science.3
International Journal of Nanomedicine downloaded from https://www.dovepress.com/ by 118.70.13.36 on 23-Aug-2020
For personal use only.
Number of times this article has been viewed
This article was published in the following Dove Press journal: International Journal of Nanomedicine
Dovepress
rezaee et al
An emulsion is formed by the dispersion of one liquid, usually the oil phase in another immiscible liquid, water phase. In comparison to other oils, palm kernel oil esters (PKOEs) contain higher amounts of shorter chain esters, which can be applied in micro- and nanoemulsion systems as a carrier for actives. Conversely, palm oil esters contain lon-ger chain esters and can be used as emollient in formulation. Furthermore, the higher iodine and saponification values, as well as lower slip melting point of PKOEs in comparison to other esters, provide some favorable properties for micro- and nanoemulsions in many applications.4,5
Nanoemulsions are a type of emulsion with particle sizes ranging from 20 nm to 500 nm. They may appear to be transparent or translucent mixtures of the oil phase, aqueous phase, surfactant(s), and cosurfactant(s) that create oil-in-water (O/W) or oil-in-water-in-oil emulsions.6 Due to their small
particle size and very good stability, nanoemulsions have unique properties as they are protected against flocculation, coalescence, aggregation, and Ostwald ripening. Their physi-cochemical properties give them some advantages for their usage in many practical applications such as in personal care and cosmetics,7 as well as in agrochemical,8 food,9 chemical,10
and pharmaceutical applications.11,12
For nanoemulsion non-equilibrium systems, extrinsic energy is necessary. There are two main methods used to prepare nanoemulsions: condensation or low-energy meth-ods, and dispersion or high-energy methods. In high-energy methods, the applied energy is achieved by high-shear stir-ring, high-pressure homogenizers, or ultrasound generators.13
High-energy emulsification methods result in emulsions that have the highest level of homogeneous flow and adjustable control of droplet size; thus, they are suitable for industrial purposes. Furthermore, in these methods, the apparatus sup-ply energy to produce the fine emulsions from a large variety of materials in the shortest time.14 However, despite the
for-mation mechanism, the properties of the prepared nanoemul-sions are influenced by formulation compositions.15–17
In this work, formation of nanoemulsions in the PKOEs/ lecithin (L):Cremophor® EL (Cr EL) (Sigma-Aldrich, St
Louis, MO, USA)/water system was studied with respect to the effect of composition and its preparation variables. Optimization through an experimental design was carried out. The experimental design employed allowed the study of the effect of variables alone, as well as their interactions; which is contrary to the conventional approach used for experimentation.18 This type of experiment evaluates the
effect of one factor at a time, while the remaining factors are held constant.6,18 The experimental design used in this
study was response surface methodology (RSM), which is an efficient statistical and mathematical tool used for the modeling and analysis of processes that exist between the independent factors and their responses, and for optimization of the processes or products.19–21
For the transdermal delivery of nanoemulsions containing drugs, minimization of the particle size as well as reductions in viscosity exhibit faster release of active ingredients and enhance drug permeation.22–24 Although it has been found
that viscosity is important for the stability and efficiency of drug release, there are few reports on the effect of various factors on nanoemulsion viscosity, or its optimization in pharmaceutical research.
There are a number of studies that examined the dominat-ing factors that determine the particle size of nanoemulsions. The studies were performed by considering the concentra-tion of the internal phase of the emulsion, as well as the concentration of the surfactant, the cosurfactant, or other compositions.16,25,26 However, fewer investigations have
been done on optimizing the processing parameters. It is advantageous to develop a model to study and optimize the processing conditions, such as time and rate in high-energy methods, to avoid spending extra time and energy, particu-larly in industrial applications.
The present work aims to study the critical factors involved in the processing conditions and formulation compositions that control the particle size and viscosity in nanoemulsions. The alternative aim is to optimize the conditions for the preparation of sodium diclofenac-loaded nanoemulsions with the smallest particle size and the lowest viscosity by RSM, as well as to study the optimized nano-emulsions under different storage temperatures.
Materials and methods
Materials
PKOEs were prepared in our laboratory. Soyabean L (Lipoid S75) was purchased from Lipoid GmbH (Ludwigshafen, Germany), and used without further purification. Cr EL and sodium diclofenac were obtained from Sigma-Aldrich and Santa Cruz Biotechnology (Dallas, TX, USA), respectively. Water used in this study was double-distilled water (Milli-Q deionized water; EMD Millipore, Billerica, MA, USA).
construction of phase diagram
A pseudo-ternary phase diagram was constructed using differ-ent proportions of the PKOEs which were added to the mixture of L:Cr EL with a ratio of 60:40. An appropriate 5% (w/w) by weight of water was added to the samples; the altered weight
International Journal of Nanomedicine downloaded from https://www.dovepress.com/ by 118.70.13.36 on 23-Aug-2020
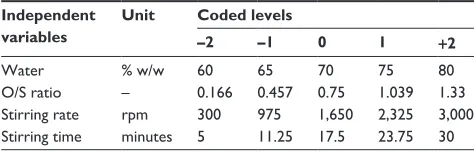
Table 1 range of variables and their levels used in rsM design
Independent variables
Unit Coded levels
–2 –1 0 1 +2
Water % w/w 60 65 70 75 80
O/s ratio – 0.166 0.457 0.75 1.039 1.33
stirring rate rpm 300 975 1,650 2,325 3,000
stirring time minutes 5 11.25 17.5 23.75 30
Abbreviations: rsM, response surface methodology; O/s, oil and surfactant; % w/w, percentage weight/weight; rpm, revolutions per minute.
Dovepress Palm kernel oil esters-based nanoemulsions
of the system was recorded. The mixtures were vortexed for 10 minutes using Vortex Mixer Model VTX-3000 L (LMS, Tokyo, Japan), and then centrifuged using centrifuge Z200A (Hermle, Wehingen, Germany) at 4,000 rpm for 15 minutes. The phase changes of the samples were determined visually through cross-polarized light. The above steps were done at room temperature. The phase diagram was constructed using the Chemix version 3.5 phase diagram plotter (Parallels®
Software International, Inc, London, UK).
Nanoemulsion preparation
O/W nanoemulsions selected from the isotropic phase were prepared by continuous addition of the aqueous phase at 25°±2°C to the surfactants–oil mixture. The final concentra-tion of sodium diclofenac in the nanoemulsions was 1.0 wt% dissolved in water as an aqueous phase. L was dissolved in the oil phase (PKOEs) at 50°C for 30 minutes. Cr EL was added to the mixture and homogenized under simple stirring. The aqueous phase was then added dropwise into the oil phase to attain an equilibrium state. The resultant emulsions were then homogenized by a high-shear stirrer (IKA®; RW 20 Digital,
Nara, Japan). After the homogenization, the nanoemulsions were collected and kept overnight to equilibrate. Then, their particle size and viscosity were analyzed.
Particle size measurements
Sympatec GmbH Nanophox particle size analyzer (Clausthal- Zellerfeld, Germany) with Photon Cross Correlation Spectrometer (Sympatec GmbH) was used to determine the mean droplet size of the nanoemulsions at 25°C. The samples were diluted approximately 200 times with deionized water, and then were loaded into 1 cm2 cuvettes in a thermostated
chamber. The scattering intensity measurements were achieved at angles of 90°.
Viscosity measurement
Viscosity measurements were performed using Kinexus Rotational Rheometer (Malvern Instruments Ltd, Malvern, UK). The measurements were carried out at temperatures of 25.0°C±0.5°C at a 5-second−1 shear rate. Data points are the
average of the two measurements for each sample.
experimental design
A four-factor, five-level central composite rotatable design (CCRD) was used to determine the effect of water content (x1) (60%–80%, w/w), oil and surfactant ratio (x2) (0.17–1.33), mixing rate (x3) (300–3,000 rpm), and mixing time (x4) (5–30 minutes) on particle size (Y1) and viscosity (Y2) of the
nanoemulsions. The following equation is used to calculate the total number of the designed experiments:
N = 2k+ 2k + n
0, (1)
where k is the number of independent variables and n0 is the number of repeated measurements at the center point.27
A total of 30 experimental runs according to the CCRD were generated using the Design-Expert version 6.0.6 (State-Ease, Inc, Minneapolis, MN, USA); the experimental runs included 16 factorial points, eight axial points, and six center points. The center point was repeated six times to achieve a proper evaluation of the experimental error. The independent vari-ables and their levels are shown in Table 1.
The scheme of the central composite design is listed in Table 2. A third-order polynomial equation was used to represent the particle size (Y1) and viscosity (Y2) of the nanoemulsions as a function of the independent variables as follows:
Y a a xi i a x a x a x x
i
ii i i
iii i i
ij i j j i i
= + + + +
= = = = = +
∑
∑
∑
∑
0 1 4
2
1 4
3
1 4
1 4
1 3
∑
∑
∑
∑
∑
∑
+ +
+ +
= +
= = = +
a x x a x x
a x x x
iij i j j i
i
ijj i j i i
ijk i j k
j
2
1 4
1 3
2
1 4
1 3
ee
k j j i=
∑
= +∑
= +∑
1 4
1 1 3
1 2
(2)
where Y is the dependent variable, a0 is a constant; ai, aii, aiii and aij are the linear, quadratic, cubic, and interactive coef-ficient, respectively; and e is the error of the model.
statistical analysis
The experimental data were analyzed to fit the third-order polynomial equation to all the independent variables. Analysis of variance (ANOVA) and R2 (coefficient of
determination) statistics were performed to evaluate the significant differences between the independent variables. Nonsignificant terms (P.0.05) were removed from the initial model to achieve a significant model. Then, the experimental
International Journal of Nanomedicine downloaded from https://www.dovepress.com/ by 118.70.13.36 on 23-Aug-2020
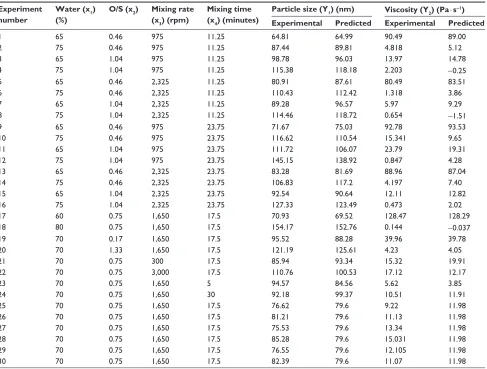
Table 2 scheme of the central composite design: independent, predicted, and experimental values of the response variables
Experiment number
Water (x1) (%)
O/S (x2) Mixing rate (x3) (rpm)
Mixing time (x4) (minutes)
Particle size (Y1) (nm) Viscosity (Y2) (Pa ⋅ s-1)
Experimental Predicted Experimental Predicted
1 65 0.46 975 11.25 64.81 64.99 90.49 89.00
2 75 0.46 975 11.25 87.44 89.81 4.818 5.12
3 65 1.04 975 11.25 98.78 96.03 13.97 14.78
4 75 1.04 975 11.25 115.38 118.18 2.203 −0.25
5 65 0.46 2,325 11.25 80.91 87.61 80.49 83.51
6 75 0.46 2,325 11.25 110.43 112.42 1.318 3.86
7 65 1.04 2,325 11.25 89.28 96.57 5.97 9.29
8 75 1.04 2,325 11.25 114.46 118.72 0.654 −1.51
9 65 0.46 975 23.75 71.67 75.03 92.78 93.53
10 75 0.46 975 23.75 116.62 110.54 15.341 9.65
11 65 1.04 975 23.75 111.72 106.07 23.79 19.31
12 75 1.04 975 23.75 145.15 138.92 0.847 4.28
13 65 0.46 2,325 23.75 83.28 81.69 88.96 87.04
14 75 0.46 2,325 23.75 106.83 117.2 4.197 7.40
15 65 1.04 2,325 23.75 92.54 90.64 12.11 12.82
16 75 1.04 2,325 23.75 127.33 123.49 0.473 2.02
17 60 0.75 1,650 17.5 70.93 69.52 128.47 128.29
18 80 0.75 1,650 17.5 154.17 152.76 0.144 −0.037
19 70 0.17 1,650 17.5 95.52 88.28 39.96 39.78
20 70 1.33 1,650 17.5 121.19 125.61 4.23 4.05
21 70 0.75 300 17.5 85.94 93.34 15.32 19.91
22 70 0.75 3,000 17.5 110.76 100.53 17.12 12.17
23 70 0.75 1,650 5 94.57 84.56 5.62 3.85
24 70 0.75 1,650 30 92.18 99.37 10.51 11.91
25 70 0.75 1,650 17.5 76.62 79.6 9.22 11.98
26 70 0.75 1,650 17.5 81.21 79.6 11.13 11.98
27 70 0.75 1,650 17.5 75.53 79.6 13.34 11.98
28 70 0.75 1,650 17.5 85.28 79.6 15.031 11.98
29 70 0.75 1,650 17.5 76.55 79.6 12.105 11.98
30 70 0.75 1,650 17.5 82.39 79.6 11.07 11.98
Abbreviations: O/s, oil and surfactant; rpm, revolutions per minute.
Dovepress
rezaee et al
data were refitted to check the variation of data around the fitted model (lack of fit).28
For better visualization of the effect of the independent variables on the response, surface response, and contour plots of the fitted polynomial regression equations were generated. The optimal conditions for producing the desired nanoemulsion formulations were generated using the software’s numerical optimization function.
stability study
Stability of the optimized nanoemulsion formulation was studied by determining the changes in particle size and sur-face charge of the formulation through storage at 4°C and 25°±1°C after its preparation.
Zeta potential analysis
The surface charge of the nanoemulsion formulation was measured using the Zetasizer Nano Series from Malvern
Instruments at 25°C. The nanoemulsion formulations were diluted to the proper concentration with deionized water. A folded capillary electrophoresis cell was used to deter-mine the surface charge. The zeta potential was calculated by measuring the electrophoretic mobility of the dispersed particles in a charged field.
Results and discussion
Pseudoternary phase diagram
and variable screening
Figure 1 depicts the pseudoternary phase diagram of PKOEs/ L:Cr EL (60:40)/water system at 25°C±2°C. The resulting phases observed were the isotropic phase, homogenous phase, two-phase region, and three-phase region. The major isotropic phase was located at the water-rich corner in the pseudoternary phase diagram at 50% of water and above. The levels of the variables, such as water content and the O/S ratio, were selected with regards to their ability to produce
International Journal of Nanomedicine downloaded from https://www.dovepress.com/ by 118.70.13.36 on 23-Aug-2020
Dovepress Palm kernel oil esters-based nanoemulsions
90
10
Water
20 30 40 50 60 70 80 90
80 70
60 50
40 30
20 10
L:Cr EL (60:40)
(w/w%) Homogenous
(w/w%)
(w/w%)
90
80
70
60
50
40
30
20
10
PKOEs Isptropic
2 phase 3 phase
Figure 1 Pseudo-ternary phase diagram of PKOes/l:cr el (60:40)/water.
Note: cremophor® el (sigma-aldrich, st louis, MO, Usa).
Abbreviations: PKOes, palm kernel oil esters; l, lecithin; cr el, cremophor® el.
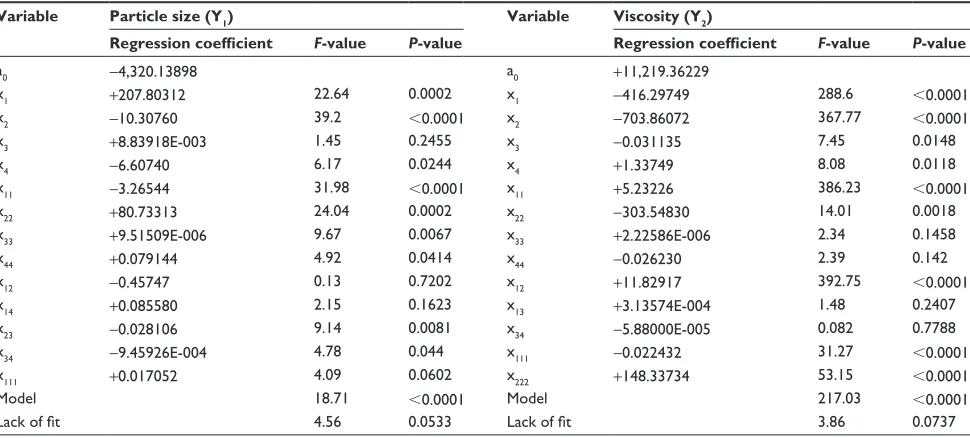
Table 3 Analysis of variance of the regression coefficients of the fitted cubic equations for the particle size (Y1) and viscosity (Y2) of the nanoemulsions
Variable Particle size (Y1) Variable Viscosity (Y2)
Regression coefficient F-value P-value Regression coefficient F-value P-value
a0 −4,320.13898 a0 +11,219.36229
x1 +207.80312 22.64 0.0002 x1 −416.29749 288.6 ,0.0001
x2 −10.30760 39.2 ,0.0001 x2 −703.86072 367.77 ,0.0001
x3 +8.83918e-003 1.45 0.2455 x3 −0.031135 7.45 0.0148
x4 −6.60740 6.17 0.0244 x4 +1.33749 8.08 0.0118
x11 −3.26544 31.98 ,0.0001 x11 +5.23226 386.23 ,0.0001
x22 +80.73313 24.04 0.0002 x22 −303.54830 14.01 0.0018
x33 +9.51509e-006 9.67 0.0067 x33 +2.22586e-006 2.34 0.1458
x44 +0.079144 4.92 0.0414 x44 −0.026230 2.39 0.142
x12 −0.45747 0.13 0.7202 x12 +11.82917 392.75 ,0.0001
x14 +0.085580 2.15 0.1623 x13 +3.13574e-004 1.48 0.2407
x23 −0.028106 9.14 0.0081 x34 −5.88000e-005 0.082 0.7788
x34 −9.45926e-004 4.78 0.044 x111 −0.022432 31.27 ,0.0001
x111 +0.017052 4.09 0.0602 x222 +148.33734 53.15 ,0.0001
Model 18.71 ,0.0001 Model 217.03 ,0.0001
Lack of fit 4.56 0.0533 Lack of fit 3.86 0.0737
the isotropic phase. A preliminary study was carried out to evaluate the levels of the other two independent variables (mixing rate and mixing time).
Fitting the models
The response surface models were applied to predict the vari-ation of the average particle size and viscosity as a function of the emulsion compositions and preparation variables of sodium diclofenac-loaded nanoemulsions. Table 2 presents the particle size and viscosity values of the nanoemulsions which resulted from all the experiments.
The coefficients of the cubic polynomial equation were calculated via the experimental data and were used to predict the particle size and viscosity values of the nanoemulsions. The predicted values showed a satisfactory agreement with the experimental ones gained from the RSM design. Fitting the data to various models and their subsequent ANOVAs illustrated that the aliased cubic model had higher coefficients for the responses of particle size and viscosity. The response surface analysis showed that the third-order polynomial response model that was applied for viscosity had a higher coefficient value (R2=0.994) when compared to the
response surface model for particle size (R2=0.938).
Table 3 depicts the regression coefficients, F-value, and
P-value of the four factors and their comparative importance
on particle size and viscosity. In the regression equation, a positive value illustrates an efficacy level, which advocates that the optimization was due to a synergistic effect, while an opposing effect or an inverse relationship between the factor and the response were expressed as negative values.29
A larger F-value and a smaller P-value for each term in the models would demonstrate the effect of the higher degree of significance on the dependent factors.3
The coefficient estimates and respective P-values shown in Table 3 indicated that all the four independent variables (water content [x1], O/S ratio [x2], mixing rate [x3], and mixing time [x4]) on the variation of viscosity and all the independent variables (except mixing rate on the variation of particle size) had significant effects (P,0.05). Upon closer observation, in the linear term of the cubic polynomial model,
International Journal of Nanomedicine downloaded from https://www.dovepress.com/ by 118.70.13.36 on 23-Aug-2020
Dovepress
rezaee et al
the O/S ratio had the most significant effect (P.0.05) on the variability of both responses that followed by water content. All quadratic terms had significant effects on the particle size. The quadratic term of water content had the most significant effect on the particle size and viscosity; however, the effect of mixing rate and mixing time were not significant for viscosity. The interaction between the O/S ratio and the mix-ing rate and the interaction between mixmix-ing rate and mixmix-ing time in addition to cubic term of water had significant effects (P,0.05) on the particle size of nanoemulsions. For the viscosity variation, interactions of water content and the O/S ratio and the cubic term of water content and the O/S ratio were significant on the response. However, the remaining terms showed insignificant effects (P.0.05).
The final third-order polynomial equations of the model (based on the coded values) for particle size and viscosity are as follows, respectively:
Particle size = +79.17 + 12.33 X1+9.42 X2+ 1.83 X3
+ 3.75 X4+ 7.85 X12+ 6.85 X
22+ 4.23 X32 + 3.10 X42− 0.62 X
1x2+ 2.63 X1x4 − 5.50 X2x3− 4.00 X3x4+ 2.17 X13, (3)
Viscosity = +11.98 − 20.87 X1− 23.55 X2− 1.94 X3
+ 2.02 X4+ 13.04 X12+ 2.48 X
22+ 1.01 X32 − 1.02 X42+ 17.21 X
1x2+ 1.06 X1x3 − 0.25 X3x4− 2.80 X13+ 3.66 X
23. (4)
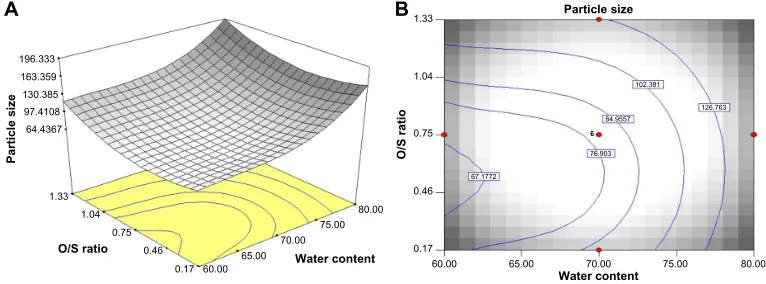
response surface analysis
Surface response and contour plots of the cubic polynomial model were produced to visualize the effect of the indepen-dent factors on the depenindepen-dent ones. To achieve this purpose, two of the independent variables were varied within the
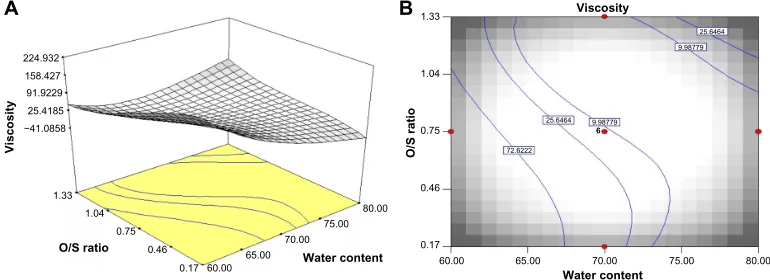
experimental range, while the other parameters were held constant at the central point. Figures 2 and 4 were gener-ated by varying the water content and the O/S ratio in the nanoemulsions, while the mixing rate and mixing time were held constant at 1,650 rpm and 17.50 minutes, respectively. Figures 3 and 5 were generated by varying the mixing rate and the mixing time while holding the water content and the O/S ratio at 70% and 0.75, respectively.
As shown in Figure 2, the particle size increased with increases in the water content. Increasing the water eliminates the rigid film and leads to the coalescence of the droplets and increases in particle size.21 The results showed that
increas-ing the O/S ratio from 0.17 to 0.5 resulted in a decrease in droplet size, but further increases in the O/S ratio resulted in increases in the particle size of the nanoemulsions. Formation of emulsions is influenced by an equivalency between two main mechanisms, namely droplet disruption and droplet coalescence.30 At higher O/S ratios, there was not enough
surfactant for the existence of oil or water content. In this manner, surfactant concentration is low enough to adsorb onto the surface of the newly formed droplets, and it can thus break down the oil droplets to smaller sizes during the emulsification process.21 The surfactant concentration could
control the total droplet surface area, the rate of droplet dispersion, and coalescence.21,31 This result is in agreement
with the results of Chanana and Sheth.32
Figure 3 depicts the interaction between mixing rate and mixing time on the particle size of nanoemulsions. Although, the mixing rate was not significant (P.0.05) on particle size, the interaction of mixing rate and mixing time showed a significant effect. Increasing the applied power of high-shear stirring increases the shear force which, in turn, decreases the droplet size of the emulsion.21 However, the
196.333 163.359 130.385 97.4108 64.4367
1.33 1.04
0.75 0.46
0.17 60.00 65.00 70.00
Water content
Water content Particle size
75.00 80.00
0.17
60.00 65.00
67.1772
76.903 84.9557
102.381 126.763
6
70.00 75.00 80.00
0.46 0.75 1.04 1.33
O/S ratio
O/S ratio
Particle size
B A
Figure 2 response surface and contour plots of the particle size of the nanoemulsions showing the interaction between two parameters (water content and O/s ratio) at the mixing rate of 1,650 rpm and 17.50 minutes.
Notes: (A) response surface; (B) contour plots.
Abbreviation: O/s, oil and surfactant.
International Journal of Nanomedicine downloaded from https://www.dovepress.com/ by 118.70.13.36 on 23-Aug-2020
Dovepress Palm kernel oil esters-based nanoemulsions
128.333 115.384 102.435 89.4858 76.5367
30.00 23.75
17.50 11.25
5.00 300.00 975.00
1650.00
Mixing rate
Mixing rate Particle size
2325.00 3000.00
5.00
300.00 975.00
76.903 102.381
79.3046 84.9557
102.381
6
1650.00 2325.00 3000.00 11.25
17.50 23.75 30.00
Mixing time
Mixing tim
e
Particle size
B A
Figure 3 response surface and contour plots of the particle size of the nanoemulsions showing the interaction between two parameters (mixing rate and mixing time) at the water content level of 70% and O/s ratio of 0.75.
Notes: (A) response surface; (B) contour plots.
Abbreviation: O/s, oil and surfactant.
224.932 158.427 91.9229 25.4185 −41.0858
1.33 1.04
0.75 0.46
0.17 60.00 65.00
70.00
Water content
Water content Viscosity
75.00 80.00
0.17
60.00 65.00
72.6222
25.6464 9.98779
9.98779 25.6464
6
70.00 75.00 80.00
0.46 0.75 1.04 1.33
O/S ratio
O/S ratio
Viscosity
B A
Figure 4 response surface and contour plots of the viscosity of the nanoemulsions showing the interaction between two parameters (water content and O/s ratio) at the mixing rate of 1,650 rpm and the mixing time of 17.50 minutes.
Notes: (A) response surface; (B) contour plots.
Abbreviation: O/s, oil and surfactant.
results depicted that the smallest particle size of 76 nm could be obtained at the mixing rate of 1,200 rpm and at the time of 10 minutes. Further increases in particle size were observed at higher mixing rates, which could create some destabilization mechanisms such as coalescence and sedimentation, resulting in a larger final particle size. A similar result was observed between emulsion droplet size and mixing rate for nano-emulsions consisting of Tween 20/Span 20 and liquid paraf-fin.6 The formation of larger droplets during longer mixing
times (.10 minutes) could be ascribed to the effect of over-processing of the emulsification, which would lead to coalescence. A similar result was obtained for emulsification of the nanoemulsions using an ultrasonic method.21,33
Figure 4 shows the response surface and contour plot of interaction between water content and the O/S ratio on the nanoemulsion viscosity. It was found that the viscosity of the nanoemulsions decreased with increases in water content, and it also decreased with increases in the O/S ratio at water content levels less than 75%. The viscosity
of nanoemulsions is a function of their ingredients such as the surfactant, water, and oil, and their concentrations. Increasing the water content leads to a decrease in viscos-ity.34 Decreases in viscosity by increasing the O/S ratio
could be due to decrease in the hydrodynamic interaction between the droplets. Increasing the O/S ratio results in an increase in the droplet size; thus, the mean separation dis-tance between the droplets increases, and this then results in decreases in viscosity.32,35,36
Figure 5 depicts the interaction of mixing rate and mix-ing time on viscosity of the nanoemulsions. The increase in mixing rate led to a decrease in viscosity. However, viscosity increased with an increase in mixing time. The decrease in the viscosity with an increase in the mixing rate could be due to the production of the larger particle sizes, which were due to coalescence and the effect of over-processing the emulsifica-tion with higher shear force.21 As mentioned before, increases
in particle size and increases in the mean separation distance between the droplets could result in decreases in viscosity.
International Journal of Nanomedicine downloaded from https://www.dovepress.com/ by 118.70.13.36 on 23-Aug-2020
Dovepress
rezaee et al
Optimization of conditions
and model validation
The optimum conditions for preparing sodium diclofenac-loaded nanoemulsions would be considered if the minimum values of the particle size and viscosity were achieved. Optimization was performed by the software numerical optimization function. The optimum sodium diclofenac-loaded nanoemulsion was achieved by the combined level of 71.36% water, 0.69 O/S ratio, a mixing rate of 950 rpm, and a mixing time of 5 minutes. Based on the optimum for-mulation, the predicted values for the responses of average particle size and viscosity were computed to be 78.11 nm and 5.49 Pa ⋅ s–1, respectively. Table 4 shows the
compari-son between the experimental and predicted data obtained from the CCRD final reduced models. To check the com-petence of the response surface equations, predicted and experimental values of the responses were compared. The sodium diclofenac nanoemulsion was prepared under the optimum combination levels, and the experimental values showed the average particle size and viscosity of 79.85 nm and 5.04 Pa ⋅ s–1, respectively. The proximity of the
experi-mental and predicted values demonstrated the high validity and adequacy of the model.
stability study
Figure 6 shows the changes in average droplet size and surface charge of the optimized sodium diclofenac nanoemulsions during storage at 4°C and 25°C. A slight increase in average
droplet size was observed during the storage period of 90 days (Figure 6A). In the study, the variation of droplet size ranged from 79.85–93.42 nm at 4°C and was from 79.85–85.62 nm at 25°C. Two main processes controlled the final particle size of an emulsion: droplet break-up and coalescence.30 The
good stability of the nanoemulsion formulation could be due to the steric stabilizing effect of the nonionic emulsifier (L and Cr EL), which formed a thick steric barrier around the particles to prevent flocculation and coalescence. The existence of some free emulsifier in the micellar form plays a basic role in preventing coalescence after emulsification and storage, which results in improved emulsion stabiliza-tion.3 The increase in viscosity of the continuous phase is the
other factor that could improve the stability of the emulsion by restraining the Brownian movement of the droplets in the disperse phase.3
Despite of the low viscosity of the optimized nano-emulsion (as a desired condition for optimization of for-mulation), the result of particle size and surface charge measurements indicated that the optimized nanoemulsion presented good physical stability throughout the 90 days of the storage period. In essence, it is hypothesized that the oil–water interfaces that are formed are in a stable state against coalescence, which is achieved through surfactant adsorption. Sufficient amounts of L and Cr EL could cover the interface formed in the breakup prior to coalescence.
Figure 6B shows the zeta potential values of the opti-mized formulations during the storage time. The droplets
21.4497 16.925 12.4003 7.87563 3.35093
30.00 23.75
17.50 11.25
5.00 300.00 975.00
1650.00
Mixing rate
Mixing rate Viscosity
2325.00 3000.00
5.00
300.00 975.00
7.78966 14.596
11.4757
11.4757
6
1650.00 2325.00 3000.00 11.25
17.50 23.75 30.00
Mixing time
Mixing tim
e
Viscosity
B A
Figure 5 response surface and contour plots of the viscosity of the nanoemulsions showing the interaction between two parameters (mixing rate and mixing time) at the water content level of 70% and the O/s ratio of 0.75.
Notes: (A) response surface; (B) contour plots.
Abbreviation: O/s, oil and surfactant.
Table 4 Optimum condition for the preparation of sodium diclofenac nanoemulsion
Optimal conditions Particle size (nm) Viscosity (Pa ⋅ s-1)
Water (%) O/S Mixing rate (rpm) Mixing time (minutes) Experimental Predicted Experimental Predicted
71.36 0.69 950 5 79.85 78.11 5.04 5.49
Abbreviations: O/s, oil and surfactant; rpm, revolutions per minute.
International Journal of Nanomedicine downloaded from https://www.dovepress.com/ by 118.70.13.36 on 23-Aug-2020
Dovepress Palm kernel oil esters-based nanoemulsions
of the prepared sodium diclofenac-loaded nanoemulsions were found to be negatively charged. The zeta potential was approximately –57 to –58 and –57 to –60 at 4°C and 25°C, respectively. A slight increase in the absolute zeta potential was observed during the storage time.
The negative charges on the droplets could be contributed from the adsorption of sodium diclofenac in the aqueous phase at the oil–water interface. It has been reported that an increase in the surface charge can improve the stability of emulsions. This is due to increases in the repellent force between the droplets that resulted in higher stability against flocculation and coalescence.37
Conclusion
The study shows that the third-order polynomial model was effectively applied to explain and predict the responses of the particle size and viscosity of sodium diclofenac-loaded nanoemulsions. The independent variables of water content, O/S ratio and mixing time, the quadrics of all variables and interaction between the O/S ratio and the mixing rate, and between mixing rate and time, and the cubic term of water content had significant effects on the particle size of the nanoemulsions. Concurrently, the linear effect of all independent
variables, quadrics, and cubics term of water content and the O/S ratio, as well as the interaction between water content and the O/S ratio had significant effects on the viscosity of the nanoemulsions. The numerical optimization method was applied to attain the best emulsifying conditions, and the optimum conditions for preparing the nanoemulsion formulation was predicted to be: water content of 71.36%; O/S ratio of 0.69; mixing rate of 950 rpm; and a mixing time of 5 minutes. The optimized formulation showed good stability over time.
Disclosure
The authors report no conflicts of interest in this work.
References
1. Sintov AC, Botner S. Transdermal drug delivery using microemulsion and aqueous systems: influence of skin storage conditions on the in vitro permeability of diclofenac from aqueous vehicle systems. Int J Pharm. 2006;311(1–2):55–62.
2. Escribano E, Calpena AC, Queralt J, Obach R, Doménench J. Assessment of diclofenac permeation with different formulations: anti-inflammatory study of a selected formula. Eur J Pharm Sci. 2003;19(4):203–210.
3. Tang SY, Manickam S, Wei TK, Nashiru B. Formulation devel-opment and optimization of a novel Cremophore EL-based nanoemulsion using ultrasound cavitation. Ultrason Sonochem. 2012;19(2):330–345.
4. Keng PS, Basri M, Zakaria MRS, et al. Newly synthesized palm esters for cosmetics industry. Ind Crops Prod. 2009;29(1):37–44.
5. Salim N, Basri M, Rahman MB, Abdullah DK, Basri H. Modification of palm kernel oil esters nanoemulsions with hydrocolloid gum for enhanced topical delivery of ibuprofen. Int J Nanomedicine. 2012;7: 4739–4747.
6. Pey CM, Maestro A, Solé I, González C, Solans C, Gutiérrez JM. Optimization of nano-emulsions prepared by low-energy emulsification methods at constant temperature using a factorial design study. Colloids Surf A Physicochem Eng Asp. 2006;288(1–3):144–150.
7. Teo BS, Basri M, Zakaria MR, Salleh AB, Rahman RN, Rahman MB. A potential tocopherol acetate loaded palm oil esters-in-water nano-emulsions for nanocosmeceuticals. J Nanobiotechnology. 2010; 8:4.
8. Wang L, Li X, Zhang G, Dong J, Eastoe J. Oil-in-water nanoemul-sions for pesticide formulations. J Colloid Interface Sci. 2007;314(1): 230–235.
9. Silva HD, Cerqueira MA, Vicente AA. Nanoemulsions for food appli-cations: development and characterization. Food Bioprocess Technol. 2012;5(3):854–867.
10. Ragupathy L, Ziener U, Robert G, Landfester K. Grafting polyacrylates on natural rubber latex by miniemulsion polymerization. Colloid Polym Sci. 2011;289:229–235.
11. Calderó G, García-Celma MJ, Solans C. Formation of polymeric nano-emulsions by a low-energy method and their use for nanoparticle preparation. J Colloid Interface Sci. 2011;353(2):406–411.
12. Machado AH, Lundberg D, Ribeiro AJ, et al. Preparation of calcium alginate nanoparticles using water-in-oil (W/O) nanoemulsions. Langmuir. 2012;28(9):4131–4141.
13. Solè I, Maestro A, Gonzalez C, Solans C, Gutiérrez JM. Optimization of nano-emulsion preparation by low-energy methods in an ionic surfactant system. Langmuir. 2006;22(20):8326–8332.
14. Solans C, Izquierdo P, Nolla J, Azemar N, Garcia-Celma MJ. Nano-emulsions. Curr Opin Colloid Interface Sci. 2005;10(3–4):102–110.
0
0
−80 −60 −40 −20 0 20 40 60
Particl
e size (nm)
Zeta potential
(mV)
80 100 120 A
B
20 40
Day
Day
60 80
0 20 40 60 80
4˚C 25˚C
4˚C 25˚C
Figure 6 storage stability of the nanoemulsions at different temperatures.
Notes: (A) average droplet size of sodium diclofenac nanoemulsions during storage time at 4°c and 25°c; (B) average zeta potential values of sodium diclofenac nanoemulsions during storage time at 4°c and 25°c.
International Journal of Nanomedicine downloaded from https://www.dovepress.com/ by 118.70.13.36 on 23-Aug-2020
International Journal of Nanomedicine
Publish your work in this journal
Submit your manuscript here: http://www.dovepress.com/international-journal-of-nanomedicine-journal
The International Journal of Nanomedicine is an international, peer-reviewed journal focusing on the application of nanotechnology in diagnostics, therapeutics, and drug delivery systems throughout the biomedical field. This journal is indexed on PubMed Central, MedLine, CAS, SciSearch®, Current Contents®/Clinical Medicine,
Journal Citation Reports/Science Edition, EMBase, Scopus and the Elsevier Bibliographic databases. The manuscript management system is completely online and includes a very quick and fair peer-review system, which is all easy to use. Visit http://www.dovepress.com/ testimonials.php to read real quotes from published authors.
Dovepress
Dove
press
rezaee et al
15. Tcholakova S, Denkov ND, Danner T. Role of surfactant type and concentration for the mean drop size during emulsification in turbulent flow. Langmuir. 2004;20(18):7444–7458.
16. Amani A, York P, Chrystyn H, Clark BJ, Do DQ. Determination of factors controlling the particle size in nanoemulsions using Artificial Neural Networks. Eur J Pharm Sci. 2008;35(1–2):42–51.
17. Yuan JS, Yip A, Nguyen N, Chu J, Wen XY, Acosta EJ. Effect of surfactant concentration on transdermal lidocaine delivery with linker microemulsions. Int J Pharm. 2010;392(1–2):274–284.
18. Zu Y, Zhang Y, Zhao X, Zhang Q, Liu Y, Jiang R. Optimization of the preparation process of vinblastine sulfate (VBLS)-loaded folate-conjugated bovine serum albumin (BSA) nanoparticles for tumor-targeted drug delivery using response surface methodology (RSM). Int J Nanomedicine. 2009;4:321–333.
19. Hao J, Fang X, Zhou Y, et al. Development and optimization of solid lipid nanoparticle formulation for ophthalmic delivery of chloram-phenicol using a Box-Behnken design. Int J Nanomedicine. 2011;6: 683–692.
20. Yuan Y, Gao Y, Mao L, Zhao J. Optimisation of conditions for the
preparation of β-carotene nanoemulsions using response surface
methodology. Food Chem. 2008;107(3):1300–1306.
21. Li PH, Chiang BH. Process optimization and stability of D-limonene-in-water nanoemulsions prepared by ultrasonic emulsification using response surface methodology. Ultrason Sonochem. 2012;19(1): 192–197.
22. Cross SE, Jiang R, Benson HA, Roberts MS. Can increasing the viscos-ity of formulations be used to reduce the human skin penetration of the sunscreen oxybenzone? J Invest Dermatol. 2001;117(1):147–150. 23. Tsai YH, Chang JT, Chang JS, Huang CT, Huang YB, Wu PC. The
effect of component of microemulsions on transdermal delivery of buspirone hydrochloride. J Pharm Sci. 2011;100(6):2358–2365. 24. Fang JY, Hwang TL, Leu YL. Effect of enhancers and retarders on
percutaneous absorption of flurbiprofen from hydrogels. Int J Pharm. 2003;250(2):313–325.
25. Moreno MA, Ballesteros MP, Frutos P. Lecithin-based oil-in-water microemulsions for parenteral use: pseudoternary phase diagrams, characterization and toxicity studies. J Pharm Sci. 2003;92(7): 1428–1437.
26. Park KM, Kim CK. Preparation and evaluation of flurbiprofen-loaded microemulsion for parenteral delivery. Int J Pharm. 1999;181(2): 173–179.
27. Lee A, Chaibakhsh N, Rahman MBA, Basri M, Tejo BA. Optimized enzymatic synthesis of levulinate ester in solvent-free system. Ind Crops Prod. 2010;32(3):246–251.
28. Ebrahimpour A, Abd Rahman RN, Ean Ch’ng DH, Basri M, Salleh AB. A modeling study by response surface methodology and artificial neural network on culture parameters optimization for thermostable lipase production from a newly isolated thermophilic Geobacillus sp. Strain ARM. BMC Biotechnol. 2008;8:96.
29. Woitiski CB, Veiga F, Ribeiro A, Neufeld R. Design for optimization of nanoparticles integrating biomaterials for orally dosed insulin. Eur J Pharm Biopharm. 2009;73(1):25–33.
30. Tadros T, Izquierdo P, Esquena J, Solans C. Formation and stability of nano-emulsions. Adv Colloid Interface Sci. 2004;108–109:303–318. 31. Forgiarini A, Esquena J, González C, Solans C. Formation and stability
of nano-emulsions in mixed nonionic surfactant systems. Prog Colloid Polym Sci. 2001;118:184–189.
32. Chanana GD, Sheth BB. Particle size reduction of emulsions by for-mulation design-II: effect of oil and surfactant concentration. PDA J Pharm Sci Technol. 1995;49(2):71–76.
33. Lin CY, Chen LW. Emulsification characteristics of three- and two-phase emulsions prepared by the ultrasonic emulsification method. Fuel Processing Technology. 2006;87(4):309–317.
34. Lovelyn C, Attama AA. Current state of nanoemulsions in drug delivery. J Biomater Nanobiotechnol. 2011;2(5A):626–639.
35. Pal R. Shear viscosity behavior of emulsions of two immiscible liquids. J Colloid Interface Sci. 2000;225(2):359–366.
36. Asano Y, Sotoyama K. Viscosity change in oil/water food emulsions prepared using a membrane emulsification system. Food Chem. 1999;66(3):327–331.
37. Liu W, Sun D, Li C, Liu Q, Xu J. Formation and stability of paraffin oil-in-water nano-emulsions prepared by the emulsion inversion point method. J Colloid Interface Sci. 2006;303(2):557–563.
International Journal of Nanomedicine downloaded from https://www.dovepress.com/ by 118.70.13.36 on 23-Aug-2020