University of South Carolina
Scholar Commons
Theses and Dissertations
6-30-2016
Quantum Dot Metrics for Preparative Chemistry
and Fluorescence Applications
Yi Shen
University of South Carolina
Follow this and additional works at:https://scholarcommons.sc.edu/etd
Part of theChemistry Commons
This Open Access Dissertation is brought to you by Scholar Commons. It has been accepted for inclusion in Theses and Dissertations by an authorized administrator of Scholar Commons. For more information, please [email protected].
Recommended Citation
Shen, Y.(2016).Quantum Dot Metrics for Preparative Chemistry and Fluorescence Applications.(Doctoral dissertation). Retrieved from
QUANTUM DOT METRICS FOR PREPARATIVE CHEMISTRY AND
FLUORESCENCE APPLICATIONS
by
Yi Shen
Bachelor of Science Nanjing University, 2010
Submitted in Partial Fulfillment of the Requirements
For the Degree of Doctor of Philosophy in
Chemistry
College of Arts and Sciences
University of South Carolina
2016
Accepted by:
Andrew B. Greytak, Major Professor
Richard D. Adams, Committee Member
Brian C. Benicewicz, Committee Member
Christopher T. Williams, Committee Member
ii
iii
DEDICATION
This work is dedicated to:
My parents, Jin Shen & Xiaomei Song
and
My wife, Ying Zheng
iv
ACKNOWLEDGEMENTS
I always dreamed of this moment. When you have almost finished your study, you
can sit down and spend some time to look back through the entire five years. It has been a
great part of my life. I have learned a lot about knowledge, partnership and leadership. I
have been supported by a lot of people from this big Carolina Family and I truly want to
thank all of them.
First and foremost, I want to express my greatest appreciation to my advisor Dr.
Andrew B. Greytak. He is absolutely an ideal professor for a young ambitious chemist. He
taught me not only what to do, but also how to think. I believe the hardest time of my PhD
study was at the end of my second year when I decided to change my research focus from
the electronic application of quantum dots to nanomaterials’ surface chemistry study.
Andrew showed great patience during that period of time, and guided me to get started into
a new area. I still remembered the first party we had in his house, he asked me “Have you
seen Star Wars yet?”; I said “No.”; and then he said “Oh, come on, you should definitely
watch it. This is America!” To be honest, I still have not finished watching the whole series
yet, but I think I have found my Master Yoda.
I want to acknowledge my committee group: Dr. Richard Adams, Dr. Brian
Benicewicz and Dr. Christopher Williams. Dr. Adams is a great professor in class and role
model for all the young chemists. The light from his office is always one of the biggest
v
and an extremely knowledgeable professor. The bioimaging work shown here would never
have been possible without his insightful suggestions. Dr. Williams gave me a lot of advice
during my proposal defense. It is a great honor to have these three professors as my
committee members. I also want to give thanks to my collaborators Dr. Anand Viswanath,
Warren Steckle from Dr. Benicewicz’s group and Dr. Xia Zhao from Dr. Qian Wang’s
group. I learned a lot of polymer chemistry / biochemistry knowledge while working with
them.
I would like to appreciate the Greytak group members, who has provided
tremendous help in the past five years. Dr. Rui Tan is an inorganic synthetic chemist /
Matlab genius and he helped me a lot on the nanocrystal fabrication / Matlab coding.
Megan Gee started to collaborate with me since the first day she joined the lab and has
always been a great support in the past three years. I will always cherish the memory when
we worked together to get reproducible results on the ITC machine. Stephen Roberts and
Adam Roberge are two talented hardworking young graduate students. I really enjoyed
working with both of them. Pravin Paudel, Bobby Barker and Preecha Kittikhunnatham
worked on a different area in our group, but have provided a lot of suggestions during my
PhD study. Christopher Pinion, Colin Johnson and Abigail Loszko are the undergraduates
in our group, who have also contributed to the projects described below.
As Andrew said, “Graduate school without a solid set of friends would be tough,”
I want to give thanks and my great gratitude to my friends during my time at USC for all
their help and friendship. To Haorui Wu, Jiuyang Zhang, Yu Feng, Weiwei Xu, Xueyang
Li, Ping Li, Lanlan Meng, Li Wang, Bing Gu, Qingfeng Zhang, Lichao Sun, Kangming
vi
encouragement that have supported me to overcome a lot of difficulties. To Dr. Soumitra
Ghoshroy and Dr. Jibin Zhao, I gained a lot under your kind guidance when I worked at
the Electron Microscopy Center. I also want to express my appreciation to Ryan Chen,
Helen Wang and Yijia Zhao. They are my friends from Business School and they showed
me another direction to look at the world.
Finally, I would like to thank my parents, Jin Shen and Xiaomei Song. They are the
best parents in the world. My father shared a lot of extremely valuable suggestions he
gained during his PhD study and I believe I will be benefitting from his words for my entire
life. My mother has a unique way to guide me with her wisdom to experience my own road
since I was a child, and the method is still functioning well. Without their unconditional
love and support, none of this would be possible.
My wife, Ying Zheng, is the most amazing person that I have ever known. She is
always my best friend and my cheer leader. Her support and encouragement are undeniably
the building block for my PhD study. Our marriage is the greatest happiness and
vii
ABSTRACT
Colloidal semiconductor quantum dots (QDs) are considered to be a promising
candidate for bio-imaging and solar cells because of their extraordinary photo-physical
properties. The ultimate goal of this dissertation is to design a reliable matrix and a
reproducible method to prepare QDs-based biocompatible probe for fluorescence
applications. Synthesis of quantum dots requires a large amount of ligands to improve the
stability at high temperature. However, for further application and surface modification of
QDs, excess ligands must be removed. In this dissertation, I will first describe using gel
permeation chromatography (GPC) as a media to purify different types of QDs. A more
systematic study of the tolerance of the GPC purification method against other nanocrystal
materials will also be addressed. I will further demonstrate that GPC can be used as a
reactor to perform solvent change and ligand exchange reactions with QDs. With the help
of GPC purification technique, well-isolated and characterized nanomaterials are prepared
to study the sequential chemistry of QDs. I specifically study the effect of neutral ligands
on the photo-physical properties of the QDs and their influence on the inorganic surface
overcoating (shell growth) reaction. This information is essential in preparing bio
-compatible QDs with high brightness and long term stability. The GPC purified QDs have
also been used to perform surface modification reactions with a range of polymeric
imidazole ligands (PILs). The PIL capped QDs display colloidal stability, low toxicity and
viii
envelope virus, has been labeled by these bio-compatible QDs and retained its infectious
ix
TABLE OF CONTENTS
Dedication ... iii
Acknowledge ... iv
Abstract ... vii
List of Tables ... xi
List of Figures ... xii
Chapter 1: Introduction to semiconductor quantum dots ...1
1.1 Introduction ...1
1.2 Synthesis of quantum dots ...2
1.3 Surface modification of quantum dots ...6
1.4 Quantum dots in bioimaging applications ...7
1.5 Thesis overview ...8
Chapter 2: Advances in the use of gel permeation chromatography (GPC) to nanocrystals: purification, solvent change and surface modification ...10
2.1 Introduction ...10
2.2Purification of CdSe and CdSe/CdZnS QDs ...13
2.3Purification of other nanomaterials in different shapes and with different capping ligands ...25
2.4 The excess ligands’ impact on further surface modification of QDs ...29
2.5 In situ solvent change with QDs on GPC ...34
2.6 In situ ligand exchange reaction with QDs on GPC ...38
x
2.8 Materials ...44
Chapter 3: Effect of neutral ligands on the photo-physical properties and shell formation of the quantum dots ...53
3.1 Introduction ...53
3.2 Quantum yield regeneration: Influence of neutral ligand binding on photo- physical properties in colloidal core/shell quantum dots ...55
3.3 Reducing competition by coordinating solvent promotes morphological control in alternating layer growth of CdSe/CdS core/shell quantum dots ...96
3.4 Conclusion ...107
Chapter 4: Fabrication of biocompatible QDs with methacrylate backbone polymeric imidazole ligands ...108
4.1 Introcution ...108
4.2 Preparation of methacrylate backbone polymeric imidazole ligand capped quantum dots with low toxicity and nonspecific binding ...110
4.3 Surface labeling of enveloped virus with polymeric imidazole ligands capped quantum dots via metabolic incorporation of phospholipid in host cell ...128
4.4 Conclusion ...143
References ...145
xi
LIST OF TABLES
Table 2.1 Summary of the mass remaining at different temperatures from TGA traces ..23
Table 3.1 Characterizations of QD samples used before and after GPC purification ...61
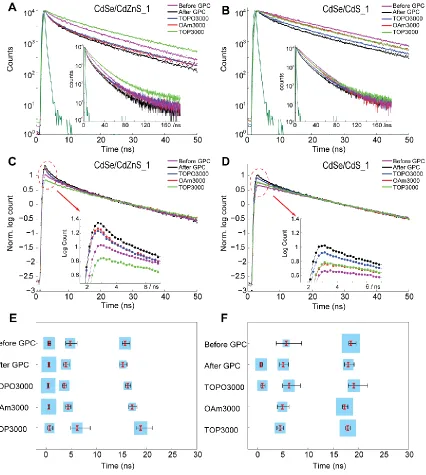
Table 3.2 Detailed lifetime values and relative population of the reconvolution fits on the PL decay curves shown in Figure 3.8E and 3.8F ...76
xii
LIST OF FIGURES
Figure 1.1 Reaction scheme for preparation of monodispersed colloidal QDs ...4
Figure 1.2 Scheme for growth of core/shell quantum dots via simultaneous addition and SILAR methods ...5
Figure 2.1 GPC traces of QDs and small molecule representative dye and stability
verification of core and core/shell QDs purified by GPC based on absorption spectra ....16
Figure 2.2 NMR spectra of the CdSe1 QD sample purified by different methods ...19
Figure 2.3 The 1H NMR spectrum of material separated from the CdSe1 QD sample
after the GPC purification, revealing the presence of ODE and OA ...20
Figure 2.4 DOSY spectra of CdSe1 samples in THF ...21
Figure 2.5 TGA curves of CdSe1 QDs purified by different methods ...23
Figure 2.6 Inductively-coupled plasma mass spectrometry (ICP-MS) analysis of the Cd and Se content in CdSe1_2PR and CdSe1_1GPC QD samples ...24
Figure 2.7 TGA curves of CdSe/CdZnS21PR and 1GPC QDs ...25
Figure 2.8 Purification study of different nanomaterials with different capping ligands .27
Figure 2.9 The TEM images of CdSe/CdS nanocrystals with different shapes and sizes 28
xiii
Figure 2.11 Absorption spectra and the lowest energy extinction peak position shift of the aliquots taken during the CdS shell growth titration experiment on CdSe1 QDs
purified by either 2PR or 1GPC ...30
Figure 2.12 Full width at half maximum (fwhm) of the emission peaks during the
titration experiment described in Figure 2.11 of the narrative ...32
Figure 2.13 Photographs and the QY of the QDs and cysteine mixtures during the ligand exchange ...35
Figure 2.1431P NMR of the sample before and after the GPC solvent change process ...37
Figure 2.15 In situ GPC ligand exchange diagram with the small molecules ...40
Figure 2.16 Ligand population study of the exchanged QDs prepared by different
methods ...41
Figure 2.17 In situ GPC ligand exchange diagram with macromolecules ...42
Figure 3.1 Absorption and fluorescence emission spectra of aliquots taken during the CdZnS and CdS overcoating processes ...60
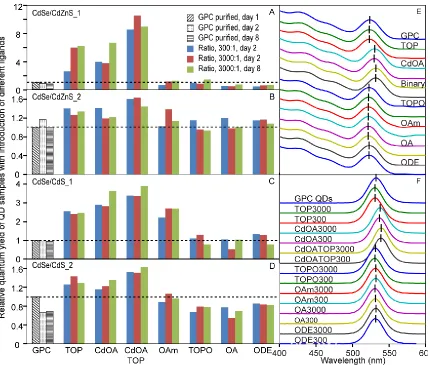
Figure 3.2 Quantum yield of CdSe/CdZnS_1, CdSe/CdZnS_2, CdSe/CdS_1 and
CdSe/CdS_2 QD samples ...61
Figure 3.3 Characterization of CdSe/CdZnS_1 sample before and after the GPC
purification ...62
Figure 3.431P NMR spectra of samples before and after the GPC purification with the
1H NMR shown in the insets for CdSe/CdZn S_2, CdSe/CdS_1 and CdSe/CdS_2 ...63
Figure 3.5 Absorption and relative emission spectra of the samples before and after the purification for CdSe/CdZnS_2, CdSe/CdS_1 and CdSe/CdS_2 ...64
xiv
Figure 3.7 Absorption spectra and emission spectra of the GPC purified CdSe/CdS_1
QDs after mixing with different ligands for 1 day ...69
Figure 3.8 Comparison of fluorescence lifetime decays for CdSe/CdZnS_1 and
CdSe/CdS_1 core/shell QDs before/after GPC purification and subsequently mixed with different ligands ...72
Figure 3.9 Fluorescence lifetime decays for CdSe/CdZnS_1 and CdSe/CdS_1 core/shell QDs after GPC and further mixed with CdOA/ODE...73
Figure 3.10 Comparison of fluorescence lifetime decays for CdSe/CdZnS_2 and
CdSe/CdS_2 core/shell QDs before/after GPC and further mixed with different ligands74
Figure 3.11 Fluorescence lifetime decays for CdSe/CdZnS_1 and CdSe/CdS_1
core/shell QDs after GPC purification, and then mixed with TOP at various time after introduction of TOP ...77
Figure 3.12 Reversibility test of CdOA regeneration process ...79
Figure 3.13 Reversibility test of TOP regeneration process ...80
Figure 3.14 Reversibility test of TOP regeneration process on CdSe/CdZnS_1 QDs and OAm regeneration process on CdSe/CdS_1 QDs ...81
Figure 3.15 DOSY spectra on 31P of free TOP/TOPO and TOP/TOPO mixing with
CdSe/CdZnS_1 sample with a 300 ligand-to-QD ratio ...84
Figure 3.16 ITC traces for CdSe/CdZnS_1 titrated with TOPO, OAm and TOP at the same concentrations ...86
Figure 3.17 Scaled absorption and emission spectra over the course of CdSe/CdS
core/shell QDs growth in three amines ...100
Figure 3.18 STEM images and radius histograms for CdSe cores, and core/shell samples
CdSe/CdS_OAM, CdSe/CdS_DOM, and CdSe/CdS_THM ...102
Figure 3.191H NMR for α-proton for the three amines studied in the presence and
xv
Figure 4.1 The TEM image and DLS measurement of GPC purified CdSe/CdZnS
QDs ...114
Figure 4.2 TEM images of aqueous CdSe/CdZnS QDs with different molecular weight polymeric imidazole capping ligands ...115
Figure 4.3 The DLS measurement of aqueous CdSe/CdZnS QDs with different
molecular weight polymeric imidazole capping ligands ...116
Figure 4.4 Quantum yield measurements of different molecular weight polymeric
imidazole ligand capped QDs ...116
Figure 4.5 Effect of MA-PIL QDs on cell viability ...119
Figure 4.6 Nonspecific binding of MA-PIL QDs to HUVEC monolayers ...120
Figure 4.7 Schematic illustration of the synthesis of PIL-QDs-DBCO, the azide labeling of measles virus assisted by host cells and the strategy for labeling virus with QDs via copper-free click chemistry ...130
Figure 4.8 The absorption and emission spectra of aliquots taken during the overcoating processes of CdSe/CdZnS QD samples ...132
Figure 4.9 The DBCO group on PIL-QDs-DBCO detected by absorbance measurement
using an azide dye ...132
Figure 4.10 The optical spectra and TEM image of PIL-QDs-DBCO in PBS ...133
Figure 4.11 TheCell viability assay of PIL-QDs-DBCO at different concentrations ....133
Figure 4.12 Characterization of the N3-MV and QD labeling of the Vero cells...135
1
CHAPTER 1
INTRODUCTION TO SEMICONDUCTOR QUANTUM DOTS
1.1. Introduction
Semiconductor nanocrystals, known as quantum dots (QDs), are roughly spherical pieces
of direct band-gap semiconductors with diameters on the order of 1-10 nm. The most
well-known examples are the II-VI, III-V and IV-VI binary and their alloyed materials such as
CdS, CdSe, InP and PbS. Compared with organic dyes, the QDs display a number of better
characteristics for fluorescence applications, namely (1) narrower emission coupled with
greater excitation cross-sections, (2) better photo-stability and high quantum yield, (3) most
importantly rationally tunable emission wavelengths1,2. The electronic characteristics
of quantum dots are determined by their size and shape. This means we can control the
color of the emission light given off by a quantum dot just by changing its size3.
The application of quantum dots can be grouped into two areas. When a photon is
absorbed, the QD will be excited and generate an electron-hole pair. If we allow the
electron and hole pair to recombine and emit a photon, we can use QDs in the labeling
techniques 2,4 or in the light emitting technology5,6. For example, QD Vision, a company
focusing on advancing the application of QDs, has commercialized the QD-embedded
Color IQ™ optical component, which can provide more natural viewing experience
through saturated color in display applications, such as TVs and monitors. On the other
hand, if we separate the electron and hole pair, we can apply the QDs in the solar cell1,7,8
2
group in studying QDs-based solar cells. According to their most recent study, they have
promoted the power conversion efficiency to 9.9%, which is the new record for QD-based
solar cells8.
1.2. Synthesis of quantum dots
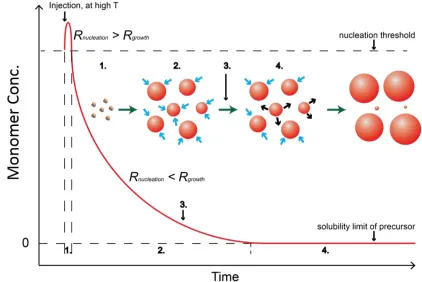
The most widely used procedure to prepare the binary QDs is the hot-injection
method11. In order to produce quantum dots with well-defined shapes (typically spherical)
with narrow size distribution, the reaction is kinetically controlled by running the system
at high temperature and quenching the reaction before the Ostwald ripening. As shown in
Figure 1.1, once the two precursors are mixed at high temperature, the concentration of
the monomers will rapidly increase. At the very beginning, the nucleation rate is much
faster than the growth rate, thus nuclei are formed during this process. Following
nucleation, when the monomer concentration has decreased lower than the nucleation
threshold where the reaction rate is slower than the growth rate, homogeneous growth of
particles is enforced. When the monomers are nearly consumed, the small particles may
start to dissolve, and redeposit onto larger particles. This process is known as the Ostwald
ripening, which significantly increases the size distribution of the mixture. Therefore, the
reaction should be quenched before the Ostwald ripening begins, for example by lowering
the reaction temperature.
A vast number of studies have been focused on developing the precursor chemistry
for hot-injection method over the past 20 years. In 1993, Bawendi’s lab first developed the
hot-injection method by using organometallics (such as dimethylcadmium) and
trioctylphosphine chalcogenide11. In 2001, Peng’s group advanced this technique by using
3
the toxic and unstable organometallics12. Then Cao’s group13 and Hens’ group14 changed
the chalcogenide precursor into chalcogen powders or chalcogen oxide, which shows better
control during the reaction. Most recently, Owen’s group has shown thioureas as another
alternative chalcogenide precursor to prepare QDs with high monodispersity15.
Researchers have also tried to reduce the reaction temperature by extending the reaction
time. Manna’s group16 and Owen’s group17 have shown that CdSe QDs can be prepared
from magic size clusters at 80 °C in 40 hours, but even now, the quality of the QDs prepared
at lower temperature is still not comparable with the samples prepared by hot-injection
method.
However, the quantum yield (QY) of the as-synthesized QDs is relatively low due
to the trap states generated by the dangling bonds present on the surface. In order to
optimize photo-physical properties of quantum dots, core/shell heterostructures have been
introduced and widely explored. The inorganic shell on the surface can eliminate the
dangling bonds and passivate both anionic and cationic surface sites simultaneously18. The
representatives for core/shell stucture samples are CdSe/CdS QDs19,20, CdSe/CdZnS QDs
21and InP/CdS QDs22.
In order to perform a successful shell growth experiment, the lattice mismatch
between the core and shell materials needs to be minimized. For example, since CdSe and
CdS have similar crystal structure, a giant CdS shell can be grown onto the CdSe core
sample23. While the lattice mismatch between CdSe and ZnS is relative large, people
normally grow an alloy CdxZn1-xS (note: in this dissertation, CdZnS represents the CdxZn
4
Figure 1.1 Reaction scheme for preparation of monodispersed colloidal QDs. Stage 1. Nucleation reaction; stage 2. Nanocrystal growth reaction; stage 3. Reaction quenching; stage 4. Ostwald ripening.
There are two strategies to perform shell growth over the QD core samples. The
first method is the simultaneous addition of the two precursors. For example, Bawendi’s
lab has shown by using cadmium oleate and octanethiol as the precursor, high quality
monodispersed round shape CdSe/CdS core/shell QDs are obtained24. Simultaneous
addition method has also been used to achieve anisotropic shell growth. Alivisato’s group25
and Manna’s group26 have shown that by changing the surfactants during the growth
process, CdSe/CdS nanorods and tetrapods can be prepared by addition of cadmium and
5
Figure 1.2 Scheme for growth of core/shell quantum dots via simultaneous addition and SILAR methods
The second method for shell growth is called Selective Ionic Layer Adhesion and
Reaction (SILAR). As shown in Figure 1.2, the idea is instead of injecting two precursors
at the same time, for each monolayer growth only one precursor is introduced at a time and
all available surface sites are saturated in each half cycle. This method was first proposed
by Peng’s group27 and has become widely used in preparation of binary structures in
solution. The advantage of this method is that (1) the isotropic growth is enforced and the
homogenous nucleation side reaction of the shell material is minimized; (2) the sample
shell thickness can be easily controlled by changing the amount of addition cycles during
SILAR shell growth process19. Additionally, as shown in a recent study from our group,
using a sub-monolayer equivalent in each cycle can increase the yield of the shell growth
reaction and reduce the influence of the nucleation side reaction20. Therefore, the majority
of the core/shell materials described in the dissertation are prepared by a SILAR method
6
1.3. Surface modification of quantum dots
The as-synthesized core only or core/shell QDs are capped with long hydrocarbon
ligands such as oleic acid. These capping ligands separate the particles from each other and
are crucial in maintaining the colloidal stability of the particles under synthetic conditions.
However, for both electronic application and bioimaging applications, the original ligands
are not ideal since they behave as an insulting layer and are not water-soluble. Therefore,
surface modification of the QDs is normally required for any QDs-based device / probes.
For electronic applications of QDs, the biggest requirement for surface
modification is to replace original surfactants with shorter ligands. Waston’s group has
shown that by shortening the distance between particles, the charge transfer efficiency is
dramatically improved28. In order to improve the stability of the QDs after the ligand
exchange, the binding affinity between the new ligands and QD surface must be high.
Therefore, new ligands bearing a strong nucleophilic anchoring group such as thiol and
amine are commonly used for the surface modification reactions. Representative ligands
in this group are pyridine29, mercaptopropionic acid30 and ethanediol31. Recently, Talapin’s
group has proposed to use inorganic ligands such as metal chalcogenide complex (MCC)
as an alternative surfactant to completely replace the insulating hydrocarbon chain32. They
further demonstrated that single atoms (like halide33 or chalcogenide34) can also be used to
passivate the surface sites and maintain the QDs colloidal stability.
To use QDs as a probe or sensor in a biological system, the QDs need to be
water-soluble. Besides, desirable QD properties such as high QY and small size are hoped to be
maintained. The most common ligands people have used for this purpose are mono-thiol
7
strength between mono-thiol ligands and the QD surface is not that strong and thiol ligands
are known to be photo unstable. In order to improve the stability of the exchanged sample
in aqueous solution, ligands with multiply binding groups / non-thiol based anchoring
groups have also been studied and this part will be further discussed in Chapter 4.
1.4. Quantum dots in bioimaging applications
As mentioned previously, the photo-physical properties of QDs make them
particularly attractive for use as luminescent biological probes. The emission wavelength
of lead chalcogenide based QDs is within the near-infrared (NIR) region, which makes
them exceedingly interesting for in vivo biological imaging36. In addition, the large
two-photon absorption cross section of QDs makes them attractive for multi-two-photon microscopy
application as well37.
In order to use QDs for selective labeling in bio-imaging applications, the linker
needs to have at least three different functional groups: one group to stabilize QDs in water;
one group providing binding ability with the QDs surface; and the last group for attachment
onto the biological target. So far, there are four common strategies to link QDs with specific
biological targets through different interactions / reactions. They are (1) avidin-biotin
bridging38; (2) coupling between carboxyl and amine groups;39 (3) metal affinity between
polyhistidine-appended biomolecules and metal-rich QDs;40 (4) azide-alkyne “click”
reactions41. With these specific functionalization onto the nanocrystal surface and
8
Some demonstrations of the conjugation of QDs with specific ligands targeting
biomolecular imaging applications are provided in the following examples. In an early
work from Bruchez’s group, they employed CdS/ZnS QDs encapsulated within an
amine-modified copolymer and coupled to streptavidin tospecifically label the cancer marker
Her2, actin filaments, and nuclear antigens4. Around the same time, Simon’s group
demonstrated the use of QD bioconjugates for long-term multicolor imaging of living
cells.43 Later, Nie’s group prepared water-soluble QDs encapsulated by a polymer bearing
the tumor-targeting ligands, and performed in vivo cancer targeting and imaging.43 Ting’s
group has shown that QDs can be tagged onto mammalian cell surface proteins.42 Cai’s
group has labeled the enveloped baculovirus with polymeric imidazole ligands (PILs)
capped QDs through a copper-free click reaction and maintained the virus infectivity41.
1.5. Thesis overview
The ultimate goal of this dissertation is to design a reliable matrix and a
reproducible method to prepare QDs-based biocompatible probe for fluorescence
applications. The first body of work, described in Chapter 2, demonstrates that gel
permeation chromatography (GPC) can be used as a media to purify a large variety of
nanomaterials with better efficiency and reproducibility. This is an essential step for further
surface modification since the impurities and excess ligands have negative impact on the
reactions. I further use GPC as a reactor to perform solvent change and ligand exchange
reactions with QDs, which shows better control and efficiency though the reaction process.
Chapter 3 is a study of the influence of neutral ligands effect on the photo-physical
9
growth) reaction. The ensemble quantum yield (QY) and lifetime components will be
changed upon introduction of ligands to purified QD surface. Strong binding ligands such
as trioctylphosphine tend to significantly restore the brightness in a reversible manner. The
neutral ligands are also involved in the shell growth reaction. Three different amines are
used to grow core/shell QDs by the SILAR method. Compared to strong binding primary
amine ligands, weakly associated tertiary amine can increase the yield of the reaction and
improve the quality of the synthesized particles. This information is essential in preparing
high quality core/shell QDs and designing new hydrophilic ligands to prepare high quality
QDs as biocompatible probes in fluorescence applications.
In Chapter 4, GPC purified QDs are used to perform surface modification reactions
for biological applications: a range of methacrylate backbone polymeric imidazole ligands
(MA-PILs) prepared by RAFT polymerization and post-modification were synthesized and
associated to the QD surface. These MA-PIL capped QDs provide water solubility,
colloidal stability, low toxicity and non-specific binding, and high brightness. These
bio-compatible QD samples are further used to label Measles virus, a model envelope virus.
The labeled virus retains its infectious ability against host cells, which demonstrates that
MA-PIL capped QDs have a potential to be widely used in areas of biolabeling and
10
CHAPTER 2
ADVANCES IN THE USE OF GEL PERMEATION CHROMATOGRAPHY (GPC) TO
NANOCRYSTALS: PURIFICATION, SOLVENT CHANGE AND SURFACE MODIFICATION
2.1 Introduction
Quantum dots (QDs) are coated with a layer of surfactant molecules (ligands) that provides
charge balance and colloidal stability. As-synthesized samples also contain unreacted
precursors as well as reaction byproducts, high boiling point solvent(s), and/or an excess
of ancillary ligands added to control growth and improve stability44–46. Applications almost
universally require purification and/or surface modification of the as-synthesized QDs: (1)
for optical applications, the as-synthesized QDs are not very bright, which requires the
formation of an inorganic shell to increase the quantum yield (QY);19,24,47,48 (2) for
bioimaging applications, surface modification by encapsulation or ligand exchange is
essential for water solubility;2,21,49 and (3) for electronic applications, excess ligands
adsorbed on the surface hinder the charge transfer between the QDs and receiving
substrates.50–52 Effective means for the isolation of QDs with well-defined surface
properties is essential to the applications of QDs in solution or assembled into matrices,
and is also a necessary condition for the development of sequential preparative chemistry
11
The traditional method for purification of QDs is a sequential precipitation and
redissolution (PR) process52,53. For the frequent case of QDs sterically stabilized by ligands
with long hydrocarbon tails in nonpolar phase (e.g., hexane, toluene, chloroform, or
tetrahydrofuran), flocculation of QDs is achieved by introducing anti-solvents (e.g.,
acetone, methanol, isopropanol) to increase the polarity of the solvent mixture. Impurities
that remain soluble can then be decanted away, and the QDs redissolved in a suitable
solvent.
While the PR method is convenient and scalable, it carries several limitations.
Fundamentally, the separation is based on solubility; for differently prepared batches of
QDs the necessary precipitation conditions are not identical since the intermolecular forces
governing the solubility of the as-synthesized QDs are not inherently controlled properties.
Some impurities may have solubility properties similar to the QDs, such that multiple PR
cycles are necessary for complete removal. From a practical perspective, in some cases,
the amounts of polar anti-solvents that are used are not tightly controlled, but even if these
procedures are performed systematically, the turbidity that is considered to represent
adequate precipitation of the QDs is often a subjectively determined parameter; this can
lead to run-to-run variability and present difficulties in adequately describing procedures
in literature. An important consideration for any QD purification method is the effect not
only on the amounts of unbound species remaining in the sample but also the effect on the
number and type of bound ligands that terminate the QD surface53. In the case of the PR
method, the introduction of a foreign solvent can perturb the QD surface by displacing
native ligands, as has recently been reported for the case of QDs purified by PR with
12
The strong dependence of the photo-physical properties55,56 and chemical
reactivity of QDs on the surface ligand population has helped to motivate increasing
interest in alternative nanoparticle purification methods57. One alternative to PR methods
is the use of biphasic extraction processes58; however, separation is still based on
differences in polarity. Other methods include ultracentrifugation of non-flocculated
samples59,60, electrophoretic deposition61,62, and chromatographic techniques38,63–65. The
relatively large size of QDs compared to small molecule impurities makes size-exclusion
chromatography (SEC) an attractive technique.
In the work described below, we have introduced a highly precise and effective gel
permeation chromatography (GPC) purification technique for QDs and other nanocrystals.
GPC is a type of SEC that operates with an organic mobile phase and is widely used in
characterization of macromolecules such as polymers. As with any SEC technique, GPC
employs a mobile phase that is a solvent for the mixture to be separated; the mixture passes
through a stationary phase and subsequently fractionates, with elution volumes that directly
correlate with the hydrodynamic size of the analytes. Colvin’s group63 and Roman’s
group65 have studied the application of SEC to reduce the size distribution of Cd-based
QDs in the organic and aqueous phases, respectively. Winnik’s group64,66 and Kanelidis et
al.67 have used SEC to separate QDs from excess polymers after surface modification.
Bawendi and co-workers have demonstrated the use of size-exclusion gel filtration
chromatography (GFC) to isolate QDs from dye molecules in the aqueous phase38,68, and
Biesta et al. have used GPC to separate Si nanoparticles from dye molecules in
13
isolate natively capped nanocrystals as the basis for further manipulations, nor has its
efficacy as a purification technique been compared directly to precipitation-based methods.
Initially I used GPC with a polystyrene stationary phase as a technique to purify
two types of as-synthesized nanoparticles: CdSe QDs and CdSe/CdxZn1−xS core/shell QDs.
Compared with the PR purified samples, the GPC purified QDs exhibited significantly
smaller ligand/QD ratios, similar stability at room temperature, and even better stability at
high temperature (toward precipitation and/or ripening). Then the tolerance of this
technique has been studied by testing a variety of nanoparticles with different shapes and
capping ligands. Furthermore, we demonstrate CdS shell growth on the same CdSe QDs
with different purification methods and cysteine ligand exchange on CdSe/CdxZn1−xS QDs
to reveal how impurities and excess ligands can alter the surface chemical reactions of the
QDs. Finally, GPC has been used as a reactor to perform solvent change and ligand
exchange reactions with different QD samples.
2.2 Purification of CdSe and CdSe/CdZnS QDs
2.2.1 Feasibility of QDs purification by GPC
We elected to use a polystyrene gel medium to study the purification of
hydrophobically-capped QDs. Previous authors have reported successful GPC of QDs
using such media.64 According to studies of GPC in the polymer area,70 strong ionic
interactions with the stationary phase tend to prevent metal containing polymers from
successfully travelling through the column. Therefore, before attempting to purify the QDs
14
particle-column interaction. The QD samples we used to test the efficacy of the column
were CdSe1 and CdSe/CdZnS1 as described in the Materials Section. Due to the difficulty
in visualizing the concentration of impurities and excess ligands separated from the QDs
solution, the dye alizarin was initially chosen to represent “small” molecules and we
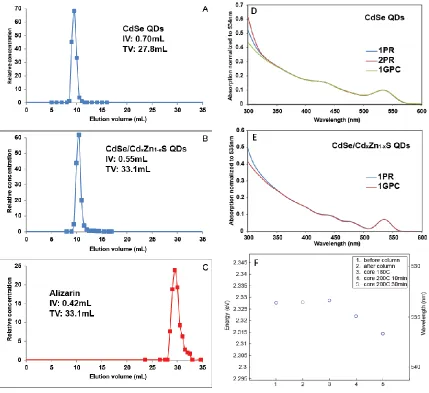
compared its chromatogram to that of the QDs. As shown in Figure 2.1A-C, the QDs exit
the column when the elution volume equals approximately 1/3 of the total volume of the
column (the expected void volume). Because the molecular weight operating range of the
SX-1 GPC medium is described by the manufacturer as 600 to 14000 and both CdSe QDs
and CdSe/CdxZn1-xS QDs are larger than that, the QDs do not spend any time in the pores
and elute quickly from the column. However, small molecules (such as impurities, excess
ligands or alizarin) should enter the pores more easily, which is expected to increase their
retention time relative to that of the QDs. Alizarin was eluted at a volume close to the total
volume of the column, thus indicating highly precise resolution from the QD samples.
The yield of the GPC column purification is always around 100% (CdSe1 QDs,
100.2%; CdSe/CdZnS1 QDs, 98.3%; alizarin, 101.4%), which avoids sample loss
associated with biphasic or PR purification processes. Additionally, the QDs elute in a tight
band (95% of the QDs sample flows out in 2 mL), which maintains the high concentration
of the QDs solution and improves the column separation resolution against the later eluting
impurities and excess ligands. After being rinsed with toluene following each purification
process, the column can be used more than 10 times and provide very comparable
purification results.
We also tested the stability of the QDs after GPC purification. According to
15
QDs maintain their absorption features after the GPC purification (there is a decrease in
relative absorbance in the UV range, which may be associated with the absorption spectrum
of impurities prior to purification). Since the absorption of the QDs is determined by their
size and size distribution, this confirms that QDs do not aggregate or etch during the GPC
purification process. At room temperature the 1GPC CdSe QDs are stable for more than 2
weeks when stored in toluene on the bench (we only continuously measured the absorption
spectrum for 2 weeks, the actual lifetime of the CdSe QDs may be much longer than this),
while the CdSe/CdxZn1-xS QDs began to slowly precipitate out from the solution after 1
day.
At high temperature, the CdSe1_1GPC sample demonstrated even better stability
than 2PR samples. In particular, purified samples were injected to a simulated shell growth
solvent of 1:2 oleylamine:ODE (v/v, 9 mL total) and heated up to high temperature. As
shown in Figure 2.1F, the first absorption peak position is almost fixed (or blueshifted
~1nm) when the temperature reaches 180°C, and then slowly redshifts after extended
heating at 200°C. This phenomenon is unlike the relatively larger blueshift (around 3-4nm)
that is frequently observed in PR purified QDs under similar conditions71, which might be
explained by the etching of QDs’ surface in the presence of excess ligands. The redshift
observed in Figure 2.1F upon extended heating may be a signature of Ostwald ripening.
2.2.2 Analysis of the GPC purified QDs: CdSe samples
The GPC purified CdSe1 QDs samples were characterized by 1H NMR to measure
the amount of organic solvents and ligands that remained. The 1PR and 2PR samples were
also characterized for comparison. Both ODE and oleic acid have resonances from their
16
them convenient as representative impurities and ligands whose presence and
concentration can be determined by NMR72–74.
17
The 1H NMR results shown in Figure 2.2 reveal two types of olefin features: sharp
peaks characteristic of the molecules in free solution, and a broadened peak that we
associate with molecules bound to (or in dynamic exchange with) the QD surface. The
spectrum in Figure 2.2A indicates that the 1PR sample still had a significant amount of
ODE. After one additional PR purification, the amount of ODE is shown to have been
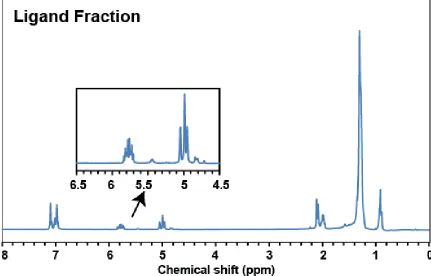
reduced but not completely removed. The 1GPC sample, on the other hand, shows a clean
spectrum with only a broadened (~50 Hz) olefin resonance in the 5 ppm to 6 ppm range.
We attribute this resonance to oleate species that are strongly interacting with the QD
surface; in what follows we will use “OA” to refer to oleate-based constituents of all types.
In order to have a better understanding of the ligand/QD ratio for samples with
different purification processes, THF was used as an internal standard in subsequent
quantitative 1H NMR measurements. The total concentration of the ligands can be
calculated based on the 1H NMR peak integrals; dividing by the QD concentration, as
determined by the absorption spectrum, gives the ligand/QD ratio in each sample. Taking
into account the uncertainty associated with the integration of the NMR peaks, we are able
to specify average ligand/QD ratios with a precision of ±5 ligands per QD (any inaccuracy
in the molar extinction coefficient of the QD batch would affect all samples by a constant
factor). The 2PR sample had an average 172 OA and 56 ODE per QD, while the 1GPC
sample had only 135 OA on the QD surface. We did not observe any sharp peaks in the 1H
NMR spectrum at the olefin region of OA, which suggests that there was no free OA in
either system. Consequently, the ligand density difference is more likely due to weakly
bound OA or OA-bearing impurities (i.e. Cd(oleate)2 or CdxSey(oleate)z)33,75. We also
18
still larger result than the 1GPC sample (147 OA per QD). As shown in Figure 2.2D, we
also used GPC to purify the same QDs sample twice, which yields a similar ligand density
on the QDs. For the 2GPC samples, the extra column purification did not decrease the
ligand density on the QDs’ surface, which suggests that all the weakly adsorbed ligands
can be effectively removed during 1GPC process. 31P NMR spectra were also measured to
confirm the complete removal of phosphorus containing species (i.e. TOPSe, TOP, TOPO
appearing as byproducts of QD synthesis) by GPC (Figure 2.2E-F). Excess ODE and OA
species could be detected by 1H NMR in GPC solvent fractions eluted at later times (Figure
2.3). To test the dependence of the GPC purification technique on the initial sample
concentration, we purified a series of three aliquots of the same CdSe QD sample with
different initial concentrations (58µM, 115 µM and 175 µM) by GPC and observed <1%
variation in the number of ligands/QD in the eluted products.
These results demonstrate that GPC purification is an efficient method to isolate
QDs with reproducible ligand ratios. Because GPC operates on the basis of the
hydrodynamic size difference and not polarity or a specific affinity interaction, the
(entropic) driving force that contributes to the separation is fixed and we can get highly
reproducible results from this purification method. The fact that the samples prepared by
multiple PR cycles contained larger numbers of ligands raised the question of whether the
“excess” OA ligands in such samples represented higher surface coverage, or the presence
of soluble OA-containing species.
Diffusion ordered NMR spectroscopy (DOSY) can be used to characterize the
association of molecules with nanoparticles74,76,77 and was used here to determine the
19
diffusion constants were used to measure the hydrodynamic radius to accommodate some
run to run instrument variability in the absolute diffusion constant measurements.
20
Figure 2.3 The 1H NMR spectrum of material separated from the CdSe1 QD sample after the GPC purification, revealing the presence of ODE and OA.
In order to obtain the characteristic diffusion constant for OA, we relied upon the
olefin peaks because their chemical shift is well separated from those of THF protons.
Based on the measured diffusion coefficients of the OA and THF in each run (shown in
Figure 2.4), the characteristic hydrodynamic diameter (DH) of the OA in different samples
can be calculated using the Stokes-Einstein equation by assuming the DH of THF is fixed
at 0.63 nm (as reported by Dyadin et al.78). The average DH of the OA from the
CdSe1_1GPC sample was 4.42 nm, which is very close to the core diameter (3.5 nm) and
an OA shell with thickness of 1~2 nm. However, the average DH of the 2PR sample was
1.85 nm, which suggests an average among OA bound to the QD surface and faster
21
CdSe1_1GPC QD sample is bound to the surface and consider molecular oleic acid as
representative of the unbound oleate species in QD samples (DH = 0.88 nm), then 66% of
the OA in CdSe1_2PR sample were attached to the QD surface, while 34% remained
unbound.
Figure 2.4 DOSY spectra of CdSe1 samples in THF-d8. The measurements were done
with 100ms diffusion delay and 2ms diffusion gradient length. (A)CdSe1_1GPC QDs; (B)CdSe1_2PR QDs. Copyright 2013 American Chemical Society.
The 1PR, 2PR and 1GPCCdSe1 QDs samples were also characterized by TGA to
corroborate the NMR results of ligand/QDs ratio differences from the different purification
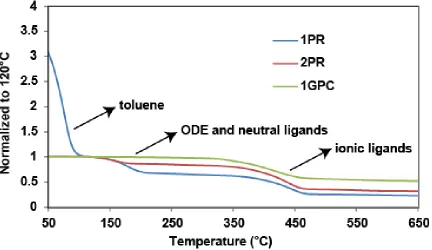
processes. As Figure 2.5 shows, the TGA curves can be separated into 3 regions79. Below
120°C, mass loss primarily signifies the evaporation of the solvent (toluene); between
120°C and 300°C, mass loss is attributed to the disappearance of neutral molecules;
between 300°C and 500°C, the ionically bonded ligands break down. We assume the
remaining mass after heating to 500°C was attributed to the inorganic core. As listed in
Table 2.1, the CdSe1_1GPC sample did not show any significant weight difference until
the temperature reached 300°C; while both CdSe1_1PR and CdSe1_2PR QDs
demonstrated neutral molecule removal over 120-300°C, which is in agreement with the
NMR results. Based on the observed mass losses, the ionic-ligands/QDs mass ratio of
22
difference can be explained by previously mentioned possible impurities in the 2PR
sample, such as Cd(oleate)2 or CdxSey(oleate)z. The mass loss from 120-500°C can be
attributed to the removal of all the organic molecules from the system (except for the
solvent) and the organic/inorganic ratios of CdSe1_2PR and CdSe1_1GPC samples were
1.83 and 0.78 respectively.
According to the absorption spectrum of CdSe QDs before and after the GPC
purification, the size and size distribution of the samples did not change. However, we also
considered the possibility that there could be some Cd and/or Se containing impurities
remaining in the 2PR sample that are removed by GPC purification. In order to understand
how the more stringent removal of impurities by GPC altered the Cd/Se ratios in the
samples, the inorganic core portions of the CdSe1_2PR and CdSe1_1GPC were
characterized by ICP_MS75,80. As shown in the Figure 2.6, the Cd/Se ratio is similar
between the two samples, but the 2PR sample has a slight, but statistically significant,
increase in Cd that can be attributed to the residual Cd rich impurities (e.g. Cd(oleate)2).
2.2.3 Analysis of the GPC purified QDs: CdSe/CdZnS core/shell samples
CdSe/CdxZn1-xS QDs were prepared by a selective ionic layer adhesion and reaction
(SILAR) process with CdSe QDs as the core and (TMS)2S, Zn(oleate)2 and Cd(oleate)2 as
the shell precursors. Since the shell generation process involves the highly reactive reagent
(TMS)2S and a more complicated reaction mixture than the synthesis of CdSe QDs, there
are likely more impurities in the core/shell samples than in the core -only ones.
23
Figure 2.5. TGA curves of CdSe1 QDs purified by different methods with the arrows indicating regions assigned to the loss of the specified solvent or ligand. Copyright 2013 American Chemical Society.
Table 2.1. Summary of the mass remaining at different temperatures from TGA tracea
CdSe1 QD samples 1PR 2PR 1GPC
Mass remaining
at different temperatures
120°C 1.000 1.000 1.000
300°C b 0.644 0.832 0.975
500°C c 0.256 0.354 0.562
a Results are normalized to the mass at 120°C, at which point the solvent (toluene) is
presumed to have been removed. b Weakly binding ligands are removed before 300°C. c Ionically binding ligands are presumed to disappear in the region of 300-500°C.
Copyright 2013 American Chemical Society.
PR cycles81,82, and published ligand exchange procedures for core/shell QDs often describe
only a single precipitation step83. Therefore, it is imperative to find an alternative way to
24
GPC purification process, both 1PR and 1GPC CdSe/CdZnS2 QDs were characterized
by 1H NMR and TGA.
Figure 2.6Inductively-coupled plasma mass spectrometry (ICP-MS) analysis of the Cd and Se content in CdSe1_2PR and CdSe1_1GPC QD samples. The concentrations are normalized to that of Se to find the Cd-to-Se ratio in each sample.
As shown in Figure 2.7, the large difference in the organic/QD ratio between the
two samples was confirmed by the TGA results. In the CdSe/CdZnS2_1PR sample, more
than 72% of the mass was lost in the organic molecule breakdown region (from 100°C to
500°C), whereas the amount was less than 23% in the 1GPC sample. In the 1H NMR
measurements, both OA and ODE can be observed in the spectrum of CdSe/CdZnS2_1PR
sample, whereas the 1GPC sample displays a much cleaner spectrum with only OA
appearing on the QD’s surface. Therefore, GPC purification can also be used for
25
Figure 2.7. TGA curves of CdSe/CdZnS21PR (blue) and 1GPC (red) QDs, normalized to 100°C, where the solvent (toluene) has been completely removed. The insets highlight the region of olefin protons from OA and ODE (4.5-6.5ppm) in the 1H NMR spectra.
Copyright 2013 American Chemical Society.
2.3 Purification of other nanomaterials in different shapes and with different
capping ligands
In order to study the tolerance of the GPC purification technique, a variety of
nanomaterials have been prepared and purified by the column. We first studied the
purification efficiency of three different nanomaterials with different capping ligands to
confirm this technique is not limited to oleate capped II-VI materials. The three samples
we used were organic phosphonate capped CdSe QDs12, carboxylate capped InP QDs84
(prepared by Brandi Cossairt’s group at the University of Washington) and thiol capped
Au nanoparticles85. The tetradecylphosphonate (TDPA) capped CdSe QD samples were
26
trioctylphosphine oxide (TOPO) solvents. Therefore, all the ligands and impurities
prepared by this method should be phosphorus-containing molecules, which makes 31P
NMR a sensitive technique to characterize the impurities / surface ligands in the sample
solution. As shown in Figure 2.8A-C, after two times PR cycles, there were still a
significant amount of free TDPA, TOP and TOPO remaining in the system, while the only
remaining phosphorus-containing molecules in the GPC purified sample are the ionic
binding phosphonate ligands. For the other two samples, we did not have a good handle
(like olefin proton or phosphorus) for the NMR measurements. Therefore, TGA was used
to compare the ligands-to-nanocrystal-ratio directly before and after the GPC purification.
As shown in Figure 2.8D-E, a significantly smaller mass loss was observed after GPC
purification for both samples, which indicates that this method can also be used for a large
variety of materials with different capping ligands.
Another concern is the influence of the nanocrystal shape on the GPC purification
results. Therefore, four CdSe/CdS core/shell heterogeneous structure nanocrystals with
different shapes were prepared19,26. As shown in Figure 2.9, Sample A is a typical
core/shell spherical CdSe/CdS QDs made by SILAR method; samples B to D are
CdSe/CdS nanorods prepared following a published experimental procedure, and the
shapes were controlled by changing the ligand ratio and seed concentration. From sample
A to sample D, these nanomaterials have different sizes and aspect ratios, which provides
a good model to study the nanoparticle shape effect on the GPC purification technique.
As shown in Figure 2.10A-B, similar to the CdSe/CdxZn1-xS samples, after GPC
purification, the only remaining surfactant on the OA capped CdSe/CdS QDs were the
27
Figure 2.8 (A)-(C) The 31P NMR spectra of phosphonate capped CdSe QD samples purified by different methods, demonstrating the removal of phosphorus containing species (such as free TDPA, TOP and TOPO) by the column purification. (D)-(E) normalized TGA curves of thiol capped Au nanoparticles (D) and carboxylate capped InP QDs before (red) and after (blue) GPC purification.
containing impurities and excess ligands have been successfully removed. The CdSe/CdS
nanorod samples behaved similarly to the phosphonate capped CdSe QD samples. As
shown by the 31P NMR spectra before and after the GPC purification (Figure 2.10C-D),
we can clearly see that after GPC, the only remaining phosphorus containing molecules are
the ionic binding ligands, which have a broad signal in the spectrum. All the other free
phosphorus containing ligands were effectively removed. These results confirm that the
28
Figure 2.9 The TEM images of CdSe/CdS nanocrystals with different shapes and sizes
29
2.4 The excess ligands’ impact on further surface modification of QDs
On the basis of the results presented above, GPC has been proven to be a highly
effective method for the nanocrystal purification. The achievement of an efficient method
for the preparation of clean QD samples allows us to test whether impurities that reside in
samples prepared by standard purification methods have a significant effect on further
surface modification reactions. In the discussion shown below we employed a CdS shell
growth titration experiment on CdSe QDs, and cysteine ligand exchange on CdSe/CdxZn
1-xS QDs to study the effect of excess ligands and impurities on the surface reactivity of QDs.
2.4.1 Titration of CdS Shell Growth on CdSe QDs.
CdSe/CdS core/shell QDs are known for high QY19,86 and asymmetric charge
separation87. Some of the most widely practiced preparation procedures utilize the SILAR
method to grow a CdS shell on the CdSe core18,19,23. The shell growth process requires that
initial organic ligands be displaced so that material can be added to the crystal surface; as
a result, we expect that shell growth could depend strongly on the surface environment80,88,
including the presence of excess ligands and/or impurities. Here, we employed a set of
titration experiments to test whether the differences observed in analyses of GPC and PR
purified QDs lead to different synthetic outcomes in the initial stages of core/shell growth
by SILAR. A quantity of Cd and S precursors equivalent to 1.0 monolayer of CdS shell
growth was added to CdSe1 core samples purified by GPC or by PR only. In Figure
2.11A-B, 1.0 monolayer equivalent of Cd(oleate)2 was added first, followed by 1.0 monolayer
equivalent of (TMS)2S. In Figure 2.11C-D, the order of addition was reversed so that S
was added first. In all cases, the additions were conducted stepwise in doses of
30
completion prior to the withdrawal of a small aliquot for spectroscopic analysis. The
progress of the shell growth is characterized based on the bathochromic shift of the
absorption spectrum (Figure 2.11E-H) versus effective shell thickness applied.
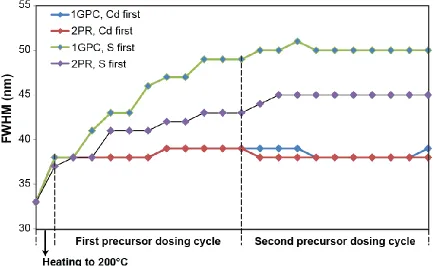
Figure 2.11 Absorption spectra and the lowest energy extinction peak position shift of the aliquots taken during the CdS shell growth titration experiment on CdSe1 QDs purified by either 2PR or 1GPC. Waterfall absorption spectrum (A) 1GPC, Cd dosing first; (B) 2PR, Cd dosing first; (C) 1GPC, S dosing first; (D) 2PR, S dosing first. The interval between aliquots was 10 min. (E,F,G,H) Plots of lowest energy exciton absorption as a function of targeted CdS shell thickness for (E) 1GPC, Cd dosing first; (F) 2PR, S dosing first; (G)
1GPC, S dosing first; (H) 2PR, S dosing first. Copyright 2013 American Chemical Society.
As shown in Figure 2.11, the 1GPC purified QDs experienced a lower rate of
red-shifting than did the 2PR purified sample when Cd was introduced first in the SILAR
31
cycle. We interpret the smaller redshift as an indication of a lower growth rate for Cd in
the 1GPC sample. Experiments in which the S precursor was added first also show a
difference in the initial reactivity of 1GPC and 2PR samples. The 2PR sample (Figure
2.11D) displayed little change in effective bandgap upon the addition of (TMS)2S,
suggesting little reaction with the QD surface given the large redshift associated with S
addition following Cd (Figure 2.11B). In the subsequent Cd dosing cycle, we saw a
relatively large redshift in the first Cd injection followed by a continuous redshifting at a
slower rate. In contrast, the 1GPC sample (Figure 2.11C) experienced a continuous
redshift during the entire S dosing process followed by a large shift in the first four Cd
injections and smaller shifts for the later ones. The FWHM of the emission peak (Figure
2.12) was measured to characterize the size distribution during the titration process and is
helpful in explaining the difference in reactivity towards added (TMS)2S between the
1GPC and 2PR samples. Compared to the results when Cd is introduced first, the size
distribution increases significantly during the S dosing titration cycle, with a larger increase
for the 1GPC sample.
We believe that the difference in reactivity of the initial QD surface towards the
addition of Cd(oleate)2 can be explained by the presence of a Cd-bearing impurity in the
2PR sample. For the 1GPC sample, once the Cd(oleate)2 was introduced as the Cd
precursor, part of it was diverted to saturate the solution instead of reacting on the QDs’
surface. However, for the 2PR sample, due to the possible presence of Cd(oleate)2 as an
impurity and surface etching by the excess amount of weakly bonded oleic acid, the
32
Figure 2.12 Full width at half maximum (fwhm) of the emission peaks during the titration experiment described in Figure 2.11 of the narrative. A larger peak width is representative of a broader size distribution, though the intrinsic linewidth of QD emitters at room temperature also contributes.
Hence, in the 2PR sample more of the added Cd(oleate)2 could be used for the shell growth,
which resulted in a faster growth rate and larger redshift than was observed in the 1GPC
sample.
Our observations suggest that etching and/or ripening processes are competing with
shell growth when (TMS)2S is added first in both the 1GPC and 2PR samples. Ligand
exchange experiments have shown that TMS reagents can facilitate removal of oxyacid
ligands through the formation of O-TMS byproducts89,90. In the present case, the total
amount of (TMS)2S for 1.0 monolayer shell growth, 319 per QD, is much larger than the
33
distribution change observed on (TMS)2S addition in the 1GPC titrations could be an
indication that effective removal of excess ligands and impurities decreases the colloidal
stability of the QDs towards the addition of excess (TMS)2S.
Based on our observations, impurities and/or excess ligands present in PR purified
samples influence the reactivity of the CdSe QD surface towards the addition of shell
precursors in both Cd-first and S-first cases. For both PR and GPC purified samples,
initiating the SILAR process with Cd produced larger redshifts and better maintained the
emission linewidth; this result is in keeping with much SILAR literature in which Cd is
added first19,20. Despite the slower initial redshift under Cd addition seen in the GPC
purified sample, we stress that we have obtained core/shell QDs with good optical
properties from these starting materials after multiple SILAR cycles. The availability of
highly purified QD samples via GPC should allow the possible roles of various intrinsic
and purposely-added minor constituents in shell growth reactions to be investigated more
thoroughly in future work.
2.4.2 Cysteine ligand exchange reaction of CdSe/CdxZn1-xS QDs.
Ligand exchange reactions are essential to prepare water-soluble QDs with minimal
hydrodynamic diameters; cysteine is a convenient monothiol ligand that presents a
zwitterionic nanoparticle surface and has been shown to enable renal clearance of QDs21.
In order to achieve better ligand exchange efficiency, the amount of original ligands should
be reduced as much as possible. Based on the 1H NMR and TGA results described above,
34
CdSe/CdZnS2_1PR sample. We investigated the influence of this difference in purity on
a biphasic (toluene/water) cysteine ligand exchange reaction.
Before mixing the aqueous and the organic solutions, both phases are clear in each
of the two samples (photographs available in Figure 2.13A-E). After stirring the mixtures
for 15 min, material began to precipitate in the aqueous phase of the 1PR sample and this
appeared to impede the ligand exchange reaction. After 30 minutes, we observed that the
aqueous phase became colorful in the 1GPC sample; this change in solubility is evidence
that the ligand exchange reaction is proceeding successfully. After 1 hour, almost all of the
color had transferred in the 1GPC sample, while the 1PR sample still had not recovered.
This result demonstrates that a clean surface of the original QDs aids in promoting a
successful ligand exchange reaction, and that CdSe/CdxZn1-xS core/shell QDs with such a
clean surface can be achieved by GPC. The cysteine capped 1GPC QDs were stored in a
refrigerator and slowly precipitated out after 2 days (such limited stability is characteristic
of cysteine-capped QDs). The QY of these water-soluble QDs is 46.6%, which is suitable
for bioimaging applications. We have achieved a successful cysteine ligand exchange with
1PR QDs previously, but due to the limited reproducibility of the PR purification method,
the reaction rarely proceeded. In contrast, the GPC purified sample consistently showed
efficient exchange with the new cysteine ligand and transfer to the aqueous phase.
2.5 In situ solvent change with QDs on GPC
Applications of QDs sometime requires solvent change in order to optimize surface
35
Figure 2.13 (A)-(E) Photographs of the QDs and cysteine mixtures during the ligand exchange. CdSe/CdZnS2 1PR sample is on the left and 1GPC sample is on the right. The purification process includes one-time precipitation by ethanol and hexane, QDs redissolution in pH=8 buffer and filtration by polyethersulfone membrane (pore size: 0.2 μm). (F) QY of the cysteine capped QD sample. The excitation wavelengths used for each measurement are marked by the red line. Absorption spectra (black) and emission spectra (blue) of QDs are shown as solid lines, while dashed lines indicate rhodamine 590 in ethanol. Copyright 2013 American Chemical Society.
nanocrystal solution is by pumping the old solvent out by vacuum and redispersing the
sample in the new solvent. However, since the sample has to be pumped dry to remove the
old solvent, it is likely to cause irreversible aggregation of the particles, especially for the
purified ones55. It would be ideal if we could change the solvent in solution phase while
simultaneously doing the purification. The size of the solvent molecules is also much
smaller than the nanoparticles, which made GPC probable media to perform the solvent
change process. By injecting the nanocrystal sample in old solvent directly to the GPC