https://doi.org/10.5194/nhess-18-3045-2018 © Author(s) 2018. This work is distributed under the Creative Commons Attribution 4.0 License.
Effects of the impact angle on the coefficient of restitution in
rockfall analysis based on a medium-scale laboratory test
Yanhai Wang1, Wei Jiang1,2, Shengguo Cheng2, Pengcheng Song2, and Cong Mao2
1Hubei Key Laboratory of Disaster Prevention and Mitigation, China Three Gorges University,
Yichang, Hubei, 443002, People’s Republic of China
2Department of Civil, Structural, and Environmental Engineering, University at Buffalo, Buffalo, NY 14260, USA
Correspondence:Wei Jiang ([email protected]) Received: 13 April 2018 – Discussion started: 24 April 2018
Revised: 19 October 2018 – Accepted: 4 November 2018 – Published: 19 November 2018
Abstract.The reliability of a computer program simulating rockfall trajectory depends on the ascertainment of reason-able values for the coefficients of restitution, which typically vary with the kinematic parameters and terrain conditions. The effects of the impact angle with respect to the slope on the coefficients of restitution have been identified and stud-ied using small-scale laboratory tests. To investigate whether the existing conclusion based on small-scale laboratory tests is valid when the test scale changes as well as the role of ro-tation in the effect of the impact angle on the coefficients of restitution, this study performed a medium-scale laboratory test using spherical limestone polyhedrons to impact con-crete slabs. Free-fall tests are conducted, and the velocities before and after the impact are obtained by a 3-D motion capture system. The comparison of results between our test and the existing small-scale tests verified that several general laws occur when accounting for the effect of the impact an-gle, regardless of the test scales and conditions. Increasing the impact angle will induce reductions in the normal coef-ficient of restitutionRn, the kinematic coefficient of
restitu-tionRvand the kinetic energy coefficient of restitutionRE,
whereas it will lead to increases in the tangential coefficient of restitutionRt. The rotation plays an important role in the
effect of the impact angle. A higher percentage of kinetic en-ergy converted to rotational enen-ergy always induces a higher normal coefficient of restitution Rn and a lower tangential
coefficient of restitution Rt. As the impact angle decreases,
the ratio between the rebound angleβand the impact angleα increases, and the percentage of kinetic energy dissipated in rotation as the collision became higher. Considering that the effect of block shape and the detailed impact orientations are
not involved in the present study, the test results are valid for trajectory simulation codes based on a lumped-mass model and can be referenced in the trajectory predication of spheri-cal rocks impacting hard surfaces using a rigid body model.
1 Introduction
In mountainous areas, rockfall is a frequent natural disaster that endangers human lives and infrastructure. Numerous ex-amples of fatalities or infrastructure damage due to rockfall have been reported (Guzzetti et al., 2003; Pappalardo et al., 2014). Various protective measures, such as barrier fences, cable nets and rockfall shelters, have been widely used to re-duce rockfall hazards. To ensure the efficiency of mitigation techniques, the motion trajectory of the rockfall must be es-timated. The trajectory can provide important information, such as the travel distances of possible rockfall events, the bouncing height and the kinetic energy level of the rockfall at various positions along the slope.
objec-tive rock. The first approach, a lumped-mass model, treats the rock as a single and dimensionless point and assigns all of the properties of the rock to that point. The second model is a rigid body model, which considers the rock as a body with its own shape and volume and accounts for all types of block movement, including rotation. Finally, a hybrid model adopts a lumped-mass model to calculate the free fall of the rock and simulates other types of block motion using a rigid body model. In most codes, the trajectory of falling rocks was described as combinations of four types of motion: free fall, rolling, sliding and rebound. The rebound motion, a suc-cession of rockfalls impacting the slope surface, is the least understood and the most difficult to predict of the four types of motion (Volkwein et al., 2011) and is controlled by the coefficients of restitution in computer simulations. Thus, the reliability of the estimation of the coefficient of restitution must be ensured.
1.1 Definition for the coefficient of restitution
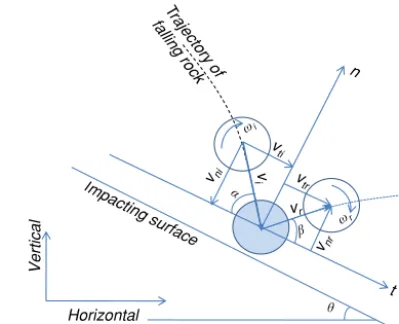
The coefficient of restitution is a dimensionless value repre-senting the ratio of velocities or energies of a boulder before and after it impacts the slope. Various definitions for the coef-ficient of restitution have been proposed in previous studies, but no consensus was reached on which definition is more appropriate for rockfall prediction. As shown in Fig. 1, when one boulder impacts the slope surface, the impact velocityvi
can be resolved into a normal component vniand a
tangen-tial componentvti according to the slope angleθ. Then, the
boulder leaves the surface with a rebound velocityvr, which
similarly has a vnr and avtr. The angular velocities of the
boulder before and after impact are denoted as ωi andωr,
respectively. The impact angle α and rebound angle β are drawn in Fig. 1.
The normal and tangential coefficients of restitution are the most commonly used definitions, and the two coefficients of restitution are typically denoted asRnandRt, respectively.
The mathematical expressions ofRnandRtare
Rn=vnr/vni, Rt=vtr/vti. (1)
Another common definition is the kinematic coefficient of restitution,Rv, representing the ratio between the magnitudes
of the rebound and impact velocities:
Rv=vr/vi. (2)
This definition, originating from Newton’s law of restitution, has been used by Habib (1976), Paronuzzi (1989) and other scholars. WhenRvis used in the trajectory predication, an
assumption regarding the rebound direction is necessary to fully determine the velocity vector after impact.
In addition, the ratio of kinetic energies before and after impact is used to define the kinetic energy coefficient of resti-tutionRE, which is written as
θ
I
T
Figure 1.Related quantities adopted in the definitions for the coef-ficient of restitution.
RE=Er/Ei=(Err+Ert)(Eir+Eit) , (3)
in whichEiandErare the kinetic energy before and after the
impact, respectively.EirandErrare the rotational energy
be-fore and after the impact;EitandErtdenote the translational
energy before and after the impact.Eir,Eit,ErrandErtare
computed as
Eir=0.5I ω2i, Eit=0.5mvi2, Err=0.5I ω2r, Ert=0.5mvr2. (4)
Here,mis the mass,Iis the moment of inertia.REcan reflect
the kinetic energy loss caused by the impact and has been used by Bozzolo and Pamini (1986), Azzoni et al. (1995) and Chau et al. (2002).
In these definitions,RnandRtbecome more popular in
en-gineering practice for simplicity in computer simulation soft-ware.RnandRtare used conjointly and characterize the
vari-ation in the tangential and normal components of the boul-der velocity, respectively. Given an impact velocity, the re-bound velocity and direction can be completely determined using this definition without any further assumption. There-fore,RnandRtattracted the most attention in previous
stud-ies, and some typical values ofRn andRt have been
sum-marized (Agliardi and Crosta, 2003; Heidenreich, 2004; Sci-oldo, 2006).
1.2 Previous studies on the effects of the impact angle on the coefficient of restitution
al;, 1990; Robotham et al., 1995; Richards et al., 2001; Chau et al., 2002; Asteriou et al., 2012), the shape of the rocks (Chau et al., 1999; Buzzi et al., 2012), the roughness of the slope surface (Giani et al., 2004) and the impact angle, influ-ence the coefficient of restitution considerably. However, in those existing summaries for typical values, the coefficients of restitution were determined mainly accounting for the ter-rain conditions.
The impact angle, the angle between the directions of the impact velocity and the slope segment, is a kinematic param-eter of the falling rock, indicating only that the terrain con-ditions involved in estimating the value of the coefficient of restitution may be unreliable. Since Broili (1973) first iden-tified this problem, numerous experiments have been per-formed to acquire a comprehensive picture of the effects of the impact angle. In situ tests are expensive and not suitable for statistical and parameter analysis; thus, existing studies have largely been performed in the laboratory. In some stud-ies, the impact angle was referred to as the slope angle θ (or the impact surface angle) in free-fall tests. However, the impact surface angle is only another expression because the slope angleθand impact angleαsum up to 90◦under these conditions.
Wu (1985) conducted laboratory tests using rock blocks on a wooden platform and rock slope and suggested that there is a linear correlation between the impact surface angle and the mean value of the restitution coefficient. He proposed that increasing the angle of the impact surface causes the normal coefficientRnto increase regardless of the block mass and
causes the tangential coefficientRtto decrease slightly.
Richards et al. (2001) executed free-falling tests consider-ing different types of rock and slope conditions and estab-lished a correlation between the coefficient of restitution and the Schmidt hammer rebound hardness. The impact surface angle was added to the correlation to reflect its linear im-provement effect on the normal coefficientRn.
Chau et al. (2002) conducted experiments using spherical boulders and a rock slope platform, both made of dental plas-ter. The free-falling tests indicated that the normal coefficient increases with increases in the impact surface angle, whereas there was no clear correlation with the tangential coefficient. Cagnoli and Manga (2003) studied oblique collisions of lapilli-size pumice cylinders on flat pumice targets and deter-mined that the impact angle can influence the rebound angle, the kinetic energy loss and the ratios of the velocity compo-nents. The normal coefficient decreases as the impact angle approaches 90◦.
Asteriou et al. (2012) performed laboratory tests using five types of rocks from Greece. The results of the parabolic drop tests indicated that the kinematic coefficient of restitutionRv
was more appropriate than the normal coefficient of restitu-tion for use in correlarestitu-tions with the impact angles. Then, the normal coefficient of restitution could be estimated account-ing for the rebound–impact angle ratio.
Buzzi et al. (2012) conducted experiments using flat con-crete blocks in four different forms and determined that a combination of low impact angle, rotational energy and block angularity may result in a normal coefficient of restitution in excess of unity.
James (2015) evaluated restitution coefficients using milled aluminum blocks and a planar wooden slope. Three different shapes of blocks were custom made, and the slope surface was carpeted. Both the first impact under free-fall conditions and the series impacts during runout were recorded. It was observed thatRnshows a positive
correla-tion with increasing slope angle, whileRtshows a negative
correlation.
These efforts have highlighted the importance of the im-pact angle with regard to the coefficient of restitution. Most of the existing tests indicated that increasing the impact an-gle induces a reduction in the normal coefficient of restitu-tionRn but an improvement in the tangential coefficient of
restitutionRt. However, there are two issues that remain
un-solved. First, whether the laws regarding the effect of the impact angle on the coefficient of restitution are influenced by the test scale is uncertain. Until now, the existing labora-tory tests commonly captured the trajeclabora-tory of small samples using a high-speed video camera, which means that the ex-isting results are based on small-scale laboratory tests. As Heidenreich (2004) noted, the mature similarity theory re-garding the model test on the coefficient of restitution is still absent because the influence factors are much more than the material properties and sizes. Therefore, laboratory tests with larger scales should be performed to confirm the validity of the existing conclusions, which is beneficial for further in-terpreting the results of small-scale laboratory tests. Second, in free-fall tests, the rotation after impact plays an important role in kinetic energy dissipation of the falling block (Chau et al., 2002), and it was supposed to affect the variation ofRn
andRt(Broili, 1973; Cagnoli and Manga, 2003). However,
few studies have been performed to reveal the effect of rota-tional motion on the coefficient of restitution through quan-titative analysis. Whether a correlation occurs between the rotation and the effect of the impact angle deserves our atten-tion and may offer some insights into the effect of the impact angle on the coefficients of restitution.
Hence, this study employs a 3-D motion capture system and a special releasing device to perform a medium-scale laboratory experiment. Spherical polyhedrons made of lime-stone were selected as samples with a maximum diameter of 20 cm. The landing plate consisted of C25 concrete slabs. To address the effect of the impact angle, different inclined plate angles and releasing heights were used in free-fall tests. The resulting coefficients of restitution,Rn,Rt,RvandRE, were
per-D=20 cm D=10 cm
50
cm
(a) (b)
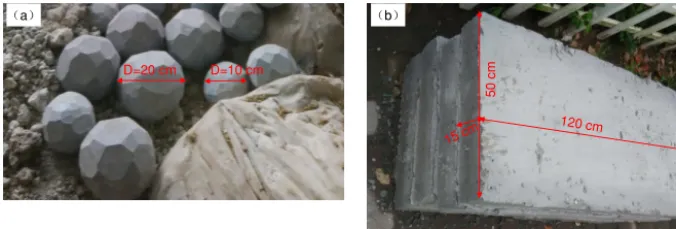
Figure 2.Materials used in this experiment:(a)spherical limestone polyhedron with two diameters and(b)C25 prefabricated concrete slabs.
centage of the total kinetic energy before impact converted to rotational energy was investigated, and the role of rotation in the effect of the impact angle on the coefficient of restitution was analyzed. For only spherical polyhedrons that are taken as the samples in this study, the test results may have some limitations.
2 Laboratory investigation
2.1 Rock specimens and concrete slabs
All falling rock specimens in this study were natural lime-stone from the China Three Gorges area and were customized in accordance with the required sizes. As shown in Fig. 2a, irregular artificial cutting facets constituted the surface of the specimens, and the edges were not smoothed; thus, the shape is called a spherical polyhedron in this study to distin-guish it from the standard sphere used in other research stud-ies. To appraise the effect of rock size on the rebound char-acteristics, two different diameters were considered (D=
10 cm andD=20 cm), with corresponding average masses of 1.2 and 10 kg. The C25 concrete slabs came from a pre-fabricated concrete factory. As shown in Fig. 2b, each con-crete slab had dimensions of 120 cm×50 cm×15 cm. The mechanical properties of the materials adopted in the test are determined beforehand. The limestone has Young’s modu-lusE=41 GPa, Poisson’s ratioν=0.21 and Schmidt hard-nessR=36.0. The concrete hasE=28 GPa,ν=0.20 and R=32.5.
2.2 Testing apparatus
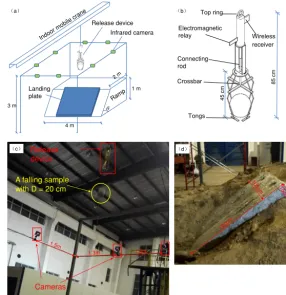
The apparatus used in this study consisted of a ramp, land-ing plate and release device (Fig. 3a). The ramp was built by compacting gravelly soil and had an inclined surface with planned angles produced by artificial excavation. Then, two concrete slabs were placed on the inclined surface to form the landing plate. One device was designed and manufactured specifically to catch and release specimens of various sizes. As shown in Fig. 3b, the device had four adjustable tongs at the bottom, which could grasp spherical blocks with
diame-ters from 8 to 25 cm. A wireless receiver and electromagnetic relay were installed in the upper portion of the device, offer-ing a wireless method of alteroffer-ing the tong status, graspoffer-ing or loosing. The device could be connected to an indoor mobile crane using the top ring, which means that the device could go up and down by managing the crane.
A free-fall test was performed in the experiment, and the complete process of one test is as follows. First, when one spherical polyhedron is prepared to be tested, the tongs are adjusted to accommodate the polyhedron by moving the crossbar up and down. After the sample is in the tongs, the grasping state is selected. Then, the device hanging on the indoor crane is moved to the position above the landing plate and lifted to the planned height. Next, by operating the wire-less switch, the tongs are loosened, and the sample begins to fall (Fig. 3c). Finally, the sample impacts the landing plate, and its motion is recorded. The surface of the concrete slabs becomes worn with successive impacts. Once the damage to the surface is excessive, as shown in Fig. 3d, the slabs used are replaced with new slabs.
2.3 Data acquisition
The spatial motion information of falling samples was ob-tained by the Doreal DIMS-9100(8c) motion capture system. This system has eight near-infrared cameras (see Fig. 4a) with an operating speed of 60 fps and can capture the spa-tial trails of markers attached to the surface of the sample, as shown in Fig. 4b. Then, the motion analysis program pro-vides the spatial motion information of the sample, e.g., its position and velocity. Finally, the coefficient of restitution can be calculated according to Eqs. (1)–(4) for subsequent analysis.
2.4 Experimental program
Infrared camera
1 m
4 m
3 m θ
Release device
Landing plate
Tongs
Wireless receiver Electromagnetic
relay Top ring
Connecting rod
Crossbar 85
cm
45
cm
Cameras Release device
falling sample with D = 20 cm
(a) (b)
(c) (d)
Figure 3.The testing apparatus in this study:(a)a general view of the apparatus,(b)a schematic representation of the specifically designed release device,(c)a falling sample after the wireless switch was turned on and(d)slabs to be replaced for excessive damage.
x(m)
y(m) z(m)
o 1 2
1 2
1
2
(a) (b)
Figure 4.The data acquisition system:(a)eight infrared cameras used to capture the trails and(b)a motion analysis program used to provide the spatial motion information.
of 2.5, 3.5 and 4.5 m upon the inclined concrete slabs. How-ever, two tests do not necessarily have identical release con-ditions even if they have the same release height and use the same specimen because the positions on which the tongs catch the specimen may differ slightly in any two tests.
In Table 1, the release conditions of our experiment are presented in addition to the resulting impact velocities and angles,Rn,Rt,Rv,RE and the rebound angles. The inertia
moment of the sample was approximated to a full sphere in
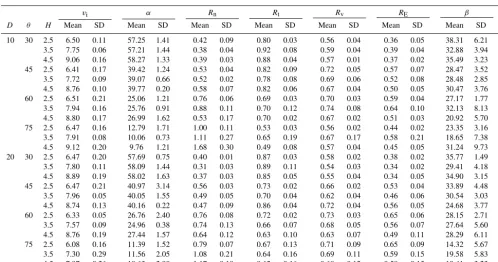
Table 1.Release conditions and results of our experiments.D– the diameter of samples (cm);θ– the inclined angle of the landing plate (◦); H – the release height (m);vi– the impact velocity (m s−1);α– the impact angle (◦);Rn– the normal coefficient of restitution;Rt– the tangential coefficient of restitution;Rv– the kinematic coefficient of restitution;RE– the kinetic energy coefficient of restitution;β– the rebound angles (◦).Ndenotes the test numbers for one release condition.
vi α Rn Rt Rv RE β
D θ H Mean SD Mean SD Mean SD Mean SD Mean SD Mean SD Mean SD N
10 30 2.5 6.50 0.11 57.25 1.41 0.42 0.09 0.80 0.03 0.56 0.04 0.36 0.05 38.31 6.21 4
3.5 7.75 0.06 57.21 1.44 0.38 0.04 0.92 0.08 0.59 0.04 0.39 0.04 32.88 3.94 3
4.5 9.06 0.16 58.27 1.33 0.39 0.03 0.88 0.04 0.57 0.01 0.37 0.02 35.49 3.23 3
45 2.5 6.41 0.17 39.42 1.24 0.53 0.04 0.82 0.09 0.72 0.05 0.57 0.07 28.47 3.52 4
3.5 7.72 0.09 39.07 0.66 0.52 0.02 0.78 0.08 0.69 0.06 0.52 0.08 28.48 2.85 3
4.5 8.76 0.10 39.77 0.20 0.58 0.07 0.82 0.06 0.67 0.04 0.50 0.05 30.47 3.76 3
60 2.5 6.51 0.21 25.06 1.21 0.76 0.06 0.69 0.03 0.70 0.03 0.59 0.04 27.17 1.77 3
3.5 7.94 0.16 25.76 0.91 0.88 0.11 0.70 0.12 0.74 0.08 0.64 0.10 32.13 8.13 3
4.5 8.80 0.17 26.99 1.62 0.53 0.17 0.70 0.02 0.67 0.02 0.51 0.03 20.92 5.70 3
75 2.5 6.47 0.16 12.79 1.71 1.00 0.11 0.53 0.03 0.56 0.02 0.44 0.02 23.35 3.16 3
3.5 7.91 0.08 10.06 0.73 1.11 0.27 0.65 0.19 0.67 0.17 0.58 0.21 18.65 7.38 3
4.5 9.12 0.20 9.76 1.21 1.68 0.30 0.49 0.08 0.57 0.04 0.45 0.05 31.24 9.73 3
20 30 2.5 6.47 0.20 57.69 0.75 0.40 0.01 0.87 0.03 0.58 0.02 0.38 0.02 35.77 1.49 3
3.5 7.80 0.11 58.09 1.44 0.31 0.03 0.89 0.11 0.54 0.03 0.34 0.02 29.41 4.18 3
4.5 8.89 0.19 58.02 1.63 0.37 0.03 0.85 0.05 0.55 0.04 0.34 0.05 34.90 3.15 4
45 2.5 6.47 0.21 40.97 3.14 0.56 0.03 0.73 0.02 0.66 0.02 0.53 0.04 33.89 4.48 3
3.5 7.96 0.05 40.05 1.55 0.49 0.05 0.70 0.04 0.62 0.04 0.46 0.06 30.54 3.03 3
4.5 8.74 0.13 40.16 0.22 0.47 0.09 0.86 0.04 0.72 0.04 0.56 0.05 24.68 3.77 3
60 2.5 6.33 0.05 26.76 2.40 0.76 0.08 0.72 0.02 0.73 0.03 0.65 0.06 28.15 2.71 3
3.5 7.57 0.09 24.96 0.38 0.74 0.13 0.66 0.07 0.68 0.05 0.56 0.07 27.64 5.60 3
4.5 8.76 0.19 27.44 1.57 0.64 0.12 0.63 0.10 0.63 0.07 0.49 0.11 28.29 6.11 3
75 2.5 6.08 0.16 11.39 1.52 0.79 0.07 0.67 0.13 0.71 0.09 0.65 0.09 14.32 5.67 3
3.5 7.30 0.29 11.56 2.05 1.08 0.21 0.64 0.16 0.69 0.11 0.59 0.15 19.58 5.83 3
4.5 7.97 0.26 10.63 2.90 1.17 0.18 0.62 0.16 0.68 0.12 0.58 0.15 19.41 3.23 3
3 Analysis of the results and comparison with existing studies
3.1 Effect of the impact angle on the coefficients of restitution based on our tests
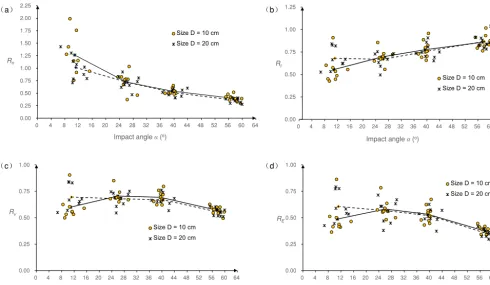
Although the mean values and standard deviations have been calculated in terms of various release conditions, data points are considered in this section to provide a broad perspective for an evaluation of the effect of the impact angle. Four dif-ferent inclined angles of the landing plate (θ=30, 45, 60 and 75◦) induce four intervals of impact angles: 55◦< α <60◦, 36◦< α <44◦, 23◦< α <30◦ and 6◦< α <15◦. The mean values of the coefficients of restitution are computed for the four intervals. In Fig. 5, solid lines are adopted to repre-sent the mean values for samples with sizeD=10 cm, and dashed lines represent the mean values for sizeD=20 cm.
The effect of impact angle on the normal coefficient of restitutionRnis shown in Fig. 5a. When the impact angle is
smaller than 15◦, the values ofR
nrange from 0.709 to 1.989,
and more than 60 % of the values ofRnare larger than 1.0.
A larger impact angle tends to produce a smaller value ofRn
and reduce the discreteness. Initially, the solid line is above the dashed line, although the gap narrows with increasing im-pact angle. When the imim-pact angle is larger than 30◦, these two lines do not exhibit a clear difference. Therefore, small specimens are more likely to have a higher Rn than large
specimens with small impact angles, and the effect of the rock size onRncan be neglected when the impact angle is
more than 30◦.
As Fig. 5b shows, the impact angle has a different effect on the tangential coefficient of restitutionRtcompared toRn.
First, the discreteness of data points has not been reduced as the impact angle increases. Then,Rt increases slightly with
increasing impact angle. In the first impact angle interval, the solid line is below the dashed line, which implies that small specimens gain a lowerRt than large specimens with small
impact angles. Until the impact angle reaches 23◦, the two lines have no distinct difference to be distinguished. Overall, the mean value lines in Fig. 5b seem to accord with the linear correlation betweenRtand the impact angleα(Wu, 1985).
Furthermore, the kinematic coefficient of restitution Rv
versus the impact angle is plotted in Fig. 5c. As the impact angle increases, the peak values of Rv of the four impact
angle intervals decrease gradually, andRvbecomes
0.00 0.25 0.50 0.75 1.00 1.25 1.50 1.75 2.00 2.25
0 4 8 12 16 20 24 28 32 36 40 44 48 52 56 60 64
Rn
Impact angle α(o)
Size D = 10 cm Size D = 20 cm
0.00 0.25 0.50 0.75 1.00 1.25
0 4 8 12 16 20 24 28 32 36 40 44 48 52 56 60 64
Rt
Impact angle α(o)
Size D = 10 cm Size D = 20 cm
0.00 0.25 0.50 0.75 1.00
0 4 8 12 16 20 24 28 32 36 40 44 48 52 56 60 64
Rv
Impact angle α(o)
Size D = 10 cm Size D = 20 cm
0.00 0.25 0.50 0.75 1.00
0 4 8 12 16 20 24 28 32 36 40 44 48 52 56 60 64
RE
Impact angle α(o)
Size D = 10 cm Size D = 20 cm
(a) (b)
(c) (d)
Figure 5.The variations of four coefficients of restitution:(a)the normal coefficientRn,(b)the tangential coefficientRt,(c)the kinematic coefficientRvand(d)the kinetic energy coefficientRE, with the impact angleαin this study, and the mean value lines for samples with size
D=10 cm (solid lines) andD=20 cm (dashed lines).
easily than small specimens when the impact angle is more than 23◦.
Finally, the effect of the impact angle on the coefficient of kinetic energy restitutionREis illustrated in Fig. 5d. Similar
to Fig. 5c, the peak values ofREof the four impact angle
in-tervals decrease with increasing impact angle. However, the discreteness of data points does not disappear clearly until the fourth impact angle interval. The trends for the mean value of RE are similar toRv. However, the decline in the
mean values of RE is more intuitive thanRvfrom the
sec-ond impact angle interval to the third. The gap between the mean lines ofREis narrower thanRvwith larger impact
an-gles. Although some scholars (Chau et al., 2002; Asteriou et al., 2012) suggested that smaller impact angles induce less kinetic energy loss and higherRE, the deduction may not be
suitable for small impact angles in this study.
In addition to the effect of the impact angle on the four coefficients of restitution, another interesting phenomenon can be observed in Fig. 5. Two sizes are adopted in this ex-periment to evaluate the effect of rock size on the rebound characteristics. Except for a smaller impact angle, the gaps between the two mean lines in Fig. 5 are much smaller com-pared to the magnitudes of the restitution coefficients. There-fore, the four coefficients of restitution seem to be indepen-dent of the sample sizes in our test when the impact angle
exceeds 23◦, which could be attributed to the test conditions. As Farin et al. (2015) noted, the thickness of the impacted objective is an important factor in determining whether the coefficients of restitution change with the boulder size. When the impacted objective has a large thickness compared to the boulder size, the coefficient of restitution is independent of the boulder size. In this study, the impacted objective is con-crete slabs fixed in the ground, which has enough thickness to eliminate the effect of rock size on the coefficients of resti-tution in case of large impact angles.
In addition, data points for all coefficients exceptRt
be-come concentrated as the impact angle increases. In the first impact angle interval, the diversity ofRnis clearly larger than
the other three coefficients. However, when the impact angle exceeds 23◦, the lowest diversity occurs forRn, and the
sec-ond is forRv. Various functions were considered to match
data points, but no function can provide a correlation coeffi-cientR2more than 0.60 in terms ofRt,RvandREfor all
op-tions considered. The power function provides the bestR2in matching data points ofRn, which reaches 0.80. Therefore,
the scaling law to describe data points is abandoned in this study. Although Asteriou et al. (2012) suggested thatRvwas
more suitable thanRnfor use in correlations with the impact
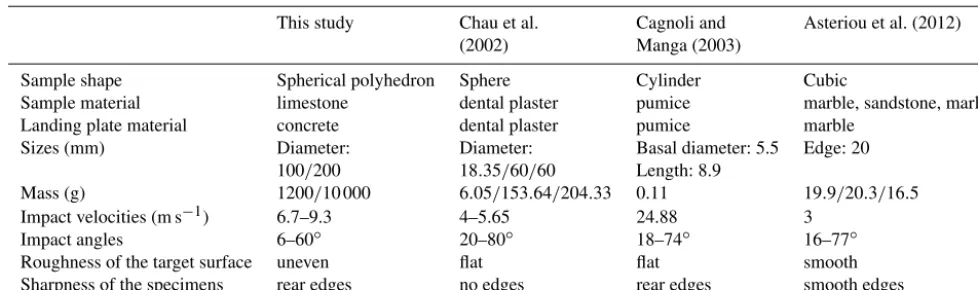
Table 2.Test conditions of previous studies and our experiment.
This study Chau et al. Cagnoli and Asteriou et al. (2012)
(2002) Manga (2003)
Sample shape Spherical polyhedron Sphere Cylinder Cubic
Sample material limestone dental plaster pumice marble, sandstone, marl
Landing plate material concrete dental plaster pumice marble
Sizes (mm) Diameter: Diameter: Basal diameter: 5.5 Edge: 20
100/200 18.35/60/60 Length: 8.9
Mass (g) 1200/10 000 6.05/153.64/204.33 0.11 19.9/20.3/16.5
Impact velocities (m s−1) 6.7–9.3 4–5.65 24.88 3
Impact angles 6–60◦ 20–80◦ 18–74◦ 16–77◦
Roughness of the target surface uneven flat flat smooth
Sharpness of the specimens rear edges no edges rear edges smooth edges
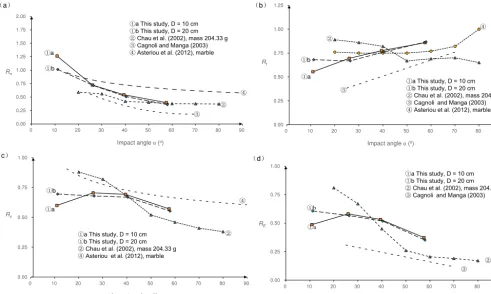
3.2 Comparison with existing small-scale experiments
In this section, the effect of the impact angle on the coeffi-cient of restitution obtained in this study is compared with some existing small-scale experiments to determine the ef-fect of the test scale. Tests conducted by Chau et al. (2002), Cagnoli and Manga (2003), and Asteriou et al. (2012) are se-lected here for the data availability. The test conditions of those studies are provided in Table 2 in comparison with this study. This study mainly differs from the other studies in terms of the size and mass of the samples.
Although previous studies imposed various test condi-tions, they provided references for us to evaluate the effect of the test scale. The effects of the impact angle on Rn,
Rt,RvandREprovided by Chau et al. (2002), Cagnoli and
Manga (2003) and Asteriou et al. (2012) are plotted in Fig. 6 with this study. In the Chau et al. (2002) results, the speci-men with a mass of 204.33 g was selected because that mass is closest to those of our samples. In the Asteriou et al. (2012) results, we chose a marble specimen as the reference because marble and limestone have nearly the same hardness. In the absence of detailed data, only the trend line results in the re-lated literature are extracted and redrawn in Fig. 6 to make a comparison. Different line styles are adopted for trend lines in Fig. 6. The lines with data markers are the mean value lines, while those lines without data markers are fitting lines. Two lines,Rvversus the impact angleafor the Cagnoli and
Manga (2003) test andREversus the impact angleafor the
Asteriou et al. (2012) test, are absent in Fig. 6 because the literature did not provide them. In addition, (1)a and b in Fig. 6 are used to represent the results for D=10 cm and D=20 cm in this study, respectively.
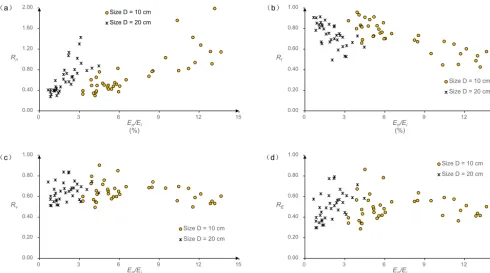
Although the results of the previous studies and our tests are quite different when they are plotted in one figure, some general trends could be observed. First, all of the trends inRn
versus the impact angle are consistent (see Fig. 6a):Rn
de-creases with increasing impact angle. The Asteriou et al. (2012) tests offered the maximumRn in most cases, which
can be attributed to the lighter mass and lower impact
veloc-ities adopted in the tests. The smallRnvalues in the Cagnoli
and Manga (2003) tests were due to the weak strength of pumice whose damage upon impact dissipates kinetic en-ergy, and the impact velocity in this test is much higher than the others. Compared to the other tests, our results produce the steepest descent at the beginning of the trend line. Lin-ear function has been suggested to be used to describe the correlation ofRn and the impact angleαin several reports
(Wu, 1985; Richards et al., 2001), although we cannot offer a definitive conclusion that linear functions are the best choice. In Fig. 6a, the fitting curve (3) is a second-order polynomial, and the fitting curve (4) is a power function. As mentioned above, it is also found that the best correlation coefficientR2 is provided by the power function when matchingRnin this
study.
Next, Fig. 6b indicates that the trends of Rt versus the
impact angle are scattered. Except for the Cagnoli and Manga (2003) result, theRtobtained in the tests are all in the
range from 0.5 to 1.0. Wu (1985) suggested thatRtmay
de-crease linearly with increasing slope angleθ. In other words, Rt may experience an improvement with increasing impact
angleα, which is in line with the results of all experiments except for Chau et al. (2002). Cagnoli and Manga (2003) matchedRtusing a linear function, which resulted in the
fit-ting curve (4) in Fig. 6b. Therefore, the improvement effect of the impact angleαonRtis valid in most cases. In addition,
if the impact angle is less than 45◦, there is an apparent gap between the Cagnoli and Manga (2003) result and the other tests. Although the results of the other three experiments are different, the variation ranges ofRt occur regardless of the
test conditions.
Finally, the trends ofRvandREversus the impact angle
are shown in Fig. 6c and d, respectively. The Cagnoli and Manga (2003) result is not involved in Fig. 6c for its ab-sence, and for the same reason, the Asteriou et al. (2012) result is not involved in Fig. 6d. Four unique trend lines are plotted in Fig. 6c, althoughRvexhibits a descending trend
overall, which means thatRvis reduced in most cases as the
pro-0.00 0.25 0.50 0.75 1.00 1.25 1.50 1.75 2.00
0 10 20 30 40 50 60 70 80 90
Rn
Impact angle α(o)
①a
② ③
④ ①a This study, D = 10 cm
①b This study, D = 20 cm ②Chau et al. (2002), mass 204.33 g ③Cagnoli and Manga (2003) ④Asteriou et al. (2012), marble
①b
0.00 0.25 0.50 0.75 1.00 1.25
0 10 20 30 40 50 60 70 80 90
Rt
Impact angle α(o)
①a
②
④
③
①a This study, D = 10 cm ①b This study, D = 20 cm ②Chau et al. (2002), mass 204.33 g ③Cagnoli and Manga (2003) ④Asteriou et al. (2012), marble
①b
0.00 0.25 0.50 0.75 1.00
0 10 20 30 40 50 60 70 80 90
Rv
Impact angle α(o)
①a
② ④
①a This study, D = 10 cm ①b This study, D = 20 cm ②Chau et al. (2002), mass 204.33 g ④Asteriou et al. (2012), marble
①b
0.00 0.25 0.50 0.75 1.00
0 10 20 30 40 50 60 70 80 90
RE
Impact angle α(o)
①a
② ③
①b
①a This study, D = 10 cm ①b This study, D = 20 cm ②Chau et al. (2002), mass 204.33 g ③Cagnoli and Manga (2003)
(a) (b)
(c) (d)
Figure 6.Results comparison between this study and existing small-scale experiments in terms of the effect of the impact angle on the four coefficients of restitution:(a)the normal coefficientRn,(b)the tangential coefficientRt,(c)the kinematic coefficientRvand(d)the kinetic energy coefficientRE. The mean value lines (lines with data markers) or the fitting lines (lines without markers) are adopted in accordance with the original literature (Chau et al., 2002; Cagnoli and Manga, 2003; Asteriou et al., 2012).
duce downward trend lines for RE, except the initial ascent
stage in line (1)a, which implies that increasing the impact angle induces more kinetic energy dissipation. However, the trend lines in Fig. 6d are scattered. Clearly, the trend lines for RvandREare more likely to be influenced by the test
conditions thanRnandRt. In Fig. 6c, the fitting curve (4) is
a power function, and in Fig. 6d, the fitting curve (4) is a lin-ear function. The difference in the trend lines is apparent for the listed experiments, and we cannot conclude which type of functions should be recommended to matchRvandRE.
In conclusion, various experimental conditions induce dif-ferent results forRn,Rt,RvandRE, although there are
cer-tain trends that occur regardless of the test conditions. The normal coefficient of restitutionRn, kinematic coefficient of
restitutionRvand kinetic energy coefficient of restitutionRE
all decrease with increasing impact angle, while the tangen-tial coefficient of restitutionRtincreases as the impact angle
increases in most cases. A power function appears suitable for use in fitting data points ofRn, while its validity should
be further verified by other studies.
In addition, the Asteriou et al. (2012) test provided the highest trend lines of Rn and Rv in Fig. 6, while the
Cagnoli and Manga (2003) test provided the lowest trend
lines ofRn,RtandRE. The Asteriou et al. (2012) experiment
was conducted using the lowest impact velocity in Table 2, while the highest impact velocity was adopted by Cagnoli and Manga (2003). Cagnoli and Manga (2003) employed pumice, which has a much weaker strength compared to sam-ple materials in other tests. Asteriou and Tsiambaos (2018) noted thatRn reduces when increasing the impact velocity
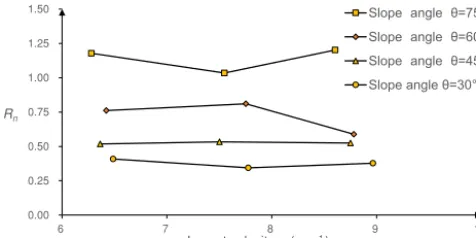
and increases as the material becomes harder, which partly accounts for the difference between the Asteriou et al. (2012) and Cagnoli and Manga (2003) test. However, we cannot make a definitive conclusion regarding which factor in Ta-ble 2 is the main reason for the magnitude difference in the coefficients of restitution between the tests compared. The tests differ from each other in multiple test conditions, as Ta-ble 2 lists; therefore, the estimation of the effect of one spe-cific factor on the magnitude of the coefficient of restitution is unreasonable using their data together. To evaluate the ef-fect of the impact velocity in this study, Fig. 7 plots the mean value ofRnversus the impact velocity with different slope
angles. No determined trend ofRn appears for the limited
0.00
0.25 0.50 0.75
1.00
1.25 1.50
6 7 8 9 10
Rn
Impact velocity vi(m s-1)
Slope angle θ=75° Slope angle θ=60° Slope angle θ=45° Slope angle θ=30°
Figure 7.The mean value lines of the normal coefficient of restitu-tionRnversus the impact velocity.
4 Direction transitions of translational velocities and rotation
4.1 Direction transitions of translational velocities Taking the ratio between the rebound angle and the impact angleβ/αas a reference, the direction transition of the trans-lational velocity versus the impact angle are illustrated in Fig. 8. Assuming that the falling rock is spherical and no en-ergy dissipation occurs during the collision, the rebound an-gle should theoretically be equal to the impact anan-gle, which would result in the data points lying on the red lineβ/α=1 in Fig. 8.
However, the test results are almost entirely located above the line in the first impact angle interval, and nearly 50 % of the test results are above the line in the second interval. The data points are stably located below the line until the impact angle reaches 36◦. As the impact angle increases, the ratio
between the rebound angle and the impact angleβ/αappears to be a clear reduction, and the discreteness of data points decreases. The mean values ofβ/αare still represented by a solid line for samples with sizeD=10 cm and a dashed line for sizeD=20 cm. The two mean value lines have little dif-ference from the second interval to the fourth. However, un-der small impact angle conditions, a smaller sample is more likely to have a largerβ/αthan a larger sample.
A rebound angle greater than the impact angle was also observed by Cagnoli and Manga (2003), which does not vio-late the energy dissipation rule. The experimental results pre-sented in Sect. 3.1 demonstrated that in this study, the kinetic energy loss constituted 40 %–65 % of the total kinetic energy for many data points in the first impact angle interval and constituted 35 %–55 % in the third interval. Therefore, the ratio between the rebound angle and the impact angle can-not be directly used as a reference in estimating whether the energy loss level is high or low.
This phenomenon implies that the rebound motion may have an unexpected direction of translational velocity. Fig-ure 9 plots the direction transition of translational velocity caused by the impact, in which diagrams are individually
0.0 0.5 1.0 1.5 2.0 2.5 3.0 3.5 4.0 4.5
0 10 20 30 40 50 60 70
T
he
r
at
io
β/
α
Impact angle (o) Size D = 10 cm Size D = 20 cm
β/α=1
α
Figure 8.The variation ofβ/αwith the impact angle and the mean value lines for samples with sizeD=10 cm (solid lines) andD=
20 cm (dashed lines).
drawn for four impact angle intervals. For a uniform ex-pression, the landing plate is denoted as the bottom black line. Although the impact velocity directions are concen-trated for each impact angle interval, the rebound velocity directions vary considerably. The variation for the interval 36◦< α <44◦is the smallest of all intervals.
4.2 The rotation caused by the impact
Except for the direction transition of translational velocity, the rotation is another significant consequence of the impact. Despite little rotation before impact, the samples experienced an observable rotation after impact in this study, and the an-gular velocities were recorded and involved in the calculation of the kinetic energy coefficient of restitutionREin Table 1.
Considering that the magnitudes of kinetic energy before im-pact varied in this study, the percentage betweenErrandEi
is used to denote how much kinetic energy is dissipated in rotation after the impact. As mentioned in Sect. 1.1, Ei is
the total kinetic energy before impact, andErris the rotation
energy after impact.
Figure 10a shows the effect of the impact angle onErr/Ei.
A solid line represents the mean values for specimens with sizeD=10 cm, while a dashed line is for sizeD=20 cm. First, the difference is most remarkable between the two sam-ple sizes in Fig. 10a. Err/Ei ranges from 3.3 % to 13.7 %
for sizeD=10 cm and ranges from 0.7 % to 4.5 % for size D=20 cm, which means that small samples are more likely to have a highErr/Ei than larger samples. Next,Err/Ei
de-creases as the impact angle inde-creases. For sizeD=10 cm, Err/Eiexperiences a steep decline from the first impact
an-gle interval to the third and then decreases gently to the fourth. For sizeD=20 cm,Err/Ei has a gradual reduction
(a) (b) (c) (d)
Figure 9.Direction transitions of translational velocities induced by impacts under different impact angle conditions: (a)6◦< α <15◦;
(b)23◦< α <30◦;(c)36◦< α <44◦;(d)55◦< α <60◦.
0 5 10 15
0 4 8 12 16 20 24 28 32 36 40 44 48 52 56 60 64
Err/Ei (%)
Impact angle α(o)
Size D = 10 cm Size D = 20 cm
0 5 10 15
0 1 2 3 4 5
Err/Ei (%)
β/α
Size D = 10 cm Size D = 20 cm
(a) (b)
Figure 10.The effect of(a)the impact angle and(b)the ratioβ/αonErr/Ei.
D=10 cm are always more scattered than sizeD=20 cm. Both the impact angle and the sample size have an important impact onErr/Eiin this study. In conclusion, larger samples
are more likely to have a stead and smallErr/Eithan small
samples, and a large impact angle leads to a smallErr/Ei.
As mentioned in Sect. 4.1, the unexpected direction transi-tion of translatransi-tional velocity always occurs when the impact angle is small. The correlation between the direction transi-tion of translatransi-tional velocity and Err/Ei is investigated
us-ing β/α (the ratio between the rebound angle and the im-pact angle) as a reference. Figure 10b illustrates the trends forErr/Eiversusβ/α.Err/Eiincreases as the ratioβ/α
in-creases. If β/α is smaller than 1.0, the variation range of Err/Ei is rather limited, which ranges from 3.3 % to 6.5 %
for sizeD=10 cm and ranges from 0.7 % to 2.6 % for size D=20 cm. With increasing β/α, the data points become scattered. Moreover, the improvement of Err/Ei appears to
be terminated whenβ/αreaches a specific value. Therefore, we can conclude that a strong correlation occurs between Err/Ei andβ/α. For a given impact angle, larger rebound
angles indicate that more kinetic energy is converted to rota-tional energy during the collision.
4.3 The correlation between the coefficients of restitution and the rotation
The rotation plays an important role in energy dissipation during impact, especially for small samples. The percentage between the resulting rotational energy and the original total kinetic energy decreases as the impact angle increases. The
correlation betweenErr/Eiand the coefficients of restitution
is investigated in this section to evaluate the effect of rotation. Figure 11 plots the coefficients of restitution versusErr/Ei
for this study. The four coefficients fall into two categories according to their responses toErr/Ei. The first category
in-cludesRnandRt, the two most commonly used coefficients
of restitution, which appear to be strongly correlated with Err/Ei. AsErr/Ei increases,Rnincreases butRtdecreases,
which verified the Broili (1973) deduction. The rotation gen-erated from impact results in an increased normal velocity and reduced tangential velocity. Furthermore, in case that more kinetic energy is converted to rotational energy during the collision, the collision yields a higherRnand lowerRt. In
Fig. 11a and b, data points for two sizes are not mixed, which can be attributed to the effect of sample sizes on the mag-nitude ofErr/Ei. In addition, the data points become more
scattered with increasingErr/Ei.Rv andRE belong to the
second category. There is no remarkable correlation between them andErr/Ei, as shown in Fig. 11c and d, so Rv and
RE are independent of the rotation motion in this study. In
conclusion, the improvement in the percentage of kinetic en-ergy converted to rotational enen-ergy leads to a largerRnand a
smallerRt, while it has no distinct influence onRvandRE.
As illustrated in Fig. 10a, more kinetic energy is converted to rotational energy during the collision with a smaller im-pact angle. Considering the effect ofErr/Ei onRnandRt,
a smaller impact angle is more likely to have a highRnand
a lowRt than a larger impact angle. Therefore,Rntypically
decreases with increasing impact angle, andRtincreases as
0.00 0.40 0.80 1.20 1.60 2.00
0 3 6 9 12 15
Err/Ei (%)
Rn
Size D = 10 cm Size D = 20 cm
0.00 0.20 0.40 0.60 0.80 1.00
0 3 6 9 12 15
Err/Ei (%)
Rt
Size D = 10 cm Size D = 20 cm
0.00 0.20 0.40 0.60 0.80 1.00
0 3 6 9 12 15
Err/Ei (%)
Rv
Size D = 10 cm Size D = 20 cm
0.00 0.20 0.40 0.60 0.80 1.00
0 3 6 9 12 15
Err/Ei (%)
RE
Size D = 10 cm Size D = 20 cm
(a) (b)
(c) (d)
Figure 11.The variations of four coefficients of restitution,(a)the normal coefficientRn,(b)the tangential coefficientRt,(c)the kinematic coefficientRvand(d)the kinetic energy coefficientRE, with the ratioErr/Ei.
two sample sizes show a clear distinction inErr/Ei, as shown
in Fig. 10a, which results in the difference in the mean val-ues ofRnandRtbetween two sizes in the first impact angle
interval in Fig. 5a and b.
5 Discussion
The test results demonstrated the correlation between the ro-tation and the effect of the impact angle on the coefficients of restitution. Under free-fall conditions, a higher percent-age of kinetic energy converted to rotational energy always induces a higherRnand a lowerRt. The percentage can be
associated with the ratio between the rebound angle and the impact angleβ/α. As the impact angle decreases, the ratio β/αincreases, and more kinetic energy is converted to rota-tional energy. In this section, the reason why a small impact angle achieves a highβ/αmore easily and its consequences are discussed.
5.1 The main reason for the highβ/αin the case of small impact angles
When the impact angle is small, the rebound angle easily ex-ceeds the impact angle and causes a highβ/α, which can be associated with the impact orientation and the damage caused by the impact. The sample has irregular cutting facets and rear edges in this study, while the landing plate was made of
concrete slabs of a lower hardness compared to the falling samples. Supposing that the spherical polyhedron impacts the landing plate with a corner or an edge, damage will occur. Figure 12a shows the indentations on the surface caused by the impacts and the rough areas resulting from the repeated damages. For an individual indentation, the diameterd and the depthhare measured and noted in Fig. 12a.
d= 3.5cm
h= 1.5 cm
d=1.7 cm
h=1.6 cm
d= 2.3 cm
h= 0.6 cm
d= 2.1 cm
h= 0.5 cm
Individual indentations
A rough area caused by repeated damage
Surface
Indentation
15o 30o Stair
(a) (b)
(c)
Figure 12. (a)Individual indentations and a rough area caused by the impacts and their influence on the rebound motion;(b)a simplified configuration used to evaluate the effect of the indentation; and(c)a small stair model used to evaluate the effect of the macro-roughness.
Another important factor in generating a highβ/αis the macro-roughness of the landing plate, which comes from re-peated damage to the slab surface. Assuming that the macro-roughness of the landing plate is represented as a small stair in Fig. 12c, the interaction between the falling sample and surface may have two stages in certain situations. In the first stage, the sample impacts the surface before the stair and leaves the surface with the original rebound velocity. Then, the sample contacts the stair, and the rebound veloc-ity changes in the second stage. The time interval between the two stages is so short that the two stages appear to fin-ish simultaneously. The probability that two-stage interac-tions occur is related to the magnitude of the impact angle. As Fig. 12c illustrates, if the default rebound angle is 15◦,
the stair can affect the rebound motion if the sample con-tacts the surface within 3.73 times the stair height before the stair. As the default rebound angle increases, the surface re-gion where the stair can affect the rebound motion decreases. Considering that a smaller impact angle will, in theory, in-duce a smaller rebound angle, the reduction of the impact an-gle must improve the risk of the sample contacting the stair. When the impact angle is small, the sample has more of a possibility of having a two-stage interaction and a highβ/α. In conclusion, the restriction from the configuration of the indentation, as well as the macro-roughness caused by re-peated damage, is more likely to affect the rebound motion when the impact angle is small. As a consequence, the re-bound angle easily exceeds the impact angle in the case of a small impact angle, which ultimately results in a highβ/α.
5.2 Interpretation of the normal coefficient of restitutionRnlarger than 1.0
Of the various consequences of the rebound angle being greater than the impact angle, high values of the normal co-efficient of restitutionRnmay be remarkable. Engineers
usu-ally take 1.0 as the upper bound ofRn in computer codes,
whereas several scholars have reported Rn values larger
than 1.0 (Azzoni et al., 1992; Paronuzzi, 2009; Spadari et al., 2012). In this section, the relationship betweenRn and the
direction transition of translational velocity is investigated. Considering that the rotation before impact is small in this study, the normal coefficient of restitution Rn can be
ex-pressed as Eq. (5) based on the basic definition in Sect. 1.1: Rn=vnr/vni=
p
Ert/Eit×(sinβ/sinα)= p
Ert/Ei
×(sinβ/sinα). (5)
By introducing an angle coefficient
λ=sinβ/sinα, (6)
Eq. (6) can be simplified as Rn=λ
p
Ert/Ei. (7)
Ert/Ei, the ratio between the translational energy after
im-pact and the total kinetic energy before imim-pact, is plotted in Fig. 13a with respect to the impact angle. As the impact an-gle increases, the mean value ofErt/Ei increases when the
impact angles are smaller than 36◦and then decreases. The peak values ofErt/Eiof the four impact angle intervals
de-crease gradually with increasing impact angles. In this study, the values ofErt/Ei are located in the range of 0.20 to 0.60
0 20 40 60 80 100
0 4 8 12 16 20 24 28 32 36 40 44 48 52 56 60 64
Ert/Ei (%)
Impact angle α (o)
Size D = 10 cm Size D = 20 cm
0.0 0.5 1.0 1.5 2.0 2.5 3.0 3.5 4.0
0 1 2 3 4 5 6
Rn
λ
Ert/Ei=0.6 Ert/Ei=0.5 Ert/Ei=0.4 Ert/Ei=0.3 Ert/Ei=0.2
(a) (b)
Figure 13. (a)The variation of the ratioErt/Eiwith the impact angle and(b)the correlation between the normal coefficient of restitutionRn and the angle coefficientλunder differentErt/Eilevels.
Figure 13b plots the relationship betweenRnand the
an-gle coefficient λ under different Ert/Ei. The value of Rn
increases when increasing the angle coefficient λ. Even if Ert/Eiis only 0.2,Rnis greater than 1.0 whenλ >2.24. An
extremely large rebound angle is not needed to generate such aλwhen the impact angle is small. For example, when the impact angle is 12 and 15◦, a rebound angle of 27.8 and 35.5◦ is sufficient to obtainλ >2.24. Assuming thatErt/Eiis
un-changed, a case in which the rebound angle is larger than the impact angle must lead to a higherRn. Although the value
ofλcorresponding toRn=1.0 varies withErt/Ei, the
con-ditionλ >1.0 is required to obtainRngreater than 1.0. As
shown in Fig. 13b,Rncannot exceed 1.0 if the rebound angle
is lower than the impact angle. As discussed in the previous sections, small impact angles easily result in unexpectedly large rebound angles. If the angle coefficientλformed by the rebound and the impact angle is sufficiently large, Rn will
exceed 1.0 even thoughErt/Eiis small. Furthermore,
assum-ing a constantErt/Ei, the reduction in the impact angle
de-creases the threshold value of the rebound angle that should be satisfied to achieve anRnin excess of unity, which means
that smaller impact angles are more likely to yieldRnlarger
than 1.0.
5.3 Relation between the normal coefficient of restitution and the kinetic energy loss
A smaller impact angle more easily obtains a highβ/αand a high percentage of kinetic energy converted to rotational energy, which then induces a higher Rn. However, the
ki-netic energy coefficient of restitution RE appears
indepen-dent of the percentage of kinetic energy converted to rota-tional energy. Therefore, simply treating a higher Rn as a
symbol of lower kinetic energy loss may be unreasonable. Stronge (1991) indicated that in the valuation of kinetic en-ergy dissipation, the normal coefficient of restitution is only reliable for nonfrictional collisions. Under frictional colli-sions conditions, the total kinetic energy may have a paradox-ical increase if the normal coefficient of restitution is adopted
0.0 0.2 0.4 0.6 0.8 1.0
0.0 0.5 1.0 1.5 2.0 2.5
RE
Rn
Rn=0.65 Rn=0.95
Figure 14.The variation of the kinetic energy coefficient of restitu-tionREwith the normal coefficientRn.
as the unique reference. As shown in Fig. 14, the correlation betweenRnandREis more complicated in this study, which
verifies the argument of Stronge (1991).
Increasing Rn will increase RE initially but decrease it
overall. For simplicity, two boundaries (Rn=0.65 andRn=
0.95) are added in Fig. 14. The kinetic energy coefficient of restitutionREincreases with increasingRnwhenRn<0.65,
in agreement with the relationship betweenRn and the
en-ergy loss level based on the elastic-plastic response analysis. IfRnis greater than 0.95, a largerRnindicates a smallerRE.
High values ofRnare associated with unexpectedly large
re-bound angles in this study, which means that the unexpect-edly large rebound angles can be related to a higher level of kinetic energy loss.RE is disordered ifRnlies in the range
of 0.65, 0.95, which is caused by the two different trends meeting. Therefore, the normal coefficient of restitutionRn
cannot be directly used in the evaluation of the kinetic energy dissipation level.
5.4 The difficulty in introducing the effect of impact angle into trajectory simulation
terms of the impact angle are significant. For this reason, the impact angle should be involved in determining the coeffi-cients of restitution in rockfall trajectory simulation. How-ever, some problems cause a barrier to developing a reason-able way to account for the effect of the impact angle in com-puter simulation.
First, although the test scales and conditions have little in-fluence on the general laws that the impact angle affects the coefficients of restitution, it is difficult to construct a uniform formula to reflect the effect under various test conditions. TakingRnas an example, the effect of the impact angle onRn
has been formulated by several different functions, such as the linear function (Wu, 1985; Richards et al., 2001), power function (Asteriou et al., 2012) and second-order polynomial (Cagnoli and Manga, 2003). In this study, the power function provides the best correlation coefficient in fitting data points ofRn. Furthermore, the mathematic expression regarding the
effect of the impact angle on the coefficients of restitution is abandoned in more experiments (Chau et al., 2002; James, 2015). Therefore, we cannot conclude which type of function is the best choice to describe the effect, and it is questionable whether a uniform expression occurs.
Another problem arises from the discreteness of data points. Given the impact angle, the discreteness of data points determines the reliability of the rebound velocity estimated by adopting a typical value of the coefficients of restitution. For all coefficients of restitution, the discreteness of data points experiences a reduction if the impact angle increases in this study. When the impact angle is large, it may be ac-ceptable to predict the rebound using a typical value of the coefficients of restitution, e.g., the mean value. However, the data points are extremely scattered under small impact an-gle conditions, which means that using a typical value in the simulation may be unreliable.
Therefore, further research should be carried out to estab-lish a reasonable and comprehensive method to reflect the effect of the impact angle on the coefficients of restitution in rockfall trajectory simulation. The stochastic model has more potential in achieving this target because it accounts for the variation of the coefficients of restitution in terms of various factors based on data collection (Jaboyedoff et al., 2005; Frattini et al., 2008; Bourrier et al., 2009; Andrew and Oldrich, 2017).
6 Conclusions
The coefficients of restitution are critical parameters in the predication of rockfall trajectory by computer codes. Both the terrain characteristics and kinematic parameters can sig-nificantly affect the coefficients of restitution. The effect of the impact angles on the coefficients of restitution has been observed, and some laws have been concluded in a series of tests. Until now, the existing laboratory tests have largely been limited to small-scale tests, and whether the previous
conclusion is valid for different scale tests is uncertain. The role of rotation is still unresolved in the effect of the impact angle on the coefficient of restitution.
In the present study, laboratory tests were performed using a 3-D motion capture system. Spherical limestone polyhe-drons with diameters of 10 and 20 cm were taken as samples, and C25 concrete slabs were adopted to form the landing plate. By altering the release height and the inclined angle of the landing plate, the effects of the impact angle on the coefficients of restitution were estimated under free-fall test conditions. The result comparison between our test and the existing small-scale tests indicated that several general laws occur when accounting for the effect of the impact angle, regardless of the test scales and conditions. The normal coef-ficient of restitutionRn, the kinematic coefficient of
restitu-tionRvand the kinetic energy coefficient of restitutionREall
decrease when increasing the impact angle, while the tangen-tial coefficient of restitutionRtincreases as the impact angle
increases in most cases. However, the reason for the magni-tude difference in the coefficients of restitution between the tests compared is unidentified because the tests differ from each other in multiple test conditions.
In the free-fall test, the rotation after impact dissipates part of the kinetic energy of the sample and plays an important role in the effect of the impact angle on the coefficient of restitution. The test results show that the percentage of ki-netic energy converted to rotational energy can be associated with the ratio between the rebound angleβ and the impact angleα. When the impact angle is small, the rebound angle is more likely to exceed the impact angle and yield a highβ/α for the indentations and macro-roughness caused by the im-pacts. As the impact angle decreases, the ratioβ/αincreases, and the percentage of kinetic energy converted to rotational energy increases. Givenβ/α, large samples are more likely to have a stead and small percentage than small samples. A higher percentage of kinetic energy converted to rotational energy always induces a higherRnand a lowerRt. However,
no correlations are observed in this study between the rota-tion energy and the other two coefficients of restiturota-tion,Rv
andRE. In addition,Rnbeing larger than 1.0 can be related to
the rebound angle being greater than the impact angle under small impact angle conditions.
Although it is verified in this study that several general laws regarding the effect of the impact angle on the coef-ficients of restitution are independent of the test scales and conditions, we still lack a reliable method to introduce the effect of the impact angle into rockfall trajectory simulation, which is caused by the discreteness of the measured data un-der small impact angle conditions and the absence of a uni-form and reasonable function describing the effect of the im-pact angle.
should be further investigated through more elaborate exper-iments. In view of this, the test results are valid for trajectory simulation codes based on a lumped-mass model and can be referenced in the trajectory predication of spherical rocks im-pacting hard surfaces using a rigid body model.
Data availability. The data sets of this experiment have been up-loaded to the Supplement.
Supplement. The supplement related to this article is available online at: https://doi.org/10.5194/nhess-18-3045-2018-supplement.
Author contributions. YW conceived the idea of this article and carried out the tests. WJ proposed some crucial suggestions for the evaluation of the experimental results and wrote the main part of the manuscript. SC contributed to the detailed design of the exper-iment. Data collecting, chart sorting and editing were completed by PS and CM.
Competing interests. The authors declare that they have no conflict of interest.
Acknowledgements. Sponsored by the Research Fund for
Excellent Dissertation of China Three Gorges University (no. 2018BSPY008), the National Natural Science Funds of China (no. 51409150), the CSC Scholarship (no. 201707620009) and the Open Research Programme of the Hubei Key Laboratory of Disaster Prevention and Mitigation (no. 2017KJZ03).
Edited by: Jean-Philippe Malet
Reviewed by: Maxime Farin and one anonymous referee
References
Agliardi, F. and Crosta, G. B.: High resolution three-dimensional numerical modelling of rockfalls, Int. J. Rock Mech. Min. Sci., 40, 455–471, 2003.
Andrew, M. and Oldrich, H.: Theory and calibration of the Pierre 2 stochastic rock fall dynamics simulation program, Can. Geotech. J., 54, 18–30, 2017.
Asteriou, P. and Tsiambaos, G.: Effect of impact velocity, block mass and hardness on the coefficients of restitution for rockfall analysis, Int. J. Rock Mech. Min. Sci., 106, 41–50, 2018. Asteriou, P., Saroglou, H., and Tsiambaos, G.: Geotechnical and
kinematic parameters affecting the coefficients of restitution for rock fall analysis, Int. J. Rock Mech. Min. Sci., 54, 103–113, 2012.
Azzoni, A., Drigo, E., Giani, G., Rossi, P., and Zaninetti, A.: In situ observation of rockfall analysis, in: Proceedings of the 6th inter-national symposium on landslides, Christchurch, 307–314, 1992.
Azzoni, A., Barbera, G. L., and Zaninetti, A.: Analysis and predic-tion of rockfalls using a mathematical model, Int. J. Rock Mech. Min. Sci., 32, 709–724, 1995.
Bourrier, F., Dorren, L., Nicot, F., Berger, F., and Darve, F.: Toward objective rockfall trajectory simulation using a stochastic impact model, Geomorphology, 110, 68–79, 2009.
Bozzolo, D. and Pamini, R.: Simulation of rock falls down a valley side, Acta Mech., 63, 113–30, 1986.
Broili, L.: In situ tests for the study of rockfall, Geol. Appl. Idro-geol., 8, 105–111, 1973.
Buzzi, O., Giacomini, A., and Spadari, M.: Laboratory investigation on high values of restitution coefficients, Rock Mech. Rock Eng., 45, 35–43, 2012.
Cagnoli, B. and Manga, M.: Pumice-pumice collisions and the effect of the impact angle, Geophys. Res. Lett., 30, 1636, https://doi.org/10.1029/2003GL017421, 2003.
Chau, K. T., Wong, R. H. C., Liu, J., Wu, J. J., and Lee, C. F.: Shape effects on the coefficient of restitution during rockfall impacts, in: Ninth International Congress on Rock Mechanics, ISRM Congress, Paris, 541–544, 1999.
Chau, K. T., Wong, R. H. C., and Wu, J. J.: Coefficient of restitution and rotational motions of rockfall impacts, Int. J. Rock Mech. Min. Sci., 39, 69–77, 2002.
Christen, M., Bartelt, P., and Gruber, U.: RAMMS – a modelling system for snow avalanches, debris flows and rockfalls based on IDL, Photogram. Fernerkund. Geoinform., 4, 289–292, 2007. Dorren, L. K. A.: A review of rockfall mechanics and modelling
approaches, Prog. Phys. Geogr., 27, 69–87, 2003.
Dorren, L. K. A.: Rockyfor3D (v5.2) revealed-Transparent de-scription of the complete 3D rockfall model, ecorisQ paper, available at: https://www.ecorisq.org/docs/Rockyfor3D_v5_2_ EN.pdf, last access: 30 March 2016.
Dorren, L. K. A., Berger, F., and Putters, U. S.: Real-size ex-periments and 3-D simulation of rockfall on forested and non-forested slopes, Nat. Hazards Earth Syst. Sci., 6, 145–153, https://doi.org/10.5194/nhess-6-145-2006, 2006.
Farin, M., Mangeney, A., Toussaint, R., Rosny, J., Shapiro, N., Dewez, T., Hibert, C., Mathon, C., Sedan, O., and Berger, F.: Characterization of rockfalls from seismic signal: Insights from laboratory experiments, J. Geophys. Res.-Solid, 120, 7102–7137, 2015.
Fornaro, M., Peila, D., and Nebbia, M.: Block falls on rock slopes-application of a numerical simulation program to some real cases, in: Proceedings of the 6th international IAEG congress, 6– 10 August 1990, Amsterdam, the Netherlands, 2173–2180, 1990. Frattini, P., Crosta, G. B., Carrara, A., and Agliardi, F.: Assessment of rockfall susceptibility by integrating statistical and physically-based approaches, Geomorphology, 94, 419–437, 2008. Giani, G. P., Giacomini, A., Migliazza, M., and Segalini, A.:
Exper-imental and theoretical studies to improve rock fall analysis and protection work design, Rock Mech. Rock Eng., 37, 369–389, 2004.
Guzzetti, F., Crosta, G., Detti, R., and Agliardi, F.: STONE: a com-puter program for the three dimensional simulation of rock-falls, Comput. Geosci., 28, 1079–1093, 2002.
Habib, P.: Note sur le rebondissement des blocs rocheux, in: Rock-fall dynamics and protective works effectiveness, ISMES Publ., 90, 123–125, 1976.
He, S. M., Wu, Y., and Yang, X. L.: Study of rock motion on slope, Chinese J. Rock Mech. Eng., 27, 2793-2798, 2008.
Heidenreich, B.: Small- and half-scale experimental studies of rock-fall impacts on sandy slopes, PhD Thesis, Ecole Polytechnique Fédérale de Lausanne, Lausanne, Switzerland, 2004.
Jaboyedoff, M., Dudt, J. P., and Labiouse, V.: An attempt to refine rockfall hazard zoning based on the kinetic energy, frequency and fragmentation degree, Nat. Hazards Earth Syst. Sci., 5, 621-632, https://doi.org/10.5194/nhess-5-621-2005, 2005.
James, G.: Rock-shape and its role in rockfall dynamics, PhD The-sis, Durham University, Durham, 2015.
Jones, C., Higgins, J. D., and Andrew, R. D.: Colorado Rockfall Simulation Program User’s Manual for Version 4.0, Colorado Department of Transportation, Denver, 2000.
Pappalardo, G., Mineo, S., and Rapisarda, F.: Rockfall hazard as-sessment along a road on the Peloritani Mountains (northeast-ern Sicily, Italy), Nat. Hazards Earth Syst. Sci., 14, 2735–2748, https://doi.org/10.5194/nhess-14-2735-2014, 2014.
Paronuzzi, P.: Probabilistic approach for design optimization of rockfall protective barriers, Q. J. Eng. Geol., 22, 175–183, 1989. Paronuzzi, P.: Field evidence and kinematical back analysis of block rebounds: the Lavone rockfall, Northern Italy, Rock Mech. Rock Eng., 42, 783–813, 2009.
Richards, L. R., Peng, B., and Bell, D. H.: Laboratory and field eval-uation of the normal coefficient of restitution for rocks, in: Pro-ceedings of Eurock, 4–7 June 2001, Espoo, Finland, 149–156, 2001.
Robotham, M. E., Wang, H., and Walton, G.: Assessment of risk from rockfall from active and abandoned quarry slopes, Transac-tions – Institut. Min. Metall., A.104, A25–A33, 1995.
Scioldo, G.: User guide ISOMAP & ROTOMAP-3D surface mod-elling and rockfall analysis, Geo & Soft International, Torino, Italy, 2006.
Spadari, M., Giacomini, A., Buzzi, O., Fityus, S., and Giani, G.: In situ rock fall tests in New South Wales, Australia, Int. J. Rock Mech. Min. Sci., 49, 84–93, 2012.
Stevens, W.: RockFall: a tool for probabilistic analysis, design of remedial measures and prediction of rock falls, Master thesis, University of Toronto, Toronto, 1998.
Stronge, W. J.: Friction in collisions: Resolution of a paradox, J. Appl. Phys., 69, 610–612, 1991.
Valentin, S. G., Oldrich, H., Andrew, M., and Franck, B.: Pierre3D: a 3D stochastic rockfall simulator based on random ground roughness and hyperbolic restitution factors, Can. Geotech. J., 52, 1360–1373, 2015.
Volkwein, A., Schellenberg, K., Labiouse, V., Agliardi, F., Berger, F., Bourrier, F., Dorren, L. K. A., Gerber, W., and Jaboyed-off, M.: Rockfall characterisation and structural protection – a review, Nat. Hazards Earth Syst. Sci., 11, 2617–2651, https://doi.org/10.5194/nhess-11-2617-2011, 2011.