Volume 6, No. 6, July - August 2015
International Journal of Advanced Research in Computer Science
RESEARCH PAPER
Available Online at www.ijarcs.info
An Empirical Analysis of Classification Trees Algorithm for Protein Datsets
R. Ranjani Rani
1, P. Manikandan
2, Dr.D. Ramya Chitra
3 1M.Phil Research Scholar, 2 Ph.D Research Scholar, 3 Assistant ProfessorDepartment Of Computer Science, Bharatiar University, Coimbatore
Abstract: In general, the Classification tree can be used to predict membership of cases or objects in the classes of a categorical dependent variable from their measurements on one or more predictor variables. Generally, Classification tree analysis is one of the major techniques used in so-called Data Mining. In this paper we are analyzing the performance of 4 classifiers trees algorithms namely J48 Decision tree, Naïve Bayes Tree, Random Forest and Random tree. In this article we used protein datasets namely the dengue virus and the Superoxide Dismutase1 (SOD1) protein datasets for calculating the performance by using the cross validation parameter. And finally we performed the comparative analysis based on the factors such as the classification accuracy, performance and error rate measures on all the algorithms.
Keywords: Data Mining, Classification, J48 Decision Tree, Random Forest, Random Tree, NaïveBayes Tree, Dengue, SOD1 datasets.
I. INTRODUCTION
Classification trees are not extensive in the fields of probability and statistical pattern recognition but classification trees are broadly used in applied fields as diverse as medicine (diagnosis), computer science (data structures), botany (classification), and psychology (decision theory). Classification trees enthusiastically lend themselves to creature displayed graphically, helping to make them easier to understand than they would be if only a strict numerical analysis were feasible [1]. In the weka tool several classification trees algorithms exist, such as Decision stump, Random Forest, Random Tree, REP Tree, LMT, MSPP and J48.
In this paper comparison is made to find out which test option is the best for tree classifier algorithm called J48 Decision tree, Naïve Bayes Tree, Random Forest and Random tree. In the test option there are four kinds of parameter like training set, supplied test set, cross validation and percentage spilt. We use the cross validation parameter to calculate the data set values. This paper uses the Dengue virus and SOD1 proteins dataset for comparison of those algorithms. And our paper is structured as follows. Section 2 describes the literature review, Section 3 describes the methodology for the proteins dataset and Section 4 describes our experimental result. And finally Section 5 gives the Conclusion and Future work.
II. LITERATURE REVIEW
Yongheng Zhao et al., compared the decision tree methods for finding active objects. They described several kinds of decision trees for finding active objects by multi-wavelength data, such as Random Tree, J48, Decision Stump, Random Forest, NBTree, REPTree, AdTree. The classification performances of the decision trees are analyzed and discussed. The investigational outcome show that when different decision trees are applied in discriminating active objects from non-active objects, Decision Stump is best for speed and the AD Tree is best for accuracy while the J48 is the best for both accuracy and speed [2].
N. Saravanan et al., proposed a fault diagnosis of spur bevel gear box using discrete wavelet features and Decision Tree classification. All possible types of transients in vibration signals generated by faults in a gear box are represented by the wavelet transform (WT). In their work, a discrete wavelet is used for feature extraction and their relative efficiency in feature extraction is compared. The main steps in pattern classification are classification and feature extraction. They used discrete wavelets for feature extraction and a Decision Tree for classification. For feature selection as well as for classification the J48 Decision tree algorithm has been used [3].
Random Forest (RF) variable importance measures in identifying the true predictor among a large number of candidate predictors. And they conclude that the RF methodology is attractive for use in classification problems when the goals of the study are to produce an accurate classifier and to provide insight regarding the discriminative ability of individual predictor variables [4].
Robin Genuer, et al., focused on the random forest classification algorithm. Their main contribution is twofold: to provide some experimental insights about the behaviour of the variable importance index based on random forests and to propose a strategy involving a ranking of explanatory variables using the random forests score of importance and a stepwise ascending variable introduction strategy [5].
Fei Tony Liu et al., proposed a base learner VR- Tree which builds tree with variable-randomness. VR-Trees are able to extent from the conventional deterministic trees to the complete-random trees using a probabilistic limit. They discovered that the two halves of the spectrum have their dissimilar characteristics; and the understanding of which allows us to recommend a new method in constructing better decision tree ensembles. They named this approach as Coalescence, which coalesces a number of points in the random-half of the spectrum. In their empirical study, Coalescence defenses top among the benchmarking ensemble methods. [6]
used to classify the specific bold group with respect to the age as a dependant variable. Random tree construct depth decision tree respect to J48. From tested data it concluded that those exact blood groups have more probability of SCD. [7]
Li-Min Wang, et al., proposed a novel algorithm, Self-adaptive NBTree, which induces a hybrid of decision tree and Naive Bayes. The Naive Bayes node helps to solve overgeneralization and overspecialization problems. The experimental results on a variety of natural domains indicate that Self-adaptive NBTree has clear advantages with respect to the generalization ability [8].
Ron Kohavi proposed a new algorithm NBTree which induce the hybrid of Naive-Bayes classifiers and decision-tree classifiers: the decision-decision-tree nodes hold univariate splits as regular decision-trees, but the leaves holds Naive-Bayesian classifiers.
The method retains the interpretability of decision trees and Naive-Bayes, while resulting in classifiers that often outperform both constituents, especially in the bigger databases tested [9].
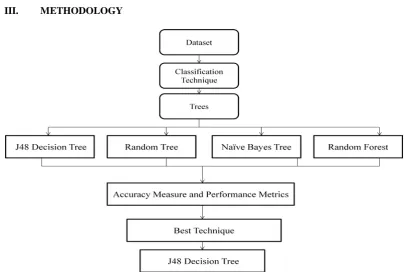
III. METHODOLOGY
The four different classifiers are used to find the best suited algorithm for the classification of Dengue and SOD1 protein datasets. The machine learning tool weka is used for comparative analysis of those classifiers. The process flow for the comparative analysis is shown in Fig 1.
A. Dataset Description:
a. Dengue Protein:
The Dengue Virus Protein DENV E (envelope) is found on the viral surface and it is important in the initial attachment of the viral particle on the host cell. Generally, the dengue virus is transmitted by the mosquito known as Aedes. Numerous molecules which interact with the viral E protein and the mannose receptor have shown to be important factors mediating attachment and viral entry. This dataset contains 100 instances and 6 attributes and it is collected from the PDB database.
b. SOD1:
[image:2.595.94.508.347.619.2]SuperOxide Dismutase (SOD1) is an enzyme that is in human and it encode by SOD1 gene located on chromosome 21. It’s one of three human superoxide dismutases. This dataset contains 77 instances and 5 attributes and it is collected from the PDB database.
Figure 1: Process Flow Diagram for comparative analysis.
B. Classification:
Classification techniques are more appropriate for predicting or relating data sets with binary or nominal categories. This paper has analyzed four different classification algorithms namely J48, Random Forest, Random Tree and Naïve Bayes Tree to predict which of the method is most suitable for the predicting the protein structure.
a. J48:
J48 classifier is a straightforward C4.5 decision tree for classification. The decision tree approach is most useful in
classification problem. It constructs a binary tree .Using this technique, a tree is built to model the classification process. After the tree is built, it is applied to each tuple in the database and results in classification for that tuple [10].
b. Random Forest:
of hundreds to thousands of trees, where individual tree is grown using a bootstrap sample of the original data [11].
c. Random tree:
A random tree is a tree built randomly from a set of probable trees having K random features at each and every node. In this context “At random” means that in the group of trees each tree has an equal possibility of being sampled. Random trees can be generated proficiently and the combination of large sets of random trees generally leads to accurate models. An extensive research in the current years over Random trees in the field of machine Learning is carried out [12].
d. Naïve Bayes Tree:
The Naive Bayes algorithm is a straightforward probabilistic classifier that calculates a set of probabilities by counting the frequency and combinations of values in a
given data set. The Bayes theorem has been used by this algorithm and assumes all attributes to be independent given the value of the class variable. This restricted independence assumption rarely holds true in realworld applications, Therefore it has characterization as Naive yet the algorithm tends to perform well and learn quickly in various supervised classification problems [10].
IV. EXPERIMENTAL MEASURES
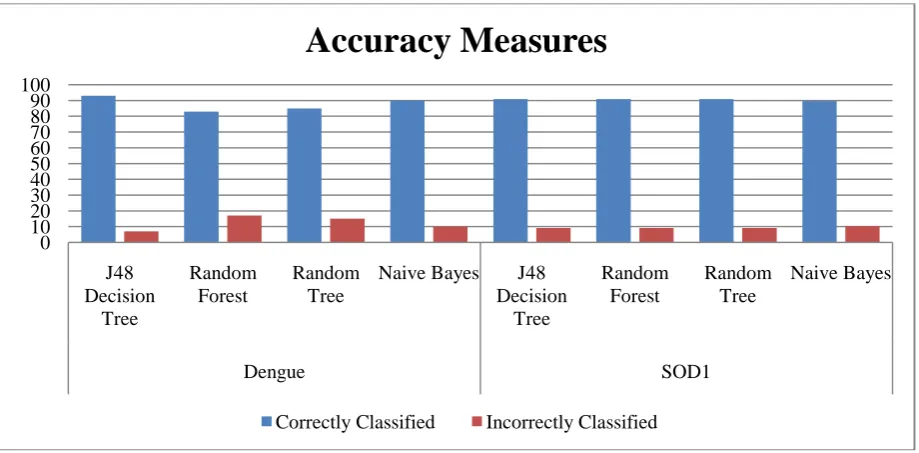
[image:3.595.72.519.276.406.2]In this paper the experimental measures are calculated by using the performance factors such as the classification accuracy, performance measures and the error rates to determine the best algorithm for the proteins dataset. The accuracy measure by class for the trees classifier is depicted in Table 1.
Table 1: Comparison of accuracy measures for the classification trees using protein datasets.
Datasets Algorithms Correctly Classified Incorrectly Classified
Dengue
J48 Decision Tree 93 7
Random Forest 83 17
Random Tree 85 15
Naive Bayes 90 10
SOD1
J48 Decision Tree 90.9091 9.0909
Random Forest 90.9091 9.0909
Random Tree 90.9091 9.0909
Naive Bayes 89.6104 10.3896
From the results (Table 1) it is inferred that for the dengue protein dataset the J48 Decision Tree performs well as compared to the Random Tree, Naïve Bayes Tree and Random Forest. The J48 Decision Tree algorithm gives more correctly classified instances compared to others. Also the error rate for J48 Decision Tree algorithm is less
compared to others. Also for the SOD1 protein dataset the J48, Random forest and Random Tree gives similar results in which has more correctly classified instances better than NBTree and less incorrectly classified instances than NBTree.
Figure 2: Comparison of accuracy measures for the classification trees using protein datasets.
0 10 20 30 40 50 60 70 80 90 100
J48 Decision
Tree
Random Forest
Random Tree
Naive Bayes J48 Decision
Tree
Random Forest
Random Tree
Naive Bayes
Dengue SOD1
Accuracy Measures
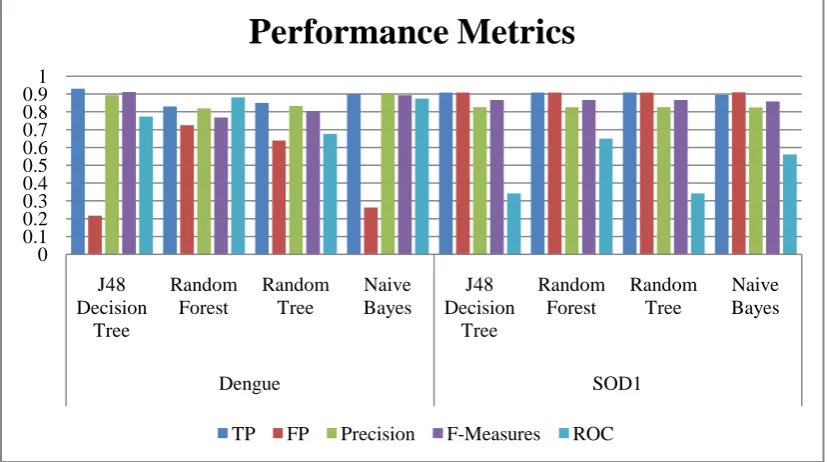
[image:3.595.69.529.495.721.2]Table 2: Comparison of performance measures for the classification trees using protein datasets.
Datasets Algorithms TP FP Precision F-Measures ROC
Dengue
J48 Decision Tree 0.93 0.217 0.893 0.911 0.773
Random Forest 0.83 0.725 0.819 0.768 0.882
Random Tree 0.85 0.639 0.833 0.805 0.677
Naive Bayes 0.9 0.263 0.904 0.893 0.874
SOD1
J48 Decision Tree 0.909 0.909 0.826 0.866 0.342
Random Forest 0.909 0.909 0.826 0.866 0.649
Random Tree 0.909 0.909 0.826 0.866 0.342
Naive Bayes 0.896 0.91 0.825 0.859 0.561
From the experimental results (Table 2), it is inferred that for different cross validation parameters such as 5,10,15,20 and 25 by using the dengue protein dataset, the TP Rate, Precision, ROC, F-Measure values decreases, and the FP rate value increased for the j48 decision tree algorithm, and fluctuates for the Random forest tree, Random tree algorithm and the Naïve Bayes Tree algorithm. The performance metrics for the classification trees is shown in Table 2. The accuracy measure for tree classifier is shown in Fig 2.
[image:4.595.91.505.352.583.2]From the experimental results (Table 2), it is inferred that for different cross validation parameters such as 5,10,15,20 and 25 by using the SOD1 protein dataset for the J48 decision tree algorithm, the TP Rate, Precision, F-Measure, Kappa values increases and the FP rate and ROC decreases, For the Random forest tree algorithm and Naïve Bayes Tree, the TP Rate, FP rate, Precision, F-Measure values remains standard and the ROC value fluctuates. Also for the Random tree algorithm, the TP Rate, Precision, ROC, F-Measure values and the FP rate values fluctuates.
Figure 3: Comparison of performance measures for the classification trees using protein datasets
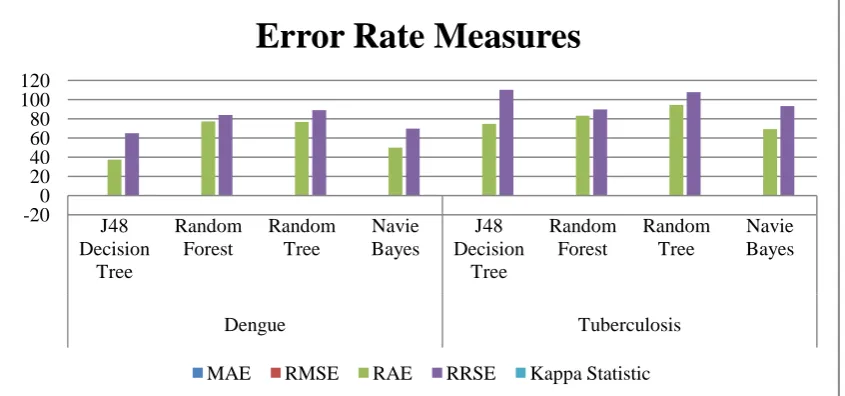
Table 3: Comparison of error rate measures for the classification trees using protein datasets.
Datasets Algorithms MAE RMSE RAE RRSE
Kappa Statistic
Dengue
J48 Decision Tree 0.0827 0.2125 37.39 64.929 0.7632
Random Forest 0.171 0.2746 77.3341 83.8752 0.1634
Random Tree 0.1699 0.2914 76.8715 88.9507 0.3068
Navie Bayes 0.1108 0.2287 50.1175 69.8622 0.6703
SOD1
J48 Decision Tree 0.1078 0.2391 85.7154 100.4711 0
Random Forest 0.105 0.2313 83.526 97.1885 0
Random Tree 0.1091 0.2387 86.7997 100.2796 0
Navie Bayes 0.1475 0.2559 117.369 107.5307 -0.0216
0 0.1 0.2 0.3 0.4 0.5 0.6 0.7 0.8 0.91
J48 Decision
Tree
Random Forest
Random Tree
Naive Bayes
J48 Decision
Tree
Random Forest
Random Tree
Naive Bayes
Dengue SOD1
Performance Metrics
[image:4.595.66.530.617.754.2]From the Table 3, it is inferred that the error rate measures for the J48 decision tree algorithm by using the dengue protein dataset using different cross validation parameter such as 5,10,15,20 and 25 the kappa value decreases, MAE, RMSE, RAE values increased and the RRSE value fluctuates. For the Random Forest tree algorithm, Random tree algorithm, and the Naïve Bayes tree algorithm the kappa, MAE, RMSE, RAE and RRSE values fluctuates.
From the Table 3, it is inferred that the error rate measures for the J48 decision tree algorithm by using the
[image:5.595.88.511.204.402.2]SOD1 protein dataset using different cross validation parameter such as 5,10,15,20 and 25 the kappa value increases, MAE, RMSE, RAE and the RRSE value fluctuates. For the Random Forest tree algorithm, the kappa remains standard, MAE, RMSE, RAE and RRSE values fluctuates. And also for the Random tree algorithm, the kappa, MAE, RMSE, RAE and RRSE values fluctuates. Similarly for the Naïve Bayes tree algorithm, the kappa, RMSE, RRSE values fluctuates while MAE and RAE values decrease.
Figure 4: Comparison of error rate measures for the classification trees using protein datasets.
For Dengue protein dataset, it is inferred that for the correctly classified instances the J48 decision tree classification algorithm performs 10.753% better than Random Forest algorithm, 8.603% better than Random Tree algorithm, and 3.225% better than Naïve Bayes Tree algorithm. For SOD1 protein dataset, it is inferred that for the correctly classified instances the J48 decision tree, Random forest, and Random tree classification algorithm performs 1.4285% better than Naive Bayes tree algorithm.
V. CONCLUSION AND FUTURE WORK
In this paper the performance of four different classification algorithms, J48, Random forest, Random Tree and Naïve Bayes Tree has been analyzed. The Dengue and SOD1 dataset has been used FOR THE analysis of these classifiers. The performances of classifiers are calculated by using the different cross validation parameter. And finally the algorithms are analyzed by comparing factors such as accuracy and performance measure. From the results it is observed that the J48 algorithm performs well for Dengue protein than the other three classification algorithms whereas J48, Random Forest and Random Tree algorithm performs similarly well for SOD1 protein to classify the methods to predict the protein structure. Hence it is proved that the J48 decision tree algorithm performs better than the other classifiers for both the datasets under different cross validation parametric values. In future the classifiers can be improved and tested on different datasets.
VI. REFERENCES
[1]. Sankaran Mahadevan, Ramesh Rebba, “Validation of reliability computational models using Bayes networks”, Reliability Engineering and System Safety 87 Pages- 223– 232, (2005).
[2]. Yongheng Zhao, Yanxia Zhang , “Comparison of decision tree methods for finding active objects”, Advances in Space Research, 41 , pages: 1955–1959, (2008)
[3]. N. Saravanan *, K.I. Ramachandran, “Fault diagnosis of spur bevel gear box using discrete wavelet features and DecisionTree classification” Expert Systems with Applications 36, Pages: 9564–9573, ( 2009)
[4]. Empirical
characterization of random forest variable importance measures”,
[5]. Robin Genuer, Jean-Michel Poggi, Christine Tuleau-Malot, “Variable selection using random forests”, Pattern Recognition Letters 31Pages: 2225–2236. (2010)
[6]. Fei Tony Liu, Kai Ming Ting, Yang Yu, Zhi-Hua Zhou, “Spectrum of Variable-Random Trees”, Journal of Artificial Intelligence Research 32 ,Pages: 355-384, (2008) [7]. Ashokkumar Vijaysinh Solanki, “Data Mining Techniques
Using WEKA classification for Sickle Cell Disease “, International Journal of Computer Science and Information Technologies, Vol. 5 (4) , Pages:5857-5860, (2014)
-20 0 20 40 60 80 100 120
J48 Decision
Tree
Random Forest
Random Tree
Navie Bayes
J48 Decision
Tree
Random Forest
Random Tree
Navie Bayes
Dengue Tuberculosis
Error Rate Measures
[8]. Li-Min Wang, Xiao-Lin Li, Chun-Hong Cao, Sen-Miao Yuan, “Combining Decision Tree and Naïve Bayes for Classification”, Knowledge-Based systems Volume 19, Issue 7, Pages: 511-515, November (2006).
[9]. Ron Kohavi, “Scaling up the Accuracy of Naïve Bayes Classifiers: A decision Tree hybrid”, Proceedings of the Second International Conference on Knowledge Discovery and Data Mining”, Pages:202-207, ISBN 978-1-57735-004-0
[10]. Tina R. Patil, Mrs. S. S. Sherekar,” Performance Analysis of Naive Bayes and J48 Classification Algorithm for Data
Classification”, International Journal Of Computer Science And Applications Vol. 6, No.2, ISSN: 0974-1011, Apr (2013)
[11]. Xi Chen, Hemant Ishwaran, “Random forests for genomic data analysis”, Genomics 99, Pages: 323–329, (2012) [12]. Jehad Ali,Rehanullah Khan, Nasir Ahmad,Imran Maqsood,