!
"
#"#
$ % %#
&
'
((( )
Image Processing and Pattern Classification Technique in a Machine Vision System
that Identifies and Classifies the Plant Diseases Based on the Visual Symptoms.
M. Prabukumar *
Assistant Professor [Senior], School of Information Technology & Engineering (SITE), VIT University,
Vellore- 632014, India, [email protected]
Balamurali Krishna
Post Graduate Student, School of Information Technology & Engineering (SITE), VIT University,
Vellore-632014, India, [email protected].
J. Kamalakannan
Assistant Professor [Senior], School of Information
Technology & Engineering (SITE), VIT University, Vellore-632014, India, [email protected]
Abstract:The proposed method in this paper is to perform the classification using SVM classifier by considering the input features from discrete wavelet transform, to identify disease in the plant by using visual symptoms. Testing has been done by using 40 images of banana leaf. The classification accuracy of the proposed method is 97% which is better compare with 86% of accuracy, produced by Back-propagation Neural Network (BPNN) method.
Keywords:Image Processing, Visual Symptoms, DCT, DWT, SVM, Pattern Reorganization, Back-propagation Neural Network.
I. INTRODUCTION
The plants are major driving source for eco-balance and mainly the living source for all the living things in the world. Such plants are getting affected by diseases due to climatic changes and pollution. Hence, identifying such disease in naked eye is not an easy task to differentiate at the initial stage. So there is a need of automated system or method to identify the disease which will be very much useful for crop producers and farmers.
There are many other classifiers namely Decision tree, Memetic algorithm, etc., these classifiers needs optimization packages like LQ, LP. The Optimization means learning the new patterns and get trained by algorithm itself for future classification. Back-Propagation Neural Network (BPNN) and SVM are well suited methods for non-Linear classification. BPNN is the unsupervised algorithm which has advantage over other network due to its error correction learning rule. Error propagation consists of two passes through the different pass as forward and backward pass. In the forward pass the input vector is applied and set of outputs is produced as the actual response of the network. The synaptic weight of the networks is all fixed in the forward pass. In the backward pass the synaptic weights are all adjusted in accordance with an error-correction rule.
SVM has its own kernel function in it. Secondly, the speed of the SVM is much faster than the other classifiers i.e., SVM can classify 2-million points in 10 space in 21 seconds, where as others will take same number of points for 10 minutes.
The DWT is used for feature extraction instead of other feature extraction methods because it has the advantage that provides time and frequency information and work with less complexity. So we can extract the feature more efficiently in less time.
Thus, BPNN and SVM are very attractive in recognition and classification tasks. The results of both the approaches were compared.
The rest of the paper is organized as follows, in section 2, the materials and a method is discussed. In section 3 results and discussion is given. Finally conclusion is driven in section 4.
II. MATERILS AND METHODS
A. Input Data
The banana plant’s leafs image of size 256 X 256 pixel is taken as an input. There are totally 40 images were taken, It is the collection of both the healthy leaf images and diseased leaf images. The type of disease consider are Black Sigatoka, Cordana leaf spot and Rose Beetle in different stages. The collections of images are taken from the link www.iita.org.Ten images were used for the training and 40 images for the testing. The images should have keen texture details of leaf for this method to produce better result.
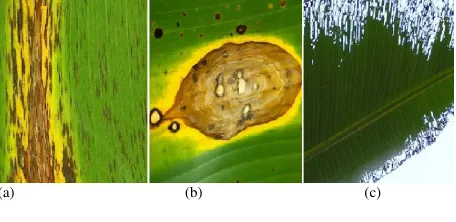
[image:1.612.324.552.582.693.2](a) (b) (c)
Figure 1. Image of banana leafs showing visual symptoms of damages caused by:
Black Sigatoka disease is also called as black leaf streak and it is caused by the fungus mycosphaerella fijiensis. It exists in the form of spores. It is seen in tropical and sub-tropical summers or under the conditions of high humidity and rainfall. It mainly affects the youngest leafs. The visual symptoms appear about 15-20 days after initial infection. Initially streaks will appear as narrow rusty brown in size of 2mm wide and 20mm long, and later enlarge with extreme color change and shape, the colors may be red, brown and black, sometimes with a purple tinge. The shapes are fusiform and elliptical. At final stage the leaf dries completely by showing light gray with dark brown or black border and yellow transition zones between border and green leaf tissue. It can be controlled by costly fungicide spray.
Rose beetle will cause damages on leafs for feeding larvae. They mostly feed on young shoats or new foliage leaf at night and remains under shelter during day time. Leaf damage symptoms are typically of notched or serrated edges with a ragged appearance. These damages do not allow producing enough amounts of starch and leads to fungal infection. This can be controlled by biological method using fungal pathogen, beauveria bassiana which will attack larvae and metarlizium anisopline attacks adult rose beetle.
Cordana leaf spot is caused by fungus namely Cordana musae and Cordana johnstonii. This will cause due to climatic condition like increasing temperature and decreasing relative humidity. This is more common in south Florida and Central America. The infected regions will have ampulliform appressoria in shape and dark gray in color. This can controlled by spraying solution namely Propiconazole from air. This solution is a mixture of 400ml with 8 to 10 liters spraying oil without adding water.
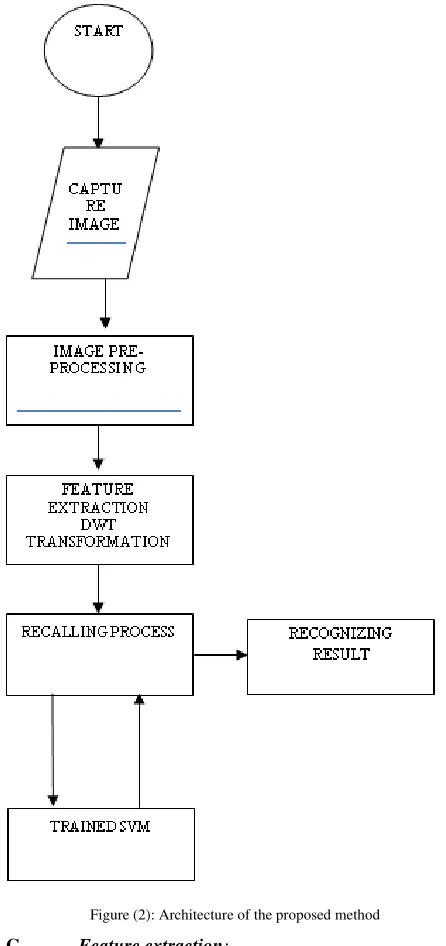
B. Architecture
The architecture of proposed system is shown in figure 2. First, we have extracted some features of image as an input for the classification. There few methods are available for feature extraction like Fourier transformation and wavelet transform. Here we used Discrete Wavelet transform (DWT) for feature extraction due its popularity and its accuracy level, which is mainly very used is pattern recognition. The Support Vector Machine (SVM) is used to classification. The SVM is also majorly used in pattern recognition system because it is a high capable of dealing with non-linear systems and decision surface.
The step by step explanation for understanding the architecture as follows
Step 1: Capture the image of the diseased region on leaf. Step 2: Image preprocessing such as noise removal and segmentation is preferred for better performance of the method of classification.
Step 3: From pre-processed image, features are extracted using second level discrete wavelet transform (DWT). Step 4: Recalling process: It will classify the type of disease from the trained SVM classifier.
Figure (2): Architecture of the proposed method
C. Feature extraction:
Images can be represented both in terms of local spatial and frequency contents using wavelet transforms. The Fourier transform and DCT provides global frequency characteristics of an image, but they fail to provide local frequency characteristics. This drawback is overcome in wavelet transforms by using its scaling property. Wavelets-based feature extraction is used for better feature extraction.
[a] Discrete wavelet transformation (DWT)
The discrete set of scales and translation are used to apply the DWT technique. Initially the parameters are digitized on a logarithmic grid. Sampling of grid is done with discretized scale (k) and translation ( ) of parameters,
the mathematical representation is and
= , where x, y z, of all integers.
[image:2.612.320.543.49.522.2](1)
Hence signal z(t) is decomposed by following equation(2) and (3).
(2) Where
(3)
For the discrete-time signal z[y], the wavelet decomposition on I octaves is given by
(4) Where ci, k i=1 …I: wavelet coefficients and di, k i=1… I:
scaling coefficients.
The wavelet and the scaling coefficients are given by,
(5)
(6) where gi[n-2ik] and hI*[n-2
I
k] represent the discrete wavelets and scaling sequences, respectively, and (*) indicates complex conjugate.
In case of images, the DWT is applied to each dimension separately. This results in an image D being
decomposed into a first level approximation component Da1,
and detailed components Dh1, Dv1 and Dd1; corresponding to
horizontal, vertical and diagonal details
The approximation component (Da) contains low
frequency components of the image while the details
components (Dh, Dv and Dd) contain high frequency
components. Thus
(7)
Here the feature extraction is done in second level approximation, so we get proper details of the components. The below equation is used for Nth level of approximation.
(8) At each level of approximation the image signal will be decomposed to its half the length of previous level. So level increase, the compact but rough approximation is gained. Thus, wavelet is the simple method to interpreting the image information. Daubechies-4 is chosen as mother wavelet because it will increase accuracy of classification.
D. Back-Propagation neural network (BPNN)
Inputs and outputs are normalized with respect to their maximum values. The neural networks work better for 0 and 1. For each training pairs, assume there are I inputs given by
{I}I I*1 and n outputs {O}o n*1 in a normalized form.
Assume the number of neutrons in the hidden layer to lie
between I<m<2I [X] represents the weights of synapses
connecting Input neurons and hidden neurons and [Y] represents weights of synapses connecting hidden neurons and output neurons. Initialize the weights to small random values usually from -1 to 1. In general can be assumed as 1 and the threshold values can be taken as zero.
(9)
(10)
(11)
One set of inputs and outputs are required for training data. Present the pattern to the input layer as inputs to the input layer.
DWT coefficients pass as input
Recognizing Result Figure (3): Work diagram of BPNN
The output of the input layer may be evaluated using linear activation function
(12)
Inputs to the hidden layer are calculated by multiplying corresponding weights of synapses as
(13) Inputs to the output layer is computed by multiplying corresponding weights of synapses as
(14) Calculate the error and the difference between the network output and the desired output as for the I th training set as
(15)
Error rate is calculated using
(16)
Repeat the above process, unit the convergence in the error rate is less than the tolerance value.
E. Support vector machine (SVM)
Support Vector Machine is a famous classification technique. It mainly works with minimum of two classes with labeled data and gives the result as labeled or unlabeled data. Linear or non-linear class boundaries are studied systematically by this classifier. This SVM classifier has two basic techniques training and testing. The training of SVM means teaching the classifier with known data called as training set.
[a] The study of SVM classification
The patterns are denoted by vectors which are to be
classified and it is denoted by X Rn. The scalar y denote its
class label that is y=±1. There are two types of classifiers in SVM one is linear and non-linear classifier.
Linear SVM classifier is the easiest method in which input patterns are separated linearly. Therefore linear function is in the form
(17) The plane which separates the training samples from two different classes is called hyperplane. Therefore, the above equation can be written as
Non-linear SVM classifier will use non-linear operator (.) to map the input pattern
X into higher dimensional space. The non-linear classifier equation is
(19) which is linear in terms of transformed data but
non-linear in terms of the original data X Rn
. the parameters of
decision function f(x) are determined by the minimization is (20) Subject to
(21) SVM kernel functions are more important concept in SVM classification. In linear function they can act efficiently on linearly separable data point but not for non-linear data points. So, this kernel functions introduced as a relaxation of the margin so the some points are accepted to occupy the opposite margin. Mercer’s theorem states that kernel K(.,.) map’s the non-linear function and g(.) is defined on the kernel.
Kernel satisfies followings
(22) The polynomial kernel is defined as
(23) Function of non-linear input space become as
(24)
Where i is the Lagrange multipliers, xi the support
vectors, K(xi,x) the convolution of the inner product for the
feature space and the support vectors are equivalent to linear
decision functions in the high-dimensional feature space 1,
2, 3,,,,,,, N(x). Using different functions for the convolution
of the inner product K(x, xi), one can construct learning
machines with different types of non-linear decision surfaces in the input space. Using decision rule degree‘d’ the polynomial learning machine is constructed. Hence, the polynomial kernel equation becomes
(25) By the above equation function becomes
(26) The Radial based function machine is used for radial separable input space. Hence N is the support vector, the width parameter of the kernel function, K˚ (|x-xi|) depends
on the distance |x-xi| between two vectors. After applying
this radial set of decision rules, hence the decision function becomes
f(x) =sign ( (27)
[b] The study of SVM classification of multiple classes
Several two-class SVM’s are constructed and each one is trained with one class as positive and other class as negative. In that property of hyperplane can only determine a hyperplane of two classes, these hyperplane class pair should be trained individually. For unknown sample, the decision must be made between all hyperplanes. Over fitting issues should be carefully addressed in training stage because of too many degrees of freedom.
A training model which has over fitting problem results in poor predictive performance. This over fitting problem can be eliminated through selecting the best dimensionality as well as dimensionality reduction for each class pair.
Alternate scheme that popularly adopted is using one-against-one SVM, this scheme has advantage of lower training complexity, because the number of hyperplanes remain the same as the number of classes. This scheme has disadvantage of customizing the best feature set as well as dimensionality reduction. It use a universal feature set for the hyperplane corresponding to a class to the rest classes. This scheme is used for identifying similar classes. Figure 3 show the working of multiple classes SVM.
ALL EXTRACTED DWT COFFICIENTS
FINAL OUTPUT
Figure (4): Block diagram of multiple class SVM
III. RESULT AND DISCUSSION
A. Level of wavelet decomposition
Wavelet coefficients are taken from 40 images of banana leaf images of 256 X 256 using DAUB4 wavelet decomposition which will produce 15313 wavelet approximation coefficients in level-1, 3722 in level-2 and 1444 coefficients in level-3. Here we have used level-2 wavelet decomposition because it has very small vector size and the accuracy of the classification is more.
B. Classification of Banana Images
The wavelet feature of banana images is computed then passed to BPNN and SVM for classification. Results are compared and absorbed. The result says SVM has higher accuracy than BPNN.
(a) Classification from Back-Propagation Neural
Network
Feature extraction is done by using wavelet toolbox of Matlab 7.5. BPNN program is written using Matlab 7.5. Here we implemented BPNN with four input layers, three hidden layers and four output layers. The features are sent as a node to input layer and the trained image is calculated according to the input nodes and output nodes. The banana images in the input data set is 40, 10 images are used in
Class 1- Class 2
Feature
Class 1- Class 3
Feature
Class 1- Class 3
Class 1-
Class 2
Class (n-1) - Class n Class (n-1) -
Class n
Feature
training and 40 are used in testing. The error tolerance of this method is 10% due to misclassification of images. The classification depend on the order in which input vector is presented to the network, hence we used randomized presentation of input images. Thus diseases categorization is done by this experiment.
Table 1: Classification result from Back-Propagation neural network
Total number of images 40
Number of normal images 5
Number of abnormal images 35
Number of images misclassified 4
Classification accuracy (%) 90
[b] Classification from support vector machine
SVM classification program is developed by using OSU SVM toolbox of Matlab 7.5. In this paper we treat classification of banana images as a multi class classification problem. Here we determine what type of diseases is plant is infected. We initiated with three diseases which mentioned previously. Use of SVM involves training and testing process, training SVM is a toughest part of a machine learning process. The training is done with 10 images and testing is made with 40 images, the testing is performed by kernel functions and the types are linear kernel function, polynomial kernel function, and radial basis function. Among these RBF (radial basis function) has higher accuracy and polynomial has similar accuracy as radial basis function. Hence we used multi class voting is taken from three classes of SVM to finalize the output. The three classes are paired as class-1 and class-2, class-1 and class-3, class-1 and class-4. Class-1 contains normal images and classes 2, 3, 4 have abnormal images of three diseases.
Table 2: Classification results from support vector machine
Kernel used
Total num ber of imag es
Number of images in training
Number of images in testing
Image misclassi fied
Classific ation accuracy (%) Nor
mal Abnor mal
Nor mal
Abnor mal
Linear
Polyno mial
Radial basis functio n
40
40
40 4
4
4 6
6
6 5
5
5 35
35
35 3
2
2
96
97
97
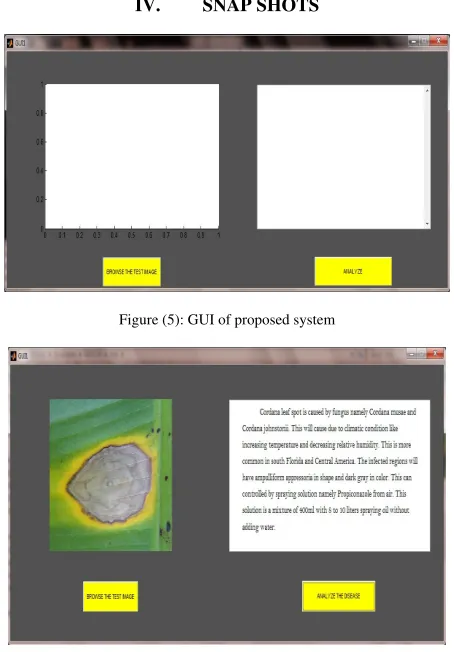
IV. SNAP SHOTS
Figure (5): GUI of proposed system
Figure (6): Result with Cordana leaf spot disease
V. CONCLUSION
The machine vision system that classifies the banana leaf diseases is done. From the experimental analysis we found that proposed system classify the diseases better when compared with other classification system. . The classification accuracy of the proposed method is 97% which is better compare with 86% of accuracy, produced by Back-propagation Neural Network (BPNN) method.This method can be applied to many other species of plants and their diseases. This can expand to other classification based problems not only to plants.
VI. REFERENCES
Camargoa, J.S. Smithb, year 2009, Image pattern classification for the identification of disease causing agents in plants, Computers and Electronics in Agriculture 66 (2009) 121–125.
Camargoa, J.S. Smithb, year 2009, an image-processing based algorithm to automatically identify plant disease visual symptoms, bio systems engineering 102 (2009) 9–21.
Ginto Cherian, Xiaomu Song, Guoliang Fan, Mahesh N. Rao, year 2004, Application of Support Vector Machines for Automatic Compliance Monitoring of the Conservation Reserve Program (CRP) Tracts,
0-7803-8742-2/04/$20.00 (C) 2004 IEEE.
[image:5.612.82.269.141.236.2] [image:5.612.57.295.473.630.2]urban image classification, Computers, Environment and Urban Systems 29 (2005) 501–523.
D.G. Sena Jr, F.A.C. Pinto, year 2003, D.M. Queiroz, P.A. Viana, Fall Armyworm Damaged Maize Plant Identification using Digital Images, sponsored by the World Bank and Embrapa through the project PRODETAB 030-01/99, Biosystems Engineering (2003) 85 (4), 449–454 , doi:10.1016/S1537-5110(03)00098-9.
Sudhir Gupta, Smitha Patil, Asha Kulkarni, Zoheb Hukkeri, year 2002, Classification of Soybean seeds by Color Image Analysis, Vol.45(6):1943-1948 2002 American society of agricultural engineers ISSN 0001-2351.
Yuan Y. Tang, Yu Tao, year2003, New method for feature extraction based on fractal behavior, Pattern Recognition 35 (2002) 1071–1081.
Santanu Phadikar, Jaya Sil, year 2008, Rice Disease
Identification using Pattern Recognition Techniques, Proceedings of 11th International Conference on Computer and Information Technology (ICCIT 2008)25-27 December, 2008, Khulna, Bangladesh. Marek R. Ogiela, Ryszard Tadeusiewicz, year 2003, Artificial intelligence structural images techniques in visual pattern analysis and medical data understanding,