Volume 4, No. 4, March-April 2013
International Journal of Advanced Research in Computer Science
RESEARCH PAPER
Available Online at www.ijarcs.info
ISSN No. 0976-5697
The use of data Mining Techniques for Improving Software Reliability
Nadhem Sultan Ali*, Dr. V.P. PawarComputational Science Department SRTM University Nanded, India [email protected]*, [email protected]
Abstract: The primary goal of software development is to deliver high-quality software efficiently and in the least amount of time whenever possible. To achieve the preceding goal, developers often want to reuse existing frameworks or libraries instead of developing similar code arti-facts from scratch. The challenging aspect for developers in reusing the existing frameworks or libraries is to understand the usage patterns and ordering rules among Application Programming Interfaces (APIs) exposed by those frameworks or libraries, because many of the existing frameworks or libraries are not well documented. Incorrect usage of APIs may lead to violated API specifications, leading to security and ro-bustness defects in the software. Furthermore, usage patterns and specifications might change with library refactorings, requiring changes in the software that reuse the library.
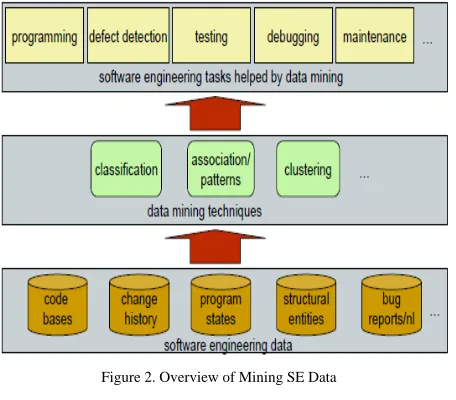
Data mining techniques are applied in building software fault prediction models for improving the software quality. Early identification of high-risk modules can assist in quality enhancement efforts to modules that are likely to have a high number of faults. This paper presents the data mining algorithms and techniques most commonly used to produce patterns and extract interesting information from software engineering data. The techniques are organized in seven sections: classification trees, association discovery, clustering, artificial neural networks, optimized set reduction, Bayesian belief networks, and visual data mining can be used to achieve high software reliability.
I. INTRODUCTION
[image:1.612.63.284.469.720.2]Data mining is a process that employs various analytic tools to extract patterns and information from large datasets. Today, large numbers of datasets are collected and stored. Human are much better at storing data than extracting know-ledge from it, especially the accurate and valuable informa-tion needed to create good software. Large datasets are hard to understand, and traditional techniques are infeasible for finding information from those raw data. Data mining helps scientists in hypothesis formation in biology, physics, che-mistry, medicine, and engineering. The data mining process is shown in Figure.1.
Figure 1. Data Mining Process [1]
There are seven steps in the process: data integration, da-ta cleaning, dada-ta selection, dada-ta transformation, dada-ta mining, pattern evaluation and knowledge presentation. Data mining techniques that can be applied in improving SE include ge-neralization, characterization, classification, clustering, as-sociative tree, decision tree or rule induction, frequent pat-tern mining, and etc. [2].
The purpose of this study is to explore how data mining techniques can be applied to improve Software Reliability. Objectives of this study are:
(a). To review the concept of Software Reliability and data mining
(b).To determine the problems in achieving the Soft-ware Reliability
(c). To identify data mining techniques that can be ap-plied to achieve high Software Reliability
A. Software Engineering:
Figure 2. Overview of Mining SE Data
II. LITERATURE SURVEY
Modeling Software Quality with Classification Trees
[3], this paper presents a study on the use of CART (a classi-fication tree algorithm) to identify fault prone software modules based on product and process metrics. The data is drawn from large telecommunication software systems at Nortel. A Neural Network Approach for Early Detection of Program Modules aving High Risk in the Maintenance Phase [4], this paper describes the use of neural networks to classify software modules into high or low risk. Software product attributes based on complexity metrics are used to train the network. The authors argue that prediction tech-nique such as regression and statistical analysis are too sen-sitive to random anomalies in the data or are too dependent on assumptions that are not always met. Estimation of
Soft-ware Reliability by Stratified Sampling [5], this paper
presents a methodology to estimate operational software reliability by stratified sample of beta testers’ code tion profiles. Cluster analysis is used to group code execu-tions into dissimilar profiles.
The authors show that more accurate estimates of failure frequencies can be drawn by stratified samples of those clustered execution profiles. A Critique of Software Defect Prediction [6], this paper presents the use of Bayesian Belief Networks (BBN) to build defect prediction models. These are the preliminary results of an interesting work. The paper has an wonderful discussion on the limitation of traditional defect prediction models. The authors argue that BBN mod-els are interpretable and can include contextual software process information in them. This allows domain experts to analyze how defect introduction and detection variables affect the defect density counts in the model. A Web Labora-tory for Software Data Analysis [7], this paper describes how the authors’ ideas on software visualization are being ported to a distributed system based on the World Wide Web. The system accesses data from central repositories enabling the users to visualize the most up to date data. The authors also argue that the system encourages collaborative research as observations and displays can be easily repli-cated and studied in detail by teams working geographically apart.
III. SOFTWARE RELIABILITY
(a). IEEE 610.12-1990 defines reliability as "The ability of a system or component to perform its required functions under stated conditions for a specified period of time."
(b).IEEE 982.1-1988 defines Software Reliability Management as "The process of optimizing the reliability of software through a program that emphasizes software error prevention, fault detection and removal, and the use of measurements to maximize reliability in light of project constraints such as resources, schedule and performance.“
(c). Using these definitions, software reliability is comprised of three activities: (a) Error prevention (b) Fault detection and removal (c) Measurements to maximize reliability.
A. Why Mining for Soft Reliability?:
a. Finding bugs is challenging
b. Require specifications/properties, which often don’t exist
c. Require substantial human efforts in analyzing data d. We can mine common patterns as likely
specifica-tions/properties
e. Detect violations of patterns as likely bugs
f. We can mine huge data for patterns or locations to narrow down the scope of human inspection g. E.g., code locations or predicates covered more in
failing runs less in passing runs may be suspicious bug locations
B. Software Reliability Methods:
a. Static Bug Detection: Without running the code, detect bugs in code
b. Dynamic Bug Detection (aka. Testing): Run the code with some test inputs and detect failures/bugs
c. Debugging:Given known test failures (symptoms), pinpoint the bug locations in the code
Reliable software must include extra, often redundant, code to perform the necessary checking for exceptional conditions, the life cycle depicted in Figure.3.
[image:2.612.330.558.511.697.2]This reduces program execution speed and increases the amount of store required by the program. Reliability should always take precedence over efficiency for the following reasons:
a) Computers are now cheap and fast:There is little need to maximize equipment usage. Paradoxically, however, faster equipment leads to increasing expecta-tions on the part of the user so efficiency considera-tions cannot be completely ignored.
b) Unreliable software is liable to be discarded by us-ers:If a company attains a reputation for unreliability because of single unreliable product, it is likely to af-fect future sales of all of that company’s products.
c) System failure costs may be enormous:For some ap-plications, such a reactor control system or an aircraft navigation system, the cost of system failure is orders of magnitude greater than the cost of the control sys-tem.
d) Unreliable systems are difficult to improve:It is usually possible to tune an inefficient system because most execution time is spent in small program sections. An unreliable system is more difficult to improve as unreliability tends to be distributed throughout the sys-tem.
e) Inefficiency is predictable:Programs take a long time to execute and users can adjust their work to take this into account. Unreliability, by contrast, usually sur-prises the user. Software that is unreliable can have hidden errors which can violate system and user data without warning and whose consequences are not im-mediately obvious. For example, a fault in a CAD pro-gram used to design aircraft might not be discovered until several plane crashers occur.
f) Unreliable systems may cause information loss:Information is very expensive to collect and maintains; it may sometimes be worth more than the computer system on which it is processed. A great deal of effort and money is spent duplicating valuable data to guard against data corruption caused by unreliable software.
The software process used to develop that product influ-ences the reliability of the software product. A repeatable process, which is oriented towards defect avoidance, is like-ly to develop a reliable system. However, there is not a sim-ple relationship between product and process reliability.
Users often complain that systems are unreliable. This may be due to poor software engineering. However, a com-mon cause of perceived unreliability is incomplete tions. The system performs as specified but the specifica-tions do not set out how the software should behave in ex-ceptional situations. As professionals, software engineers must do their best to produce reliable systems, which take meaningful and useful actions in such situations.
The Reliability of a software system is a measure of how well users think it provides the services that they require. Reliability is usually defined as the probability of failure-free operation for a specified time in a specified environ-ment for a specific purpose. Say it is claimed that software installed on an aircraft will be 99.99% reliable during an average flight of five hours. This means that a software fail-ure of some kind will probably occur in one flight out of 10000.
IV. DATA MINING TECHNIQUES
This section presents the data mining algorithms and techniques most commonly used to produce patterns and extract interesting information from software engineering data. The techniques are organized in seven sections: classi-fication trees, association discovery, clustering, artificial neural networks, optimized set reduction, Bayesian belief networks, and visual data mining.
A. Classification Trees:
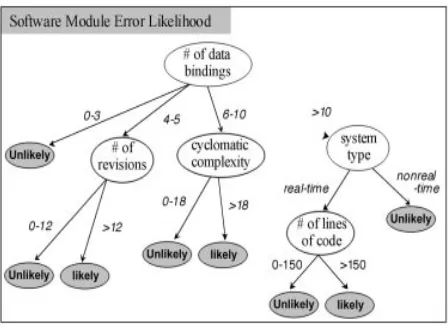
Classification or decision trees are induction techniques used to discover classification rules for a chosen attribute of a data set by systematically subdividing the information contained in this data set. They have been one of the tools of choice for building classification models in the software engineering field [8] [9][10][11][12][13]. Figure 4 shows an example of a classification tree extracted from [14]. In this fictitious example, the goal is to identify risky software modules based on attributes of the module and its system. Consider as an example the right most path from root to leaf in Figure 4’s tree, this path is saying that: IF a module has more than 10 data bindings AND it is part of a non real-time system THEN this module is unlikely to have errors.
The algorithms used to build classification trees seek to find those attributes and values that provide maximum se-gregation of data records in the data set at each level of the tree. In Figure 4, “# of data bindings” was selected first because this is the attribute that most equally divides records for “error likelihood” in the data set. In terms of information theory, this is the attribute that provides most information by reducing the most uncertainty about the “error likelihood” value. The reasoning is that the more information a tree has at each node the smaller this tree will be. Below, we have ID3, a classification tree induction algorithm proposed by Quinlan in the eighties [15].
a. Select an attribute as the root of the tree, make branches for all values this attribute can have;
b. Use generated tree to classify the training set. If all examples at a particular leaf node have the same value for the attribute being classified (e.g., error likely mod-ule); this leaf node is labeled with this value. If all leaves are labeled with a value, the algorithm termi-nates.
[image:3.612.324.548.560.724.2]c. Otherwise, label the node with an attribute that does not occur on the path to the root, branch for all possible values, and return to step 2.
B. Association Discovery Techniques:
Association discovery extracts information from coinci-dences in the data set. Knowledge discovery takes place when these coincidences are previously unknown, non-trivial, and interpretable by a domain expert. For Example Market Basket Analysis, techniques allow one to discover correlations or co-occurrences of transactional events. Mar-ket basMar-ket analysis uses cross-correlation matrices in which the probability of an event occurring in conjunction with every other event is computed.
C. Clustering Techniques:
Clustering techniques are among the oldest data mining techniques. Unfortunately, we are aware of just a few works in which they are used to analyze software engineering data [16][17]. The concept of clustering is very simple; consider the following example. Suppose that one is moving and wants to pack all his belongings. One wants to group ma-terial with similar characteristics together so he knows how to handle them during transportation. Fragile objects should be packaged together because they require careful handling. Cooking utensils should be packaged together because they will go to the kitchen. In this example, objects were clus-tered together because they have attributes in common about the way they behave. The same is true for data or informa-tion clustering. One wants to group data records with similar attributes together so information can be abstracted.
Data clustering can be used to: (1) produce a high-level view of what is going on in the data; (2) automatically iden-tify data outliers; or (3) classify or predict the value of new records using a technique called nearest neighbor classifica-tion.
D. Artificial Neural Networks:
[image:4.612.323.553.220.376.2]Neural networks have been one of the tools of choice for building predictive software engineering models [18][19][20][21][22]. They are heavily interconnected net-works of simple computational elements [23][24]. An ex-ample of such an element, often called a neuron, is shown in Figure 5. The neuron has N inputs x1, x2, … , xN and one output y, all having continuous values in a particular do-main, usually [0,1]. Each neuron input also has a weight (w1, w2, … , wN) that determines how much each input contributes to the neuron output y.
Figure 5. A Neuron and a Sigmoid Function
The neuron computes its output by calculating the weighted sum of its inputs and passing it through a non-linear filtering function f(x). Figure 5 shows a sigmoid, a function commonly used for this purpose. The output is calculated as: Neural networks are built by connecting the output of a neuron to the input of one or more neurons. Input
connections are then assigned to a layer of nodes, called input nodes, and outputs are assigned to another layer of nodes, called output nodes. Figure 6 shows a neural network adapted from [19]. In this example, the network architecture aims to build a software effort estimation model. It uses inputs derived from COCOMO’s cost drivers and other important software attributes. The COCOMO cost drivers are discussed in depth in [25] and [26]. The attributes shown as inputs here are: adjusted delivered source instructions (AKDSI); total delivered source instructions (TKDSI); ex-ecution time constraints (TIME-const); storage time con-straints (STOR-const); and, computer language (Cobol, L-Fortran, and L-PL1). The output is an effort estimate based on the input values and the weights of the network connec-tions.
Figure 6. A Neural Network for Software Development Effort Estimation Reiterate
The main steps in building a neural network for classifi-cation or prediction, such as the one in Figure 6 , are: (1) identify the network inputs and outputs; (2) process the in-put and outin-put values so that they fall into a numeric range, usually between 0 and 1; (3) choose an appropriate topology for the network by defining the number of hidden layers; (4) train the network on a representative set of examples; (5) test the network on a test set independent of the training set and retrain the network if necessary; (6) apply the generated model to predict outcomes in real situations. The main chal-lenge in building a neural network model is to train the net-work (step 4). This is achieved by setting the netnet-work con-nection weights so that the network produces the appropriate output patterns (effort estimation, in our case) for corres-ponding input patterns (software attributes and cost drivers values, in our case). The idea is to use a set of examples, called a training set, to adjust the network weights to the right predictive values.
E. Optimized Set Reduction:
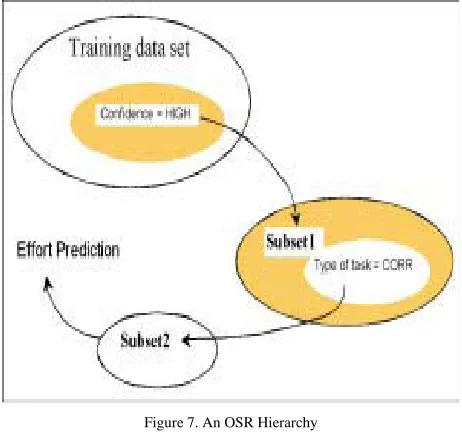
[image:4.612.60.289.531.661.2]value of the dependent variable on the terminal subsets. A simplified example of an OSR process is seen in Figure 7. The example, adapted from [29], shows part of a model for maintenance effort prediction. Subset1 is a subset of the training set for which the maintainers confidence on the task to be performed is HIGH. Similarly, Subset2 is extracted from Subset1 by limiting the type of maintenance task to corrective (CORR) activities. In the figure, Subset2 meets the termination criterion and the effort prediction is done based on the record contained in this subset. Like classifica-tion trees, OSR produces models that can be interpreted by a domain expert. However, unlike classification trees, OSR does not select a unique attribute at each decomposition level. In the above example, the technique does not have to use the attribute confidence to derive others subsets from the training set. This helps the technique to work well in small data sets.
Figure 7. An OSR Hierarchy
F. Bayesian Belief Networks:
Bayesian Belief Networks (BBN) are graphical networks that represent probabilistic relationship between variables [30][31]. Recently, BBNs have attracted attention from the software engineering community [32][33]. BBNs can be used by domain experts to articulate their beliefs about the dependencies between different process and product attributes. With them one can propagate consistently the impact of known attribute values on to probabilities of un-certain outcomes. Figure 8 shows a BBN from an example kindly provided by Norman Fenton [34]. In the example a BBN is built to predict software reliability. The nodes represent continuous and discrete software attributes. The arcs represent influential relationships between the attributes. For example, reliability is defined by the number of latent faults and frequency of operational usage. Similar-ly, the coder’s performance is defined by their experience, the problem complexity, and the use of IEC 1508 (a safety integrity standard). Each node is associated with a probabili-ty table (PT) that maps the inputs value distribution into an output value distribution. The probabilities table may be derived based on subjective expert opinion or based on ob-jective measured data. This flexibility is one of the main strengths of this technique. Once the PTs are defined the
BBN model is ready to be used. The BBN will produce a probability distribution for its output attributes once its input attributes are measured.
Figure 8. A BNN for Software Reliability Prediction
Current BBN tools support the construction of large networks and complex node probability tables for both dis-crete and continuous attributes. BBNs produce interpretable models that allow experts to understand complex chain of events through visual graphical displays. They also model uncertainty explicitly in their estimates. For these reasons, BBN is a promising technique for supporting decision mak-ing and forecastmak-ing in the software engineermak-ing field.
G. Visualization and Visual Data Mining:
Data visualization can be thought of as the science of mapping volumes of multidimensional data into two dimen-sional computer screens. Visualization is an important tech-nique for data mining because humans excel at processing visual information. Humans can extract important features of complex visual scenes in a matter of milliseconds. Good visualization techniques play with this human strength by displaying complex information in a form that can be quick-ly processed by the human brain. Bell Labs work on source code visualization is an excellent example of how visualiza-tion can be used in software engineering [35][36].
a. Visualization of Multivariate Data:
[image:5.612.59.290.240.459.2]Table 1. Data Records Describing Software Modules on Several Attributes
Modules A B C D E F G H I J K L M N O
Fan-out 7 8 4 6 5 7 7 2 2 5 5 6 6 4 6
Fan-in 4 5 2 3 3 1 1 4 3 3 2 7 6 3 7
Coupling 14 22 7 8 4 4 3 5 5 6 12 11 10 7 13
Number of Modifications
29 25 5 21 19 2 8 3 12 14 35 30 9 15 27
Cyclomatic Number
122 132 21 85 87 23 19 24 34 84 134 110 124 89 129
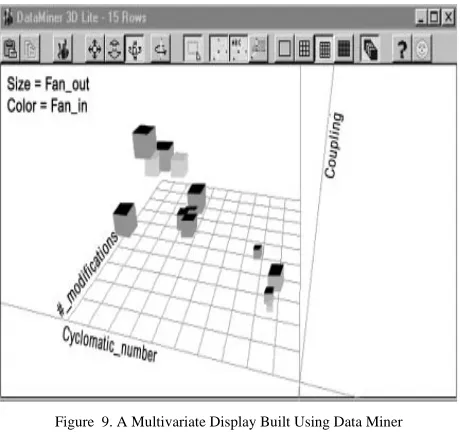
[image:6.612.265.550.62.394.2] [image:6.612.60.290.272.490.2]In order to display those five dimensions at the same time in a visual display, the visualization application has to map each software module attribute to a visual attribute. Figure 9 shows a screen shot of a display built using a data mining tool called Data Miner. A description of Data Miner can be found in Appendix B. The picture displays the data records of Table 1 mapping the software module attributes to the following visual attributes: fan-out is shown as size, fan-in is shown as color, coupling is shown as X-position, number of modification is shown as Y-position, and cyclo-matic number is shown Z-position.
Figure 9. A Multivariate Display Built Using Data Miner
b. Visual Data Mining:
Many modern data visualization tools combine powerful visual displays with easy to operate data selection and dis-play controls. These functionalities allow domain experts to interactively explore data so efficiently that they are able to find interesting data patterns without using automated data mining algorithms. This type of data mining is sometimes called visual data mining. A good visual data mining tool has the following functionalities:
a. _ Ability to interactively navigate on the visual canvas allowing zooms, rotations, and scans over the dis-played data.
b. _ Ability to interactively control display formats and the visual attributes of the displayed data.
c. _ Ability to interactively control the granularity in which the data is visualized, allowing the domain ex-pert to look at it from a high level perspective or to drill down to particular data sets. This enables domain experts to analyze the big picture or to focus on details and singularities of the displayed information.
Figure 10. Shows a screen shot from a visual data mining tool called Spot-fire.
V. CONCLUSION
In this paper we have discussed data mining, software engineering and software reliability. We also discussed how the different Data mining techniques can be used to explore the software engineering data which can be used to achieve higher Software Reliability.
VI. REFERENCES
[1]. Y. Chen, X. H. Shen, P. Du, and B. Ge, “Research on soft-ware defect prediction based on data mining,” 2nd Interna-tional Conference on Computer and Automation Engineer-ing (ICCAE) 2010, Vol. 1, pp. 563-567, Apr. 2010.
[2]. R. W. DePree, “Pattern recognition in software engineer-ing,” IEEE Computer 1983, pp. 48-53, 1983.
[3]. Taghi M. Khoshgoftaar and Edward B. Allen. Modeling Software Quality with Classification Trees. In Recent Ad-vances in Reliability and Quality Engineering, Hoang Pham Editor. World Scientific, Singapore, 1999.
[4]. Taghi M. Khoshgoftaar and D. L. Lanning. A Neural Net-work Approach for Early Detection of Program Modules Having High Risk in the Maintenance Phase. J. Systems Software, 29(1), pp. 85-91, 1995.
Stratified Sampling. ACM Trans. on Soft. Eng. and Me-thodology, (8)3, pp. 263-283, July 1999.
[6]. Norman Fenton and Martin Neil. A Critique of Software Defect Prediction Models. To appear in the IEEE Trans. on Soft. Eng., 1999.Stephen G. Eick, Audris Mockus, Tood L. Graves, Alan F. Karr. A Web Laboratory for Software Data Analysis. World Wide Web, 12, pp. 55-60, 1998.
[7]. Stephen G. Eick, Audris Mockus, Tood L. Graves, Alan F. Karr. A Web Laboratory for Software DataAnalysis. World Wide Web, 12, pp. 55-60, 1998.
[8]. A. A. Porter and R. W. Selby. Empirically Guided Soft-ware Development Using Metric-Based Classification Trees. IEEE Software, 7(2), pp. 46-54, March 1990.
[9]. A. A. Porter and R. W. Selby. Evaluating Techniques for Generating Metric-based Classification Trees. J. Systems Software, pp. 209-218, December 1990.
[10]. R. W. Selby and A. A. Porter. Learning from Examples: Generation and Evaluation of Decision Trees for Software Resource Analysis. IEEE Trans. on Soft. Eng., 14(12), pp. 1743-1757,December 1988.
[11]. K. Srinivasan and D. Fisher. Machine Learning Approach-es to Estimating Software Development Effort. IEEE Trans. On Soft. Eng., 21(2), pp. 126-137, February 1995.
[12]. J. Tian. Integrating Time Domain and Input Domain Ana-lyses of Software Reliability Using Tree-Based Models. IEEE Trans. on Soft. Eng., 21(12), pp. 945-958, December 1995.
[13]. J. Tian and J. Palma. Analyzing and Improving Reliability: A Tree-based Approach. IEEE Software, pp. 97-104, 15(2), March-April 1998.
[14]. R. P. Lippmann. An Introduction to Computing with Neur-al Nets. IEEE AcousticNeur-al, Speech, and SignNeur-al Processing Magazine, 4, pp. 4-22, 1987. Reprinted in Neural Net-works: Theoretical Foundations and Analysis, Edited by Clifford Lau, IEEE Press, 1992. Also reprinted in Optical Neural Networks, Edited by S. Jutamulia, SPIE Optical Engineering Press, 1994.
[15]. J. R. Quinlan. Induction of Decision Trees. Machine Learn-ing, 1(1), pages 81-106, 1986.
[16]. Y. Kodratoff and R. S. Michalski, editors. Machine Learn-ing, an Artificial Intelligence Approach, Volume 3. Mor-gan Kaufmann, San Mateo, California, 1990.
[17]. A. Podgurski, W. Masri, Y. McCleese, and F. G. Wolff. Estimation of Software Reliability by Stratified Sampling. ACM Trans. on Soft. Eng. and Methodology, (8)3, pp. 263-283, July 1999.
[18]. M. Jørgensen. Experience With the Accuracy of Software Maintenance Task Effort Prediction Models. IEEE TSE, 21(8), pp. 674-681, August 1995.
[19]. T. M. Khoshgoftaar, E. B. Allen, J. P. Hudepohl, and S. J. Aud. Neural Networks for Software Quality Modeling of a Very Large Telecommunications System. IEEE Trans. On Neural Networks, (8)4, pp. 902-909, July, 1997.
[20]. F. Lanubile and G. Visaggio, Evaluating predictive quality models derived from software measures lessons learned”, The Journal of Systems and Software, 38:225-234, 1997.
[21]. K. Srinivasan and D. Fisher. Machine Learning Approach-es to Estimating Software Development Effort. IEEE Trans. On Soft. Eng., 21(2), pp. 126-137, February 1995.
[22]. J. P. Bingus. Data Mining With Neural Networks: Solving Business Problems – From Application Development to Decision Support. McGraw-Hill, New York, 1996.
[23]. K. Swingler. Applying Neural Networks: A Practical Guide. Academic Press, London, 1996.
[24]. B. W. Boehm. Software Engineering Economics. Prentice-Hall, Englewood Cliffs, NJ, 1981.
[25]. B. W. Boehm. Software Engineering Economics. IEEE Trans. On Soft. Eng., 10(1), pp. 4-21, January 1994.
[26]. L. C. Briand, V. R. Basili, and C. J. Hetmanski. Develop-ing Interpretable Models with Optimized Set Reduction for Identifying High-Risk Software Components. IEEE Trans. on Soft. Eng., 19(11), pp. 1028-1044, November 1993.
[27]. L. C. Briand, V. R. Basili, and W. Thomas. A Pattern Recognition Approach for Software Engineering Data Analysis. IEEE Trans. on Soft. Eng., 18(11), pp. 931-942, November 1992.
[28]. M. Jørgensen. Experience With the Accuracy of Software Maintenance Task Effort Prediction Models. IEEE TSE, 21(8), pp. 674-681, August 1995.
[29]. W. L. Buntine. Operations for Learning with Graphical Models. Journal of Artificial Intelligence Research, 2, pp. 159-225, 1994.
[30]. G. F. Cooper and E. Herskovitz. A Bayesian Method for the Induction of Probabilistic Networks from Data. Ma-chine Learning, 9, pp. 309-347, 1992.
[31]. M. Neil and N. E. Fenton. Predicting software quality using Bayesian belief networks. Proc 21st Annual Software Eng Workshop, NASA Goddard Space Flight Centre, pp. 217-230, Dec, 1996.
[32]. M. Neil, B. Littlewood, and N. E. Fenton. Applying Baye-sian belief networks to systems dependability assessment, in Proceedings of 4th Safety Critical Systems Symposium, Springer Verlag, pp. 71-93, 1996.
[33]. N. E. Fenton. Bayesian Belief Networks – An Overview
Web Article. In WWW: http://www.agena.co.uk/bbn_article/bbns.html. Agena Ltd,
1999.
[34]. T. A. Ball and S. G. Eick. Software Visualization in the Large. IEEE Computer, (29)4, pp. 33-43, April 1996.
[35]. S. G. Eick, A. Mockus, T. L. Graves, A. F. Karr. A Web Laboratory for Software Data Analysis. World Wide Web, 12, pp. 55-60, 1998.
![Figure 1. Data Mining Process [1]](https://thumb-us.123doks.com/thumbv2/123dok_us/699823.1077803/1.612.63.284.469.720/figure-data-mining-process.webp)