DOI: http://dx.doi.org/10.26483/ijarcs.v9i2.5546
Volume 9, No. 2, March-April 2018
International Journal of Advanced Research in Computer Science RESEARCH PAPER
Available Online at www.ijarcs.info
ISSN No. 0976-5697
PERFORMANCE ANALYSIS ON DECISION TREE AND SVM CLASSIFICATION
WITH REFERENCE TO FLOOD OCCURRENCES IN INDIA
Dr. K. Mohankumar
Head & Research AdvisorPG & Research Department of Computer Science Rajah Serfoji Govt. College, Thanjavur, India
K. Sangeetha
Research ScholarPG & Research Department of Computer Science Rajah Serfoji Govt. College, Thanjavur, India
Abstract: Floods are pervasive catastrophic disasters which cause financial damages, lost life and environmental scarcity. Flood damage estimation is one of the important factors to the way in the depth of the flood and predicts the future damages. Data mining classification techniques to discover patterns and sequences will use to predict the zones that depiction to flood. A data of flood damages for twelve years collected from various sources. The classification models of Decision Trees and Support Vector Machine with different kernel functions are taken for the prediction models. The Matlab analytics compare the prediction models indicates the performance of the algorithm has much better accuracy. Experiments confirm that the Support Vector Machine with Quadratic kernel function is more accurate in finding the prediction pattern. The accuracy and visualization also suggest that flood prediction which the outcome will goal to better manage floods all the way through preclusion, fortification and catastrophe.
Keywords: SVM Kernel, Cross Validation, Prediction
I. INTRODUCTION
Natural disasters influence human and animal lives and their properties. A Flood is an innate threat that classifiable caused by heavy rainfall from a number of cyclones, hurricane or tropical storm. The sudden and fast movement of water generates a flood. Frequent floods of various magnitudes aggressive the overall development of the country. Data Mining is a knowledge discovery which extracting huge data into useful information by analyzing data from a diverse point of view and abbreviations it. The data mining knowledge discovery is very helping to solve problems in market analysis and risk management, fraud detection and disaster management. The data mining is broadly used in researchers use approaches such as machine learning, data visualization, soft computing, and data statistics. It is functional in many areas and established effective approach of problem solving, which has provided ways for both descriptive and predictive manner.
The data mining decision making concepts are very useful for the scientists to predict the natural disasters. The various types of sources had undergone the data mining procedures, to give new knowledge. The prediction model can give efficient strategies for justifying damage [1]. Floods are one of the vulnerable risks in India. Out of the total geographical area of 329 million hectares, about 45.64 million hectares are flood prone [2]. Flood causes more reparation in terms of loss of life, property and economic activity than any other natural disasters in the country. The present study analyzes the flood losses such as human lives lost, cattle death, villages affected, populations affected in India for past twelve years.
The purpose of this paper is twofold. First, all the damage data are undergoing the cross K-Fold Validation for fixing the testing and training data using the Mat lab. Secondly, various classification algorithms such as Decision Tree and Support Vector Machine with various kernel types
are performed to find out the accuracy of the flood prediction pattern. Statistics and Machine Learning Toolbox functionalities can resourcefully train a mixture of
algorithms, merge models into assessing model
performances, cross validation, and predict responses for new data. In experiments on the flood damage data, we shift towards generous an improved prediction of future floods.
II. RELATED WORKS
Because of immense data available in hydrological field, the data mining tools plays an important role to define and determine the behavioral changes of various components in hydrology. The flood patterns are discovered using the hydrology data such as water level in the river and rainfall measurements with the technique of sliding window [3]. Neural Networks are gradually more used in hydrological research, set their ability to capture the nonlinearity involved in the rainfall –round off relationship [4]. The nonlinear cases and Nonlinear AutoRegressive with Exogenous Input (NARX) model is the one class of the Neural Network model based on the Artificial Neural Network techniques [5].
The combined framework of neural networks and fuzzy logic called Neurofuzzy system used in the generation of if-then rules in learning algorithm. By using Adaptive Neuro-Fuzzy Inference System (ANFIS) gives the best accuracy for identifying forecast the daily discharge of Karuvannur river basin [6]. The satellite images, aerial photos and, GIS technology are vastly used to provide the real-time flood disaster information such as intensity of flood, the affected population etc., [7].
suggesting which parameters should be considered in the flood damage estimation without quantifying their effect on the damage has been developed in the UK [9]. The large data set can be divided into more subdivided data by using a Tree-based model. This model explains the relationship between the predictor variables and the response variable [10].
The SVM approach with different kernel functions is used in the prediction of monthly rainfall in China. [11]. The everyday precipitation prediction analyzed the significance of humidity and comparable Potential Temperature predictors by SVM approach. The performance comparison with K-nearest neighbor (KNN) and multilayer perceptron (MLP), the SVM gives the best result [12].
III. METHODOLOGIES
Data collection, Data cleaning, Data transformation, and Data integration are the essential steps in data preprocessing. Using the data preprocessing steps and data mining algorithms to build a classified predicted model to support flood prediction.
A. Data Collection
Some government bodies were known as major resources for a flood management in India.
1) Flood Management Improvement Support Center
(FMISC) -Andhra Pradesh.
2) National Climate Centre India Meteorological
Department, Pune, India.
3) National Institute of Disaster Management (NIDM) 4) National Disaster Risk Reduction Portal-Maharashtra
B. Supervised Learning
In machine learning, the supervised learning is one of the tasks of supervised training data. The training examples, which consisting of the training data. The predicted new model produces only after study the training data consisting of a known set of input and desired output value. Regression and Classification are the two tasks of the Supervised learning algorithm. A Classification problem, where each and every data can be separated into exact classes. In regression, the output variable is the real value.
C. Classification Algorithm – Decision Tree
Decision Trees or Classification trees are predicting responses to given data. The tree was created using the predictors one as a root and others are the leaf node, depending upon the condition. Classification trees furnish responses that are 'true' or 'false'. Every step in a prediction involves examining the value of one predictor.
i. At the beginning, the whole training set is considered as the root.
ii. Feature values are preferred to be categorical. If the values are continuous then they are discredited prior to building the model.
iii. Records are distributed recursively on the basis of attribute values.
iv. Order to placing attributes as root or an internal node of the tree is done by using some statistical approach.
X1 and X2 are the two predictors used in the tree-based prediction. The prediction started at the top node.The decisions are made based on the rule. The left branch and right branch of the tree have classified separately defined in the rule .
D. Support Vector Machine
Support Vector Machine, which is one of the data mining technique used for the classification of data. The classification algorithms are very helpful to predict the weather pattern. SVM is one of the highly developed classification technique [13].
The SVM has been widely used in classification and prediction. In the Classification, the classification accuracy depends on the limited number of training samples in the training data. But the prediction accuracy will achieve only the proper selection of the kernel function [14].
Given linear separable sample data set D as (x1, y1), (x2, y2)……. (xn,yn) where xi is the set of training
tuples with associated class lables yi. Each yi denotes the two
values +1 or -1, that is yi∈±1, which is denoted as a heavy flood or moderate flood. The hyperplane with the largest margin to be more accurate in classifying data than the hyperplane with the smallest margin results in MMH (Maximum Marginal Hyperplane) [15]. So
𝑊𝑊.𝑋𝑋+𝑏𝑏= 0 (1)
is a linear separating hyperplane , Where W is the weight vector as 𝑊𝑊= {w1, w2… wn}; n is the number of attributes and b is a scalar.Since the training tuples are 2-D, we have X=(x1,x2) .If b as an additional weight, w0, Equation (1) can
be written as
w0+w1x1+w2x2 = 0 (2)
Thus any point above the separating hyperplane satisfies, w0+w1x1+w2x2 > 0 (3) Similarly, any point below the separating hyperplane satisfies,
w0+w1x1+w2x2 < 0 (4)
The weights can be adjusted so that the hyperplanes defining the sides of the margin as,
H1:w0+w1x1+w2x2 ≥ 1 for yi= +1 (5)
H2:w0+w1x1+w2x2 ≤ - 1 for yi=−1 (6)
Combining the two inequalities of Equation (5) and (6) we get,
yi (w0+w1x1+w2x2) ≥ 1, ∀i. (7)
Any training tuples that fall on hyperplane H1 or H2 satisfy the Equation (7) are called Support Vectors.
The Quadratic optimization problem of the linear SVM, the training tuples only in the form of dot products, ∅(Xi).∅(Xj), Where ∅(𝑋𝑋) is simply the nonlinear mapping function applied to transform the training tuples.The computational dot product turns out to instead apply kernel function,𝐾𝐾(Xi,Xj ), to the original input data.
That is,
𝐾𝐾(Xi,Xj )=∅(Xi).∅(Xj) (8)
In otherwords,everywhere that∅(Xi). ∅(Xj) appears in the training algorithm,we have to replace it with 𝐾𝐾 (Xi, Xj). Now the kernel functions are,
Polynomial kernel of degree h: 𝐾𝐾 (Xi, Xj )(Xi. Xj + 1)h (9)
Gaussian radial basis function
kernel: 𝐾𝐾 (Xi, Xj) =e−||Xi, -X||2/2∝2 (10)
Sigmoid kernel :𝐾𝐾(Xi,Xj )=tanh(kXi . Xj − 𝛿𝛿) (11)
The SVM with a Gaussian radial basis function gives the same decision hyperplane as a type of neural network known as Radial Basis Function network.An SVM with a sigmoid kernel is equivalent to a simple two-layer neural network. SVM can also be designed for linear and non-linear regression.
Based on the above study, the aim of the SVM is to develop the training and testing of linear and nonlinear training samples of the unique space are mapped to a high
dimensional attribute. So the best kernel selection for a given data set realizes the original space of the algorithm.
[image:3.595.322.552.106.315.2]E. Data Flow Model
Figure 1. Prediction Model.
IV. EXPERIMENTS
The foundation of the data mining processes is the data collection and preprocessing. The exact result will be formed only by suitable data. This study, we use the past 12 years flood damage data of Indian most flood affected states collected from the various resources. The dataset contains a Total Crop area affected (lakh hectare), Total villages affected, the number of Human lives lost, Cattle lost and the Population affected.
Table I. Flood damages for India during the period 2006-2017
Sr. No.
States Total Crop Area
affected (Lakh. Hec)
Villages affected Death Cattle lost Houses affected Population
affected (LA)
1 Assam 53.945 22462 520 570 136476 190.18
2 Bihar 45.26 30390 2082 3369 1145355 16800
3 Andrapradesh 53.78 5464 1052 500985 1667095 191.49
4 Gujarat 2 523 1149 141000 120709 46.67
5 Orissa 44.54 26115 343 7111486 1041674 164.35
6 Maharashtra 25.2 3419 363 2987 9876 6506.2
7 Kerala 4.5 200 55 308 7270 21.8
8 Tamil Nadu 10.46 2426 680 103341 424400 25.74
Matlab statistical and machine learning tool used in the classification to automatically train a selection of models and helps to choose the best model. In a classification model, to evaluate the statistical performance every dataset should have an attribute with label role and an attribute with prediction role. The label attribute stores the actual values and the prediction attribute stores the values of label predicted by the classification model.
The various performances of the cross-validation and algorithm validation gives the assessment of the algorithm. The training data and testing data were taken from the original dataset for each experiment and those data are randomly classified. For each experiment, datasets are divided into two subsets, one is training subset and the other one is test subset. Since the correct labels for the test subset are unknown, we have to split the training subset into two, viz., training set and test set. We have to use any of the two prominent training methods commonly used. One is leave-one-out method and the other one is k-fold cross validation method. Unlike the original test subset, this test set have labels. After these labels are
predicted, we have to compare the same with the original test labels. These methods will help to predict the class attributes. The aim is to check accuracies, precisions by training and testing it on it. It will help to make a robust model and prevent it from overfitting.
A. Cross Validation
[image:3.595.30.567.442.552.2]In this experiment, we have taken as 5 fold cross validation. This validation method gives a superior estimation of the predictive accuracy of the final model trained with all the data. It requires several fits, but makes capable use of all the data.
B. Algorithm Validation
1. Tree- based: To verify the predicted pattern from the classification models are compared. To first examine the all Tree-based classification methods. In the resultant, the maximum number of splits is 100. The Gini diversity index is used for the split criterion. Here using six predictors and one class label for the validation.
2. Support Vector Machine: The model trained by the Support Vector Machine classification with different kernel functions. Each trained model gives the accuracy, prediction speed and training time of the models. Each model type has the kernel scale, box constraint level, multi class method and standardized data position.
V. RESULTSANDDISCUSSIONS
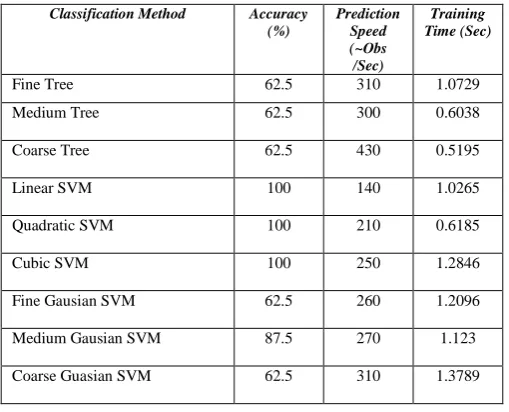
[image:4.595.309.539.183.377.2]The results of the Tree based classification and Support Vector Machine classification with various kernel functions give the various accuracy of the prediction model. Table II shows values of the accuracy, Prediction speed and training time of the models.
Table II. Accuracy, Prediction speed and training time of the models
Classification Method Accuracy
(%)
Prediction Speed (~Obs /Sec)
Training Time (Sec)
Fine Tree 62.5 310 1.0729
Medium Tree 62.5 300 0.6038
Coarse Tree 62.5 430 0.5195
Linear SVM 100 140 1.0265
Quadratic SVM 100 210 0.6185
Cubic SVM 100 250 1.2846
Fine Gausian SVM 62.5 260 1.2096
Medium Gausian SVM 87.5 270 1.123
Coarse Guasian SVM 62.5 310 1.3789
The Fine tree, Medium tree and the coarse tree give the same prediction accuracy 62.5% with different prediction speed and a different training time. The prediction speed of fine tree is ~310obs/Sec with the training time of 1.0729 Sec. The Medium tree and Coarse tree also give the same prediction accuracy of 62.5% with a different prediction speed of ~300obs/Sec, ~430obs/Sec with the training time of 0.6038Sec, 0.5195 Sec with the split of 20,4. Then the accuracy of the SVM linear, Quadratic and Cubic are 100% with different prediction speed and training time. The accuracy of the medium Gaussian SVM is 87.5% with the predicted speed of ~270obs/Sec. Fine and Coarse Gaussian give the accuracy of 62.5%. Comparing with all models, the Quadratic SVM has given 100% accuracy with less training time of 0.6185. So, the
Quadratic SVM plays the vital role to predict the heavy flooded and moderate flooded area.
A. Confusion Matrix
[image:4.595.30.285.423.629.2]Confusion Matrix is a method for abbreviation the presentation of a classification algorithm. The confusion matrix plot is used to understand how the currently selected classifier performed in each class. After training a model the observation of the confusion matrix model gives the correct and poor performance of the classifier.
Figure 2. Result of confusion matrix of classification Tree.
The above Figure 2 shows the confusion matrix of the classification tree. The True Positive Predicted value (green cell) and False negative predicted value (pink cell) gives the classification rates of the heavy flood and moderate flood. True positive rate of the heavy flood is 63% and false negative rate of the moderate flood is 38%.
Figure 3. Result of confusion matrix of Quadratic SVM.
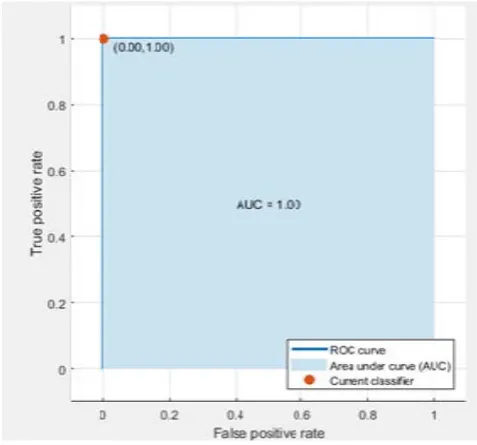
[image:4.595.309.543.471.671.2]B. ROC Curve
[image:5.595.310.557.82.301.2]ROC curve is a Receiver Operating Characteristic curve. True and False Positive rates of the classification models are found in the curve.The performance of the classifier represented in the red color point with true positive rate (TPR) versus false positive rate(FPR) values.The True Positive Rate and the False Positive Rate range from 0 to 1.The overall quality of the classifier is measured by the Area Under Curve(AUC).The value of the AUC is in between 0.8 and 1.0 the classifier is recognized as a good.If the value is around 0.5 the classifier is poor [16].
Figure 4. Result of ROC curve of classification Tree.
[image:5.595.37.271.194.390.2]The ROC curve for tree classification shown in Figure.4. Here there is no right angle to the top left of the plot and the Area Under Curve value is only 0.30. This shows the poor prediction of tree classification.
Figure 5. Result of ROC curve of Quadratic SVM
Figure 5, shows the ROC for the Quadratic SVM. This plot shows a perfect result in no misclassified points is a right angle to the top left of the plot. The Area Under Curve value is 1.0. This indicates the better classifier performance of Quadratic
[image:5.595.43.282.463.685.2]SVM in the prediction of future floods based on the flood damage predictors.
Figure 6. Parallel Coordinate plots of Quadratic SVM
Figure 6 shows the Parallel Coordinate plots of Quadratic SVM. The performance of the tree classification and SVM with different kernel method classifications are compared in all angles. In all ways, the Quadratic SVM gives the correct prediction model for the prediction of a heavy and moderate flood.
VI. CONCLUSION
In this paper, we train the flood damage assessment data with various classification algorithms. The decision tree with different models and the SVM with different kernel function give the various prediction accuracy and speed. The knowledge of the predicted pattern of the tree classification and SVM with different kernel methods, the Quadratic SVM performs well for predicting the heavy flood and moderate flood from the flood-affected zones. The accuracy and visualization suggest that flood prediction will help the people to protect themselves from injury and death. Predictions and warnings can also reduce damage and economic losses.
VII. REFERENCES
[1] Azwa Abdul aziz,Nur ashikin Harun,Mokhairi Makhtar, "A Conceptual Framework for Predicting Flood Area in
Terengganu during Monsoon Season using Association Rules" Journal of theoretical and applied information technology,Vol.87,No.3,pp512-518,2016.
[2] Report of the CAG of India, Ministry of Water Resources, River Development, Report No 10 of 2017.
[3] Ku Ruhana Ku,Mahamud, Norhayani Zakaria, Norliza Katuk, and Mohamad Shbier, "Flood Pattern Detection Using Sliding Window Technique," Third Asia International Conference on Modelling & Simulation, 2009, pp. 45-50.
[4] Giorgio Corani and Giorgio Guariso, "Coupling Fuzzy Modelling and Neural Networks for River Flood Prediction," IEEE Transaction on Systems, Man, and Cybernetics Part C: Applications and Reviews, Vol. 35, No 3, August 2005. [5] Fazlina A.R, Abd Manan S., Zainazlan M.Z. and Ramli
[6] Anusree,K, K.O.Varghese, "Stream flow prediction of Karuvannur Rivber Basin Using ANFIS,ANN,and MNLR models,"ICETEST -2015,Elsevier,Procedia Technology 24(2016),pp.101-108.
[7] Yan Li and Manchun Li, "Application and Research on Flood Risk Assessment Decision Support System in the Lower Yellow River, "2011.
[8] Merz, B., Kreibich, H., Schwarze, R., and Thieken, " A.: Review article Assessment of economic Flood damage", Nat. Hazards Earth Syst. Sci., 10, 1697–1724, doi:10.5194/nhess-10-16972010, 2010.
[9] Nicholas, J., Holt, G. D., and Proverbs, D. "Towards standardizing the assessment of Flood damaged properties in the UK "Struct. Survey, 19, Issue:4;pp.163–172, 2001. [10] Merz, B., Kreibich, H.,U.Lall, "Multivariate Flood damage
assessment: a tree-based data-mining approach", Nat. Hazards Earth Syst. Sci., 13, 53-64, doi:10.5194/nhess-13-53-2013. [11] Lu, K.; Wang, L. "A novel nonlinear combination model
based on support vector machine for rainfall prediction. " In Proceedings of the IEEE 4th International Joint Conference on Computational Sciences and Optimization (CSO 2011),
Kunming and Lijiang City, China, 15–19 April 2011; pp. 1343–1347.
[12] Ortiz-Garcia, E.G.; Salcedo-Sanz, S.; Casanova-Mateom, C. "Accurate precipitation prediction with support vector classifiers: A study including novel predictive variables and observational data." Atmos. Res. 2014, 139, 128–136, doi:10.1016/j.atmosres.2014.01.012.
[13] Li, W.; Huang, Z.; Lang, R.; Qin, H.; Zhou, K.; Cao, Y. A Real-Time Interference Monitoring Technique for GNSS Based on a Twin Support Vector Machine Method. Sensors 2016, 16, 329, doi:10.3390/s16030329.
[14] Jinglin Du ., Yayun Liu.,Yanan Yu., and Weilan Yan.," A Prediction of Precipitation Data Based on Support Vector Machine and Particle Swarm Optimization (PSO-SVM) Algorithms" MDPI journal,Algorithms 2017, 10, 57; doi:10.3390/a10020057.
[15] Jiawei Han,Michale kamber, "Data Mining Concepts and Techniques"Second Edition.