Volume 9, No. 1, January-February 2018
International Journal of Advanced Research in Computer Science
RESEARCH PAPER
Available Online at www.ijarcs.info
ISSN No. 0976-5697
ANALYSIS OF FACULTY PERFORMANCE EVALUATION USING
CLASSIFICATION
Suman Bhatnagar
Associate Professor, School of Computer and Systems Sciences, Jaipur National University
Jaipur – 302017 (India)
Prof. Prashant Sahai Saxena
Director, School of Computer and Systems Sciences, Jaipur National University
Jaipur – 302017 (India)
Abstract: In order to increase the effectiveness of delivery of quality education, it is important to evaluate the performance of two major
stack-holders namely students and faculty. Presently, Data Mining has emerged an important area of research in Higher and Technical Education. Data mining techniques are applied in higher education to address and give an insight to educational and administrative problems in HEIs. However, a large portion of the instructive mining research concentrates on modelling and predicting student's performance and a very few research models are available on faculty performance. While evaluating faculty performance, majority of the research used questionnaire as an important tool for collecting feedback from the students. The same method is being used in this research also. In this study, we have applied five Classification Techniques namely Logistic Regression, Decision Tree, Linear SVM, Neural Network and Naive Bayes and used student’s results along with filled questionnaires to predict the performance of faculty. The accuracy, sensitivity and specificity of classification rules were estimated. The findings of the study indicate the effectiveness of classification in evaluation of faculty.
Keywords: Classification, Logistic Regression, Decision Tree, Linear SVM, Neural Network, Naïve Bayes, Accuracy, Specificity,
Sensitivity
I. INTRODUCTION
These days Higher Educational Institutions (HEIs) are facing a challenge of improving quality of academics. Student satisfaction surveys are commonly used as a tool to capture the quality of teaching and learning. They can indeed provide valuable information to the senior management of HEIs providing insights on their strengths and weaknesses. While evaluating faculty performance, different parameters can be used in different classification algorithms for prediction of performance. By classification we can get better efficiency and accuracy in evaluating the performance of faculty.
Evaluation refers to a quantitative assessment of the faculty aimed at identifying its strengths, weakness and providing adequate professional development opportunities. It involves the use of classroom observations, student evaluation report etc., to measure the performance and effectiveness of a faculty. The objective is to provide informative feedback to assist faculty in improving the effectiveness of their teaching performance. It deals with the professional development of a faculty,development besides classroom teaching.
Classification is a machine learning technique that allocates each dataset to predefined groups while prediction is used to predict continuous valued function and accurately predict the target category for each item in a given data set. The classification is performed in two steps:
Building of Classification Model
Use of Classifier for classification
Firstly, accuracy of classification rules is estimated and if it is satisfactory then applied to the other data sets. The simplest classification problem also known as binary classification has only two possible values low and high while other classification problem may have more than two values. There are different classification techniques used for determining relationships between the values of the predictors and the target value [5].
The aim of this research is to apply the Classification technique for relative evaluation of faculty performance on the basis of two parameters student feedback and result in a course taught by faculty. In this study, four classification techniques – Decision Tree algorithms, Support Vector Machines (SVM), Artificial Neural Networks (ANN), and Discriminant Analysis (DA) – are chosen to build classifier models on a dataset composed of the responses of students to a course evaluation questionnaire and the performances of these models are compared.
The rest of this paper is organized as follows: Section II gives a review of literature Section III is giving a detail of methodology. Section IV presents the results and discussions, and Section V concludes the study.
II. REVIEW OF LITERATURE
Data mining techniques are applied in higher education more and more to give insights to educational and administrative problems in order to increase the managerial effectiveness. However, most of the researches carried out on educational mining focuses mainly on modeling student's performance and very a small number of researches model on faculty performance [1], [2], [3], [4].
M. Agaoglu (2016) focuses on modeling student's performance instead of instructors' performance. He applied four different classification techniques decision tree, support vector machines, artificial neural networks, and discriminant analysis on course evaluation questionnaire based on students' perception to build classifier models. Their performances were measured using accuracy, precision, recall, and specificity performance metrics criteria. C5.0 classifier performed best with respect to accuracy, precision, and specificity [6].
Ukwueze et al. (2016) in his study evaluated performance of four selected algorithms (C4.5, Algorithm K-Nearest Neighbor, Neural network and Naive Bayes) in terms of classification accuracy measure. These algorithms were compared on datasets containing academic and social dataset of student. This research showed that the decision tree algorithm give better results in predicting the performance of students [7].
Gopala K. Et al. (2013) in his study focus on finding the right algorithm for classification of data that works better on diverse data sets. A total of 14 classification algorithms have been used in this comparative study that include Bayes Net & Naive Bayes (from Bayes), Multilayer Perceptron, Simple Logistics & SMO (from functions), IBK & KStar (from Lazy), NNge, PART & ZeroR (from Rules) and ADTree, J48, Random Forest & Simple Cart (from Trees). It was observed in the results that the performance of a classifier depends on the data set, especially on the number of attributes used in the data set and one should not rely completely on a particular algorithm for their study [8].
Cristina Oprea (2014) evaluated the performance of four classification algorithms K-nearest neighbor, Naive Bayes, Multilayer Perceptron and ID3 on the different datasets on the basis of scope, size and number of attributes. He uses three different datasets human resource, marketing and education for this research. Dataset Education (EDU dataset) contains information on the performance of students at the college. It was observed that the performance indicators: the accuracy, ROC curve and the error F-measure varies according with the size of the dataset and the number of attributes [9].
Ashok Kumar et al (2015) investigated performance of the four classification algorithms (Regression, Bayes Net, Naive Bayes, Support Vector Machine and Decision Table) on diabetes patient datasets [10].
Chandrani Singh et al. (2016) performed an analysis of faculty performance considering student feedback which can directly or indirectly impact management’s decision and teaching standards. The classifier model used was the full training set and ZeroR algorithm. Then clustering of the correctly classified data was performed using EM algorithm. The consistency in performance of faculties in the Associate Proessor level was found to be more leveled than the faculties at the lecturer level. [11].
Amjad Abu Saa (2016) conducted study on four decision tree algorithms namely, C4.5 decision tree, ID3 decision tree, CART decision Tree, and CHAID on the collected student’s data to discover relations between students’ personal and social factors, and their educational performance in the previous semester using data mining tasks [12].
Roxanne A. et al.(2012) worked on the dataset of newly-hired faculty members and provide significant knowledge for predicting training needs in order to devise development programs necessary to enhance faculty inherent potentials. He used rule-based classification (sequential covering algorithm and hold-out method) for this purpose[13].
Ajay Kumar Pal et al. (2013) investigated teacher’s
CART, Naive Bayes, LAD and ID3 through Weka tool. The result obtained showed that Naïve Bayes was best algorithm with lowest average error as compared to others. It was also found that content arrangement was the strongest attribute among all other attributes, and then the result plays an important role in the performance of teachers [14].
S. Olalekan et al. (2015) conducted study in which he determine the performance of three classification algorithms (Decision Tree, Multi-Layer Perceptron (MLP) Neural Network and Naïve Bayes ) on varying simulated data sizes. The performance is measured on the basis of time taken by the algorithms for trainings and accuracies of their classifications were analyzed for the different data sizes. Results obtained shows that Naïve Bayes takes smallest amount of time to train data but with least accuracy as compared to MLP and Decision Tree algorithms [15].
Parneet Kaur et al. (2015) applied classification algorithms such as Multilayer Perception, Naïve Bayes, SMO, J48 and REP Tree on dataset of student academic records in order to identify the slow learners among students. WEKA an Open Source Tool is used [16].
III. METHODOLOGY
This study was set out to empirically study the performance of five classification algorithms namely Logistic Regression, Decision Tree, Linear SVM, Neural Network and Naïve Bayes in terms of the Accuracy, Sensitivity and Specificity of their predictions. Performance is most of the time expressed in terms of accuracy and can be considered as the most important one amongst Accuracy, Sensitivity and Specificity. The classifiers performance results based on several performance measurements from different measurement groups are more robust than results based on one performance measurement or performance measurement from the same group. The selected target variables in this case, or the concept to be learned by data mining algorithm, were “Pass & Fail” and “Good Grades”. A target variable was constructed based on the original numeric parameter university average score. It has five distinct values (categories) − “excellent”, “very good”, “good”, “average” and “bad”. The five categories (classes) of the target (class) variable were determined from the total university score achieved by the students. During the “Modeling Phase”, the methods for building a model that would classify the students into the five classes (categories), depending on their university performance and faculty feedback are considered and selected. Here Predictors are:
i. Agg_Time_Sense_RankFactor ii. Agg_Subject_Command_RankFactor iii. Agg_Teaching_Methods_RankFactor iv. Agg_Helping_Attitude_RankFactor
v. Agg_Laboratory_Intraction_RankFactor vi. Agg_Class_Control_RankFactor
Target or dependent variables are:
A. Training and Validation Set
A Model was built using training set containing pre-classified target and predictor variables in order to find the optimal weights. Then validation set was used to estimate the adjusted mode. Again, the validation set data is applied on the the adjusted model and results were compared with the unused pre-classified data.
We did a stratified sampling and divided our Development Data into Training (70%) and Validation (30%) data sets. Total numbers of 925 and 395 observations were made in Training and Validation data set.
All modeling was done on the Training Data sets and results were evaluated on Validation Data set. A separate Test data set was not evaluated for this exercise. We carried out two studies for this research; in the first we modeled target variable Pass_Fail with respect to all factors of faculty performance evaluation and in the second target variable Good Grades was modeled with respect to all factors of faculty performance evaluation.
Here we modeled Target Variable Pass-Fail with respect to all factors related to teaching.
IV MODELLED TARGET VARIABLE PASS_FAIL AND GOOD_GRADES W.R.T. ALL FACTORS
We evaluated selected classifiers to find out model which best explains Target variable “Pass_fail” and “Good_Grades”. We have used ‘R’ tool for comparing different classification techniques due to its powerful packages for data manipulation, visualization and computation.
For performing this analysis we used five classification models for predictive modelling. Here are the results:
A. Logistic Regression
Logistic Regression is considered to be a powerful modelling tool. Logistic regression is the appropriate regression analysis to conduct when the dependent variable is dichotomous (binary). Like all regression analyses, the logistic regression is a predictive analysis [17]. Logistic regression was considered in this project due to the nature of response variables (discrete). During prediction, it builds a model to predict the odds of its occurrence.
.
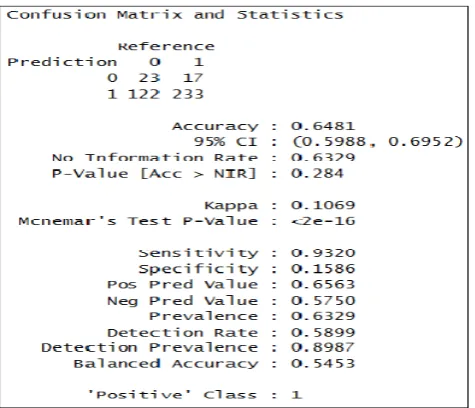
Figure 1(b) Confusion Matrix and Statistics for logistic Regression with respect to Target Variable “Good_Grades”
B. Decision Tree
A decision tree is a decision support tool and their possible consequences, including chance event outcomes, resource costs, and utility. Tree based learning algorithms are one of the best and mostly used supervised learning methods with high accuracy, stability and ease of interpretation and are used to model linear as well as non-linear relationships. They are flexible at solving any kind of problem at hand (classification or regression). Such type of trees is known as CART [18].
[image:3.595.310.551.64.242.2]
Figure 2: Final Stage of Decision Tree showing Subject Command as most Promising P;redictor in Faculty Performance
Variable Importance :
Node number 1: 925 observations, Complexity param=0.02058824,
Predicted class=1 Expected loss=0.3675676 P (node) =1
Class counts: 340 585 Probabilities: 0.368 0.632
Left son= 2(849obs) Right son= 3 (76 obs)
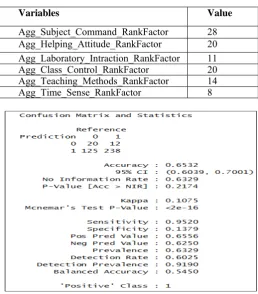
[image:3.595.317.570.395.516.2] [image:3.595.42.280.539.743.2]Table1: Showing Variable Importance on target variable Pass_fail
Variables Value
Agg_Subject_Command_RankFactor 28 Agg_Helping_Attitude_RankFactor 20 Agg_Laboratory_Intraction_RankFactor 11 Agg_Class_Control_RankFactor 20 Agg_Teaching_Methods_RankFactor 14 Agg_Time_Sense_RankFactor 8
Figure 3(a): Confusion Matrix and Statistics for Decision Tree with respect to Target Variable “Pass_Fail”
Variable importance (n=925)
Node number 1: 925 observations, Complexity Param=0.1071429
Predicted class=0
Expected loss=0.04540541 P (node) =1 Class counts: 883 42
Probabilities: 0.955 0.045
Left son=2 (849 obs) Right son=3 (76 obs)
Table2: Showing Variable Importance on target variable Good_Grades
Variables Value
Agg_Subject_Command_RankFactor 27 Agg_Helping_Attitude_RankFactor 17 Agg_Laboratory_Intraction_RankFactor 13 Agg_Class_Control_RankFactor 18 Agg_Teaching_Methods_RankFactor 15 Agg_Time_Sense_RankFactor 10
Figure 3(b): Confusion Matrix and Statistics for Decision Tree with respect to Target Variable “Good_Grades”
C. Linear SVM
Support Vector Machines (SVMs) are a set of supervised learning methods used for classification, regression and outlier’s detection. Support Vector Machines are effective in high dimensional spaces and also in cases where number of dimensions is greater than the number of samples. Different Kernel functions can be specified for the decision function. Common kernels (e.g. Linear) are provided, but it is also possible to specify custom kernels [19].
Figure 4 (a): Confusion Matrix and Statistics for Linear SVM with respect to Target Variable “Pass_Fail”
[image:4.595.35.294.80.375.2] [image:4.595.309.549.408.569.2] [image:4.595.319.560.422.748.2]D. Artificial Neural Network
Artificial neural networks (ANNs) or connectionist systems are computing systems inspired by the biological neural networks that constitute human brains which progressively improve their performance by learning. The Multi-layer Perception (MLP) is a basic feed forward artificial neural network using a back-propagation algorithm for training. That is, during training, information is propagated back through the network and used to update connection weights.
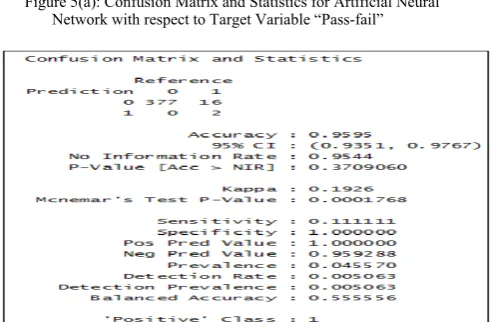
Figure 5(a): Confusion Matrix and Statistics for Artificial Neural Network with respect to Target Variable “Pass-fail”
Figure 5(b): Confusion Matrix and Statistics for Artificial Neural Network with respect to Target Variable
“Good_Grades”
E. Naive Bayes
One of the major statistical methods in data mining is Bayesian inference. It assumes that all class-conditional probability densities are completely specified. It is a based on Bayes’ Theorem with an assumption of independence among predictors. It assumes the presence of a particular feature in a class is unrelated to the presence of any other feature. Naive Bayes classifiers are highly scalable, requiring a number of parameters linear in the number of variables (features/predictors) in a learning problem [20]. This classifier tenders a simple yet powerful supervised classification technique.
Figure 6(a): Confusion Matrix and Statistics for Naive Bayes classifier with respect to Target Variable “Pass_Fail”
Figure 6(b): Confusion Matrix and Statistics for Naive Bayes classifier with respect to Target Variable “Good_Grades”
V. PERFORMANCE COMPARISON OF SELECTED CLASSIFICATION TECHNIQUES
We have carried out comparison for two studies; study 1 applied Pass_Fail as a target variable whereas study 2 applied Good_Grades as a target variable. The performance metrics include accuracy, sensitivity and specificity as a performance evaluating criteria for different classification algorithm . The entire data set is divided into 70% and 30% training/validation data set. A Comparison on these techniques was made and overfitting is evaluated.
[image:5.595.325.552.56.212.2]A. Comparison on the Basis of Target Variable Pass_Fail w.r.t. all Factors
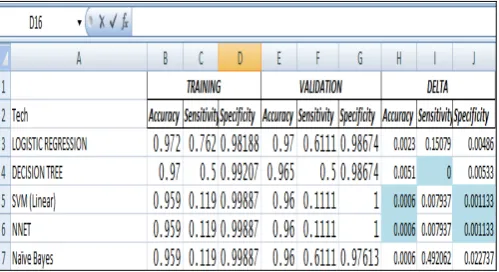
[image:5.595.51.293.182.526.2] [image:5.595.54.290.185.335.2] [image:5.595.325.549.254.390.2] [image:5.595.52.298.346.507.2]Figure – 7: Comparison of Classification Techniques on the basis of different Performance Criteria’s (Pass_Fail)
Figure – 8: Bar Chart Showing Performance evaluation of Selected Classification Techniques
B. Comparison on the Basis of Target Variable Good_Grades w.r.t. all Factors
[image:6.595.320.546.55.211.2]Below figure shows the summary of the performance comparison of the five different data classification techniques on the basis of target variable Good_Grades with respect to factors Time_Sense, Subject_Command, Teaching_Methods, Helping_Attitude, Laboratory_Intraction and Class_Control. However, Artificial Neural Network and SVM (linear) shows lowest delta (0.00634) for specificity performance criteria. Artificial Neural Network may be very useful in situations where data is having lot of missing values that are categorical in nature and requires higher speeds of classifications.
[image:6.595.57.284.210.370.2]Figure – 9: Comparison of Classification Techniques on the basis of different Performance Criteria’s (Good_Grade)
Figure – 10: Bar Chart Showing Performance evaluation of Selected Classification Techniques (Good_Grade)
VI CONCLUSION
This research is an attempt to provide an insight to educational, managerial and administrative issues. This provides a deeper understanding of factors responsible for faculty evaluation. ‘Subject Command’ is the most important factor responsible for result (target variable ‘Pass_Fail’) of students. Based on the lowest value of delta for accuracy (0.0073), it is observed that the Decision Tree is the best technique amongst five applied techniques for this study. However, in another study (target variable ‘Good_Gradesl’) SVM and ANN performed well as compared to other techniques applied in terms of accuracy and specificity.
REFERENCES
[1] R. S. J. D. Baker and K. Yacef, “The state of educational data mining in 2009: A review and future vision”, J. Edu. Data Mining, vol. 1, no. 1, pp. 3_17, 2009.
[2] F. D. Kentli and Y. Sahin, “An SVM approach to predict student performance in manufacturing processes course”, Energy, Edu., Sci. Technol. B, vol. 3, no. 4, pp. 535_544, 2011.
[3] A. Peña-Ayala, “Review: Educational data mining: A survey and a data mining-based analysis of recent works”, Expert Syst. Appl., vol. 41, no. 4, pp. 1432_1462, 2014.
[4] J. Zimmerman, K. H. Brodersen, H. R. Heinimann, and J. M. Buhmann, “A model-based approach to predicting graduate-level performance using indicators of undergraduate-graduate-level performance”, J. Edu. Data Mining, vol. 7, no. 3, pp. 151_176, 2015.
[5] Mustafa Agaoglu, “Predicting Instructor Performance Using Data Mining Techniques in Higher Education”, Digital Object Identifier 10.1109/IEEE ACCESS.2016.2568756.
[6] Ukwueze Frederick N., Okezie Christiana C, “Evaluation of Data Mining Classification Algorithms for Predicting Students Performance in Technical Trades”, International Journal Of Engineering And Computer Science ISSN: 2319-7242 Volume 5 Issues 8 Aug 2016, Page No. 17593-17601.
[7] Gopala K., Murthy N., Bharath K. P., Nagaraju O., “Performance Analysis and Evaluation of Different Data Mining Algorithms used for Cancer Classification”, International Journal of Advanced Research in Artificial Intelligence, Vol. 2, No.5, 2013.
[8] Cristina Oprea, “Performance evaluation of the data mining
classification methods”, information society and sustainable development, (2014).
[image:6.595.38.288.569.705.2]International Journal of Computer Science and Information Technologies (IJCSIT), Vol. 6 (2) , 2015, 1312-1319.
[10] Chandrani Singh,Arpita Gopal and Santosh Mishra, “Performance assessment of faculties of management discipline from student perspective using data mining”, International Journal of Data Engineering by Computer Science Journals, March 2016, ISSN (Online) 2180-1274.
[11] Amjad Abu Saa, “Educational Data Mining & Students Performance Prediction”, International Journal of Advanced Computer Science and Applications (IJACSA), Vol. 7, No. 5, 2016.
[12] Roxanne A. Ancheta, Rosmina Joy M. Cabauatan, Bartolome T. Tanguilig Lorena, W. Rabago, “Predicting faculty development trainings and performance using rule-based classification algorithm” , Asian Journal of Computer Science And Information Technology 2: 7 (2012) 203 – 209.
[13] Ajay Kumar Pal, Saurabh Pal, “Evaluation of Teacher’s Performance: A Data Mining Approach”, International Journal of Computer Science and Mobile Computing (IJCSMC), Vol. 2, Issue. 12, December 2013, pg.359 – 369.
[14] Parneet Kaur, Manpreet Singh, Gurpreet Singh Josan, “Classification and prediction based data mining algorithms to
predict slow learners in education sector”, 3rd International Conference on Recent Trends in Computing 2015(ICRTC-2015) Procedia Computer Science 57 (2015(ICRTC-2015) 500 – 508.
[15] S. Olalekan Akinola, O. Jephthar Oyabugbe, “Accuracies and Training Times of Data Mining Classification Algorithms: An Empirical Comparative Study”, Journal of Software Engineering and Applications, 2015, 8, 470-477.
[16] Statistics Solutions.com, StatisticsSolutions “Advancement
through Clarity”, [Online]. Available:
‘http://www.statisticssolutions.com/what-is-logistic-regression.
[17] AnalyticsVidhya.com, ‘A Complete Tutorial on Tree Based Modeling from Scratch (in R & Python)’ [Online].Available:https://www.analyticsvidhya.com/blog/20 16/04/complete-tutorial-tree-based-modeling-scratch-in-python.
[18] Scikit-learn: Machine Learning in Python, Pedregosa et al., JMLR 12, pp. 2825-2830, 2011.