98
SELECTION OF ALTERNATIVE UPDATING
POLICY UNDER COGNITIVE THEORY
FRAMEWORK
Dr. Tarun Chopra
Associate Professor, Govt. Engineering College Bikaner, (India)-334004 [email protected]
ABSTARCT:
The decision making strategy adopted by the fault diagnosis system should consider the benefit of acquiring information versus introducing measurement error into system knowledge. Further, it is expected to revise its beliefs by judging the truth of informationally valuable hypotheses. It should avoid rejecting important hypotheses simply on the basis of the probability of truth and error and should be indifferent to the truth or error of a hypothesis it regards as informationally unimportant. In this paper, decision making for fault diagnosis for the DAMADICS problem has been considered under the framework of cognitive decision theory.
Keywords: Fault Diagnosis, Benchmark Process Control System
I. INTRODUCTION
There are a large number of process variables available for measurement in the sugar plant taken up for this research. Hence, for efficient fault diagnosis, the selection of more informative sensors and continuous monitoring of their health condition is an important problem that needs epistemological consideration. Sensor uncertainty depends on what is observed rather than the sensor itself. Also, inability of the sensor to measure all relevant attributes or ambiguous observations can all contribute to uncertainty. The advantage of multiple sensors is that the observations of each one may be combined into an improved estimate of the state compared to one derived from a single sensor. Hence, each sensor may play the role of a potential contributor to a composite decision making process. In this paper, decision making for fault diagnosis for the DAMADICS problem[1] has been considered under the framework of cognitive decision theory[2-3].
Epistemological considerations have been made in this paper which may further help in improvement of the results by making the decision making system self learning and intelligent
II. PROPOSEDMETHODLOGY
99
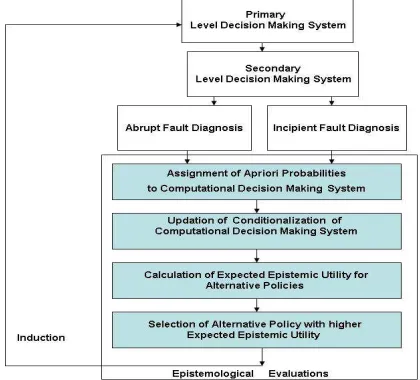
Figure 1: Proposed Framework for Epistemological Evaluations
Since such decisions are prescriptions for how to revise system’s beliefs in the light of new evidence, they are also termed as updating policies. Updation of conditionalization of the computational decision making system leads to the possible posterior probability distributions.
In the pursuit of acquiring error-free knowledge, epistemic utility of taking a decision in a given scenario is evaluated and analyzed under the framework of Cognitive Decision theory. Expected Utility Function helps in evaluating the degree of fit between the truth and the belief states of the computational decision making system. Hence, in any given epistemic predicament, that alternative policy (i.e., epistemologically rational action) is selected which maximizes the value of this function.
III. IMPLEMENTATIONOFPROPOSEDMETHODLOGY
In the primary decision making stage the granulation of measured parameters was done on the basis of max-min ranges. Instead of this, the criteria of granulation are now chosen so that all the granules have a spread of ± 3
times of standard deviation around the mean value of the dataset for the selected class. Thus, an alternative
preliminary Decision Making policy is now available. This selection of policy is based on the study of the distribution of the data of two states of the system, namely normal and fault conditions.
100
CV P1
X F
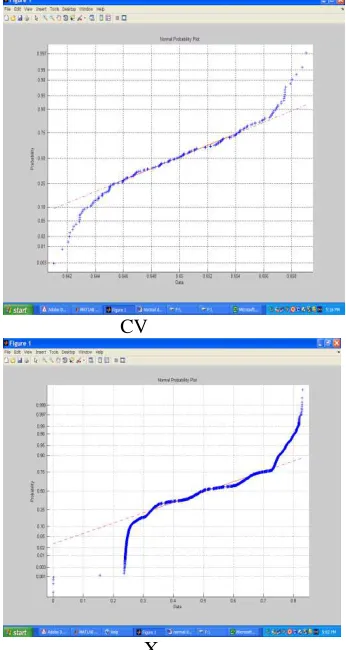
Figure 2: Distribution of Measured Parameters Values
For the Data set considered for Class 0 (Normal Condition) and Class 1 (Fault Condition) following results are
obtained on the basis of alternative policy as indicated in Table 1-2.
Table 1: Values (p.u.) of Measured Parameters (Class 0 – Normal Condition)
Mean (m) Standard deviation
(sd) m+3 sd m-3 sd
CV 0.263817 0.875232 0.650595 0.215223 P1 0.076837 0.030722353 0.005022 0.001713791 P2 0.494328 0.967399058 0.665662 0.220364374 T 0.033306 0.783064942 0.635528 0.210081626
Table 2: Values (p.u.) of Measured Parameters (Class 1 – Fault Condition)
Mean (m) Standard deviation
(sd) m+3 sd m-3 sd
CV 0.555921 0.8896273 0.649507 0.2453558 P1 0.089686 0.029035598 0.004722 0.061200152 P2 0.82498 0.976734093 0.663674 0.428956257 T 0.286861 0.802520507 0.63534 0.061755343
101 Table 3: Ranges of the Measured Parameters within the classes
Measured
The ranges of the values presented in Table have been granulated, depending on the classes (class 0 – Normal Condition, class 1 – Fault Condition), as illustrated in Table 4.
Table 4: Granulated ranges of the Measured Parameters
Measured
The following Perception-Based Rules are now obtained:-
R1: IF CV is A11 or CV is A12 and P1 is A21 or P1 is A22 and P2 is A32 or P2 is A33 and T is A42 or T is A43 THEN Class 0.
R2: IF CV is A12 or CV is A13 and P1 is A22 or P1 is A23 and P2 is A31 or P2 is A32 and T is A41 or T is A42 THEN Class 1.
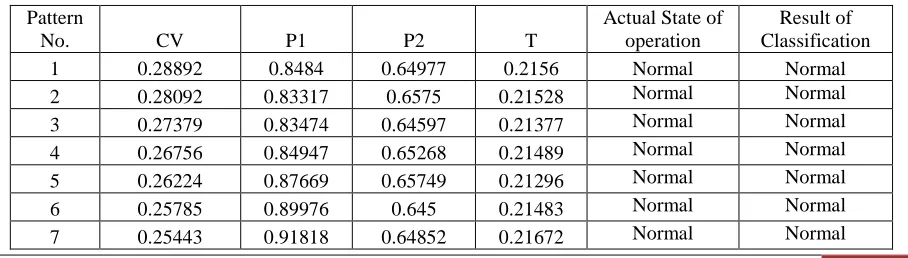
The classification system includes the above mentioned rules and membership functions are expressed accordingly. Finally, the results of classification based on alternative policy are obtained from these rules and have been depicted as in Table 5.
Table 5: Results for Selected Datasets
102
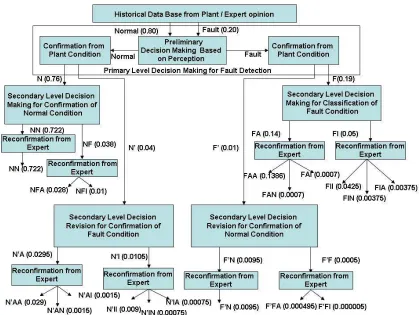
Thus, the following probabilities may be assigned at Primary Level Decision Making System:
q(N) = 0.8 *0.95 = 0.76 q(F) = 0.2*0.95 = 0.19
Also the following probabilities may be assigned for the falsely assumed states of operation, taking into account the fact that 5% of misclassified cases arising due to unreliability of decision making system/ sensor are distributed evenly:
q(N’) = 0.8 *0.05 = 0.04 q(F’) = 0.2*0.05 = 0.01
At Secondary Level Decision Making System for confirmation of Normal Condition, from the earlier results obtained, one case was wrongly classified as faulty out of data set of twenty with misclassification error as 5%. Hence, the probabilities of output at this stage may be assigned as:
q(N N) = 0.722 q(NF) = 0.038
With fourteen abrupt fault cases possible out of spectrum of nineteen faults considered, the probability of normal being classified as abrupt fault condition and the probability of normal being classified as incipient fault condition can be calculated respectively as :-
q(NFA) = 0.038*14/19 = 0.028 q(NFI) = 0.038*5/19 = 0.01
Similarly, at Secondary Level Decision Making System for confirmation of Fault Condition, from the results obtained with misclassification error for abrupt fault as about 1% and for incipient faults about 15%; the following probabilities of output at this stage may be assigned :-
103
q(FA) = 0.14 q(FI) = 0.05 q(FAA) = 0.1386 q(FAN) = 0.0007 q(FAI) = 0.0007 q(FII) = 0.0425 q(FIN) = 0.00375 q(FIA) = 0.00375 q(N’A) = 0.0295 q(N’AA) = 0.029 q(N’AN) = 0.0015 q(N’AI) = 0.0015 q(N’I) = 0.0105 q(N’II) = 0. 009 q(N’IN) = 0.00075 q(N’IA) = 0.00075 q(F’N) = 0.0095 q(F’F) = 0.0005 q(F’FA) = 0.000495 q(F’FI) = 0.000005
This Probability assignment has been depicted in Figure 3.
Figure 3: Assignment of A priori Probabilities for Alternative Policy
104
The proposed methodology provides scope for fine tuning of the decision making system for the continuous improvement of results, thereby making the decision making system Self Learning and Intelligent. The above analysis is utilized for improving the fault diagnosis results by consideration of possible alternatives in the Perception Based Decision Making System.
REFERENCES
[1] Witczak M., Korbicz J., Mrugalski M., Patton R. J., “A GMDH Neural Network-Based Approach to Robust Fault Diagnosis: Application to the DAMADICS Benchmark Problem”, March 04.
[2] Greaves H. and Wallace D., “Justifying conditionalization: Conditionalization maximizes expected epistemic utility”, February 26, 2005.