Abstract—India has witnessed an alarming increase in the number of dengue cases to the count of about 300 percent since 2009 as per the National Health Profile, 2018. Dengue is considered a serious threat not only in India but also is becoming a problem all over the world especially in tropical countries like Indonesia, India and Malaysia. Dengue cases were widespread during the onset and the duration of monsoon due to the collection of water creating breeding grounds for female aedes mosquitoes which are vectors for Flavivirus (Dengue virus). With the lack of appropriate infrastructure and methodology to identify vulnerable regions in India, the cases of dengue have been on the rise. This paper is an attempt to use machine learning and statistical models to predict dengue cases across India and identify the patterns between climatic factors, urbanization and number of cases reported for dengue. This includes the spread spectrum of dengue and also accounts as an AI based mitigative forecast model to alert the concerned authorities before the spread of the epidemic. This will enable the concerned authorities to gauge the situation and take appropriate steps to prevent the pandemy.
IndexTerms— dengue, flavivirus, machine learning,
artificial intelligence, forecast-model.
I. INTRODUCTION
Dengue is a fast emerging, pandemic prone viral disease accompanied by life-threatening symptoms including high fever, leaking plasma, severe flu-like symptoms, fluid accumulation and a major decline in the patient’s platelet count etc. The disease is hard to identify and has very low specificity in medical treatment, thereby causing an increase in the number of fatalities. The outbreak of dengue in an area has been observed to have common correlations leading to a causation such as rising sea surface temperatures, changing air temperatures, severe urbanization and precipitation variances. These conditions have contributed to breeding grounds for mosquitoes. The effects of dengue exceed that of
Manuscript revised May 13, 2019 and published on June 5, 2019
Savita Choudhary, Department of Computer Science, Sir M. Visvesvaraya Institute of Technology, VTU, Bengaluru, India
Vipul Gaurav, Department of Computer Science, Sir M. Visvesvaraya Institute of Technology, VTU, Bengaluru, India
Tushar Sharma, Department of Computer Science, Sir M. Visvesvaraya Institute of Technology, VTU, Bengaluru, India
Vishal V, Department of Computer Science, Sir M. Visvesvaraya Institute of Technology, VTU, Bengaluru, India
Pradyumna KR, Department of Computer Science, Sir M. Visvesvaraya Institute of Technology, VTU, Bengaluru, India
the other viral illnesses such as human papillomavirus (HPV), rotavirus etc. Since there is no specific medication available for treatment of dengue, there is a need to predict the spread of the epidemic beforehand to ensure that the concerned authorities are alerted. The major concern raised is that these cases could have been prevented if the authorities were alerted about the outbreak using a dependable time-series forecasting model. With the help of various machine learning techniques, this paper aims to make a prediction of the number of possible cases of dengue in the future and also study the cause of it in India. The solution aims to acquaint the general public and authorities about the plausible outbreak of dengue so that it can be eliminated from the grass root level in the upcoming future.
II. LITERATURE SURVEY
Dengue has been identified as a major disease in many tropical countries with climate similar to India. Pi Guo et al. 2017[3] studied many implementations for predicting the outbreak of dengue in five states across China. The paper provided conclusive proof that Support Vector Regression (SVR)[3] provides better results as compared to Linear Regression, Negative Binomial Regression and Least Absolute Shrinkage and Selection Operator (LASSO) Linear Regression model in terms of accurately predicting the occurrence of dengue. P. Muhiltini et al. 2018[4] experimented with Gradient Boosted Regression on data from different countries and ran across parameters ranging from temperature, precipitation and number of dengue cases to validate the claim using a Mean Square Error (MSE) loss function. They also make use of ensemble models to reduce noise, variances and bias in the results. Ensembles can be trained efficiently using a shuffle training strategy. N. Rajathi
et al. 2018[6] experimented with a multitude of models
including Naive Bayes Classifiers, Random Forests, Reduce Error Pruning (REP) Trees, J48 Java implementation, Sequential Minimal Optimization (SMO), Locally Weighted Learning (LWL) and AdaBoost combined with Decision Trees and ZeroR techniques to predict the outbreak in Kerala. They concluded that Random Forests are most suitable with a classification accuracy of 83.3%. Random forests take advantage of the ensemble effect of multiple decision trees. S
Vinodkumar, et al. 2018[5] have used a dataset consisting of
attributes like fever, bleeding, metallic taste, nausea and fatigue. The aim of this study is to calculate the performance of various classification techniques and compare their performances. The classification techniques used in this study are REP Tree, J48, SMO, ZeroR and Random Tree. The classification techniques were comparatively analysed
Forecasting Dengue and Studying Its Plausible Pandemy
Using Machine Learning
and used Weka, a data mining tool for classification. SARIMA (Seasonal ARIMA) implementation has been also used as a time series to forecast the number of cases reported for Malaria, Adhistya Erna Permanasari et al. 2018[7]. They have researched the significance of disease forecasting with the help of numerous cases reported using the time series model. It makes use of Seasonal Autoregressive Integrated Moving Average Method (SARIMA) model which helps in identifying similar patterns at regular time intervals. The seasonality of the data must be taken into account for the model to be consistent and accurate in its predictions. Thus, a rolling-forecasting strategy is used. The model achieved 21.6% for Mean Absolute Percentage Error (MAPE) and thereby indicated an accurate prediction over historical data on malaria. Michael J Kane et al. 2014[8], elucidated a comprehensive analysis of Autoregressive Integrated Moving Average (ARIMA) Models and Random Forest Time Series for the prediction of avian influenza H5N1 epidemic on a dataset based on Egypt. The random patterns in the data and unexpected peaks observed due to the epidemics allowed the Random Forest Time Series model to exceed the result of its counterparts.
III. METHODOLOGY
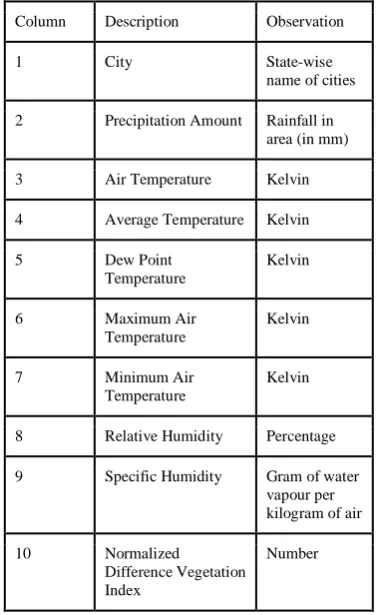
[image:2.595.334.523.109.417.2]The dengue cases in India have existed since a very long time and the number of cases increased manifold post 2009. The dataset used to make this prediction needed to take into consideration all parameters apart from the number of deaths which were affected by dengue so as to improve the dynamic adaptability of the model to new data. This also increases the accuracy of the prediction without overfitting on the number of deaths caused by dengue. We created a dataset for India from different parameters observed around the world affecting dengue, especially sampling from tropical countries. The number of cases reported across different states of India and the number of deaths among the reported cases is also a potential indicator which proved to be useful in our research work. The Government of India has maintained a record of the number of such dengue cases and the deaths reported in them from 2009 to 2018. These two datasets combined van be used to make a proper analysis tool for predicting the number of upcoming dengue cases accurately. This keeps both, the historical data in check as well as takes the other climatic attributes into account. The final data was filtered and needed minimal preprocessing to remove absent values. The methods studied for analysis of data includes Random Forest Regression, Negative Binomial Regression, Artificial Neural Networks, Random Forest Classifier and for the patterns in the number of deaths from reported cases over the years. We applied Seasonal Autoregressive Integrated Moving Average (SARIMA) and Autoregressive Moving Average (ARIMA) time series forecasting models to predict the number of possible deaths in the future. The following parameters have been included in the dataset
Table 1: Dataset describing environmental and climatic change parameters causing dengue
Column Description Observation
1 City State-wise
name of cities
2 Precipitation Amount Rainfall in
area (in mm)
3 Air Temperature Kelvin
4 Average Temperature Kelvin
5 Dew Point
Temperature
Kelvin
6 Maximum Air
Temperature
Kelvin
7 Minimum Air
Temperature
Kelvin
8 Relative Humidity Percentage
9 Specific Humidity Gram of water
vapour per kilogram of air
10 Normalized
Difference Vegetation Index
[image:2.595.333.522.460.686.2]Number
Table 2: Government of India Dataset describing number of cases and deaths reported due to dengue
Column Description
1 States
2 2014-Number of cases
3 2014-Number of deaths
4 2015-Number of cases
5 2015-Number of deaths
6 2016-Number of cases
7 2016-Number of deaths
8 2017-Number of cases
9 2017- Number of deaths
10 2018-Number of cases
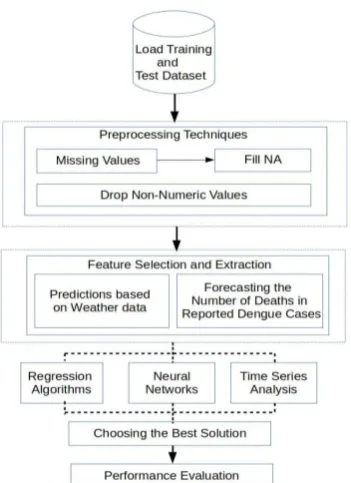
Figure 1: Architecture of Machine Learning Model Pipeline
A. Negative Binomial Regression
The Negative Binomial distribution is a form of a Poisson distribution in which the distribution's parameter is itself considered a random variable. The Negative Binomial Regression model indicates that the variables Humidity and Minimum Temperature have a significant influence on the Dengue fever incidences. This also includes a significant constant term.
B. Random Forest
Random Forest Regression is a version of Ensemble Learning which consists of the same algorithm applied multiple times to improve the efficiency and accuracy of the algorithm[8]. In this, we select a random number of data points from the training data in order to construct a decision tree. This is helpful in studying the climatic factors and weather data variations.
C. Artificial Neural Networks
The Artificial Neural Network (ANN) used to predict Dengue cases is designed as a Multi Layer Perceptron (MLP) network with the three initial layers, namely - an input layer, hidden layer(s) and an output layer. The output layer consists of a single parameter which is the prediction of number of dengue cases for the upcoming week. The elu function is used as a non-linear activation function for the hidden layer(s). The ANN model is being used for predicting certain parameters based on the temporal patterns in the data. The model learns from these patterns and generates the forecast for the future. The main ability of the model is to learn from the data itself, being one remarkable advantage but not specifically successful if the data contains random variations.
D. Autoregressive Integrated Moving Average Time Series Forecasting Model
An Autoregressive Integrated Moving Average (ARIMA) is a generalization of an Autoregressive Moving Average (ARMA) model. Both the models are fitted on the time series data either to better understand the data or to predict the future points in the series. ARIMA models are applied in some cases where the data show evidence of non-stationarity[8] or where an initial differencing step can be applied one or more times to eliminate the non-stationarity (seasonality). ARIMA models may include autoregressive (p) terms, differencing (d) terms and moving average (q) operations and are represented by ARIMA (p,q,d). ARIMA models are useful in modelling the dependency of a time series between observation and to be used as an adequate tool in epidemiological surveillance.
E. Seasonal Autoregressive Integrated Moving Average Time Series Forecasting Model
Seasonal Autoregressive Integrated Moving Average (SARIMA) is used to predict the Time Series Univariate for the seasonal patterns in the dengue prediction dataset which consists of the certain numerical patterns and similarities and hence SARIMA is largely successful[7]. The Parameters for the seasonal elements are p(Non-Seasonal Autoregressive Order), d(Non-Seasonal Differencing), q (Non-Seasonal Moving Average Order), P(Seasonal Autoregressive Order), D (Seasonal Differencing), Q (Seasonal Moving Average Order), M(The Number of Time Steps for a Single Seasonal Period).
F. Recurrent Neural Network Architecture
We implement a three layered stacked Long Short Term Memory (LSTM) units with activation function elu and it is included with the recurrent neural network with a dense layered output to run over the dataset created. This is largely successful over sequential data but usage with LSTMs can take seasonality of the data into account[10]. We tried the above mentioned architectures and machine learning algorithms over the dataset created to study and obtain the variations in the data and draw a conclusion out of it..
IV. RESULTS AND DISCUSSIONS
[image:3.595.63.239.83.325.2]Figure 2: Climatic Patterns of Bengaluru
Figure 3: Climatic Patterns of India
The vegetation cover of India and specifically Bengaluru city was also studied thoroughly. This is measured by the normalized difference vegetation index which varies according to the vegetation cover of that region. With an uneven distribution of vegetation cover, it was found that the areas with lesser green cover were indicative of a higher degree of number of dengue cases reported which stands true as expected as those areas are indicative of the urbanized areas with lesser green cover associated with it. Thus, we are able to draw an indirect hypothesis relating dengue with urbanization which makes it a significant contributing factor towards dengue
Level Variation
[image:4.595.333.542.210.529.2]The SARIMA model outperformed the ARIMA model because the data had seasonal univariate components associated with it with a rapid rise in the last decade comparatively and thus the ARIMA model did not account for it properly as compared to its counterpart. Hence, overall the Random Forest Regression and SARIMA model proved to work properly with the Indian cases of dengue and its results are shown as below
[image:4.595.80.279.553.766.2]Figure 5: Number of cases predicted in India
Figure 6: Number of cases predicted in Karnataka
V. CONCLUSION
REFERENCES
[1] Tri WulandariKesetyaningsih, Sri Andarini, Sudarto and HennyPramoedyo, “Determination of Environmental Factors Affecting Dengue Incidence in Sleman District, Yogyakarta, Indonesia ”, African Journal of Infectious Diseases, pp. 13-25, March 7, 2018.
[2] Ganeshkumar P, Murhekar MV, Poornima V, Saravanakumar V, Sukumaran K et al, “Dengue Infection in India: A Systematic Review and Meta Analysis”, Public Library of Science, July 16, 2018. [3] Pi Guo, Tao Liu, Qin Zhang, Li Wang, Jianpeng Xiao, Qingying Zhang
et al, “Developing a dengue forecast model using machine learning: A case study in China ” , Public Library of Science, October 16, 2017. [4] P.Muhilthini, B.S. Meenakshi, S.L. Lekha, S.T. Santhanalakshmi,
“Dengue Possibility Forecasting Model using Machine Learning Algorithms ” , International Research Journal of Engineering and Technology, Vol 5, Issue 3, pp. 1661-1665, March, 2018.
[5] Bhavani M, Vinod Kumar S, “A Data Mining Approach for Precise Diagnosis of Dengue Fever , International Journal of Latest Trends in Engineering and Technology, Vol 7, Issue 4, 2018.
[6] N.Rajathi, S.Kanagaraj, R.Brahmanambika and K.Manjubarkavi, “Early Detection of Dengue using Machine Learning Algorithms ” , International Journal of Pure and Applied Mathematics, Vol 118, Issue 18, 2018.
[7] Adhistya Erna Permanasari, IndrianaHidayah, IsnaAlfiBustoni, “SARIMA implementation on time series to forecast the number of
malarial incidences ” , Information Technology and Electrical Engineering (ICITEE),October, 2013.
[8] Michael J Kane, Natalie Price, Matthew Scotch and Peter Rabinowitz, “Comparison of ARIMA and Random Forest Time Series Model for prediction of avian influenza H5N1 outbreaks ” , BMC Bioinformatics, 2014.
[9] Malini A. Shetty and R.K. Somashekar, “Assessment of Vegetation Cover through NDVI, Bangalore India ” , Indian Journal of Applied Research, Vol 4 , Issue 3, pp. 176-179, March, 2014.
[10]Alex Sherstinsky, “Fundamentals of Recurrent Neural Networks (RNN) and Long Short Term Memory (LSTM) ” , arXiv: 1808.03314v4, November, 2018
.