Some statistical methods for evaluating information extraction systems
Will Lowe
Computer Science Department Bath University
Gary King
Center for Basic Research in the Social Sciences
Harvard University
Abstract
We present new statistical methods for evaluating information extraction sys-tems. The methods were developed to evaluate a system used by polit-ical scientists to extract event infor-mation from news leads about inter-national politics. The nature of this data presents two problems for evalu-ators: 1) the frequency distribution of event types in international event data is strongly skewed, so a random sample of newsleads will typically fail to con-tain any low frequency events. 2) Man-ual information extraction necessary to create evaluation sets is costly, and most effort is wasted coding high frequency categories .
We present an evaluation scheme that overcomes these problems with consid-erably less manual effort than traditional methods, and also allows us to interpret an information extraction system as an estimator (in the statistical sense) and to estimate its bias.
1 Introduction
This paper introduces a statistical approach we developed to evaluate information extraction sys-tems used to study international relations. Event extraction is a form of categorization, but the highly skewed frequency profile of international
event categories in real data generates severe prob-lems for evaluators. We discuss these probprob-lems in section 3, show how to circumvent using a novel sampling scheme in section 4, and briefly describe our application. Finally we discuss the advantages and disadvantages of the methods, and their rela-tions to standard evaluation procedure. We start with a brief review of information extraction in in-ternational relations.
2 Event Analysis in International Relations
3 Event Category Distributions
We wanted to evaluate an information extraction system from Virtual Research Associates1. This system bundles extraction and visualization soft-ware with a custom event ontology containing, at last count, about 200 categories of international event.
We found two problems with the nature of inter-national events data. First, the frequency distribu-tion over the system’s ontology, or indeed several other ontologies we considered, is heavily skewed. A handful of mostly diplomatic event types pre-dominate, and the frequency of other event types falls of very sharply: we ran the system over all the newsleads in Reuters’ coverage of the Bosnia conflict, and of the approximately 45,000 events it extracted, 10,605 were in the category of ’neu-tral comment’, 4 of ’apology’ and 35 of ’threat of force’. Thus the relative frequencies of event cat-egories in this data can be 2,500 to 1.
Also, as these figures suggest, the more inter-esting and politically relevant events tend to be of low frequency. This problem is quite general in categorization systems with reasonably articulated category systems, and not specific to international relations. But any dataset with these properties causes an immediate problem for evaluation.
Ideally we would choose a random subset of leads whose events are known with certainty (be-cause we have coded them manually beforehand), run the system over them, and then compute var-ious sample statistics such as precision and re-call2. However, a small randomly chosen subset is very unlikely contain instances of most interest-ing events, and so the system’s performance will not be evaluated on them. Given the possible fre-quency ratios above, the size of subset necessary to ensure reasonable coverage of lower frequency event categories is enormous. Put more concretely, to construct a test set of news leads the evaluator will on average have to code around 2,500 com-ments to reach a single apology and about 300 comments to find a single threat of force.
1http://www.vranet.com
2This paper only evaluates extraction performance on
event types, though there would seem to be no reason why a similar approach would not work for actors etc.
3.1 Standard Evalution Methods
The standard evaluation methods developed over the course of the Message Understanding Compe-titions consist mainly in sample statistics to com-pute over the evaluation materials e.g. precision and recall, but do not give any guidance for choos-ing the materials themselves (Cowie and Lehnert, 1996; Grishman, 1997). This is just done by hand by the judges. Perhaps because the selection ques-tion is neglected, it is seldom clear what larger population the test materials are from (save that it is the same one as the training examples), and as a consequence it is unclear what the implications for generalization are when a system obtains a partic-ular set of scores for precision and recall (Lehnert and Sundheim, 1991).
Since this literature did not help us generate a suitable evaluation sample, we approached the problem from scratch, and developed a statistical framework specific to our needs.
4 Method
One reasonable-sounding but wrong way to ad-dress the problem of creating a test set without having to code tens of thousands of irrelevant sto-ries is the following:
1. Use the extraction system itself to perform an initial coding,
2. Take a sample of the output that covers all the event types in reasonable quantities,
3. Examine each coding to see whether the sys-tem assigned the correct event code.
This looks like it can guarantee a good sample of low frequency events at much lower cost to the manual coder; we can just pick a fixed number of events from each category and evaluate them. However, this method exhibitsselection bias. To see this, letMandTbe variables indicating which event category the Machine (that is, the informa-tion extracinforma-tion system) codes an event into, and the True category to which the event actually be-longs. Statistically, the quantity of interest to us is the probability that the machine iscorrect:
This is the probability that the machine classifies an event into category i given that the true event coding is indeed i. A full characterization of the success of the machine requires knowing P(M=i|
T =i)fori=0, . . . ,J, which includes allJ event
categories and where i =0 denotes the situation where the machine is unable to classify an event into any category. In short, the quantity of interest is the full probability density P(M|T).
In statistical terms, this distribution is a
likeli-hood function for the information extraction
sys-tem. This observation allows us to treat the system like any other statistical estimator and offers the interesting possibility of analyzing generalization via its sampling properties, e.g. its bias, variance, mean squared error, or risk.
Unfortunately, the problem with the reasonable-sounding approach described above is that it does not in fact allow us to estimate P(M|T)because it is implicitly conditioning onM, notT. In par-ticular, the proportion of events that are actually in category i among those the machine put in cate-goryigives us instead an estimate of
P(T |M) (2)
which is not the quantity of interest. (2) is the probability of the truth being in some event cate-gory rather than the machine’s response whereas in fact the true event category is fixed and it is the machine’s response that is uncertain3. Worse, P(T |M) is a systematically biased estimate of P(M|T) because these two quantities are related by Bayes theorem:
P(M|T) = P(M,T)
P(T) =
P(T |M)P(M)
P(T) , (3)
and the only circumstances under which they would be equal is when P(M) is uniform. But the figures in section 3 suggest that P(M)is highly skewed.
However this last observation suggests a better method for unbiased estimation of (1).
1. Estimate P(T |M)as described above
3This is due to changes in the journalist’s choice of
vocab-ulary and syntactic construction that are uncorrelated with the identity of the event being described.
2. Compute P(M) by running the system over
the entire data set and normalizing the
fre-quency histogram of event categories
3. Estimate P(M | T) by correcting P(T | M) with P(M)using Bayes theorem
Our implementation of this scheme was to first run the system over 45,000 leads about the Bosnia conflict, and normalize the frequency histogram of events extracted to create P(M). Then, randomly choose 5 leads assigned to each event category, and manually determine which event type the in-stantiate. Then normalize to estimate P(T | M).
And finally, use (3) to create P(M|T). We chose
four times as many uncategorized leads as from each true category in addition. A larger sample here is advisable to see what sort of categories the system misses. These sample sizes are fixed, but it may also be possible to use active learning tech-niques to tune them (as in e.g. Argamon-Engelson and Dagan, 1999) for even more efficient sam-pling.
The advantage of this roundabout route to (1) is that it requires many fewer events to be manually coded. We ran the system over 45,000 leads but only manually coded a handful of events for each category. This guaranteed us even coverage of the lowest frequency event categories whilst not bias-ing the end result – for an ontology with about 200 categories this is a substantial decrease in evalua-tor effort.
This method works by making use of the ex-traction system itself to produce one important marginal: P(M). If we assume that the aim is to evaluate the system on the Bosnia conflict, P(M) is not estimated, but is rather an exact population marginal4. Then we can guarantee that our esti-mate of P(M|T)is unbiased because the method for estimating P(T | M) is clearly unbiased, and P(M)adds no error.
4.1 Summary Measures
P(M | T) allows the computation of a number of useful summary measures5. For example, we 4We might consider the Bosnian conflict to be a sample
point from the larger population of all wars, but that popula-tion – if it exists at all – is certainly difficult to quantify.
5Detailed discussion of several summary measures for the
can easily compute P(M,T) from quantities
al-ready available, so ∑JP(M=i
,T =i)is the
pro-portion of time the system extracts the correct category. Alternatively, if it is more important to extract some categories than others, then var-ious weighted measures can be constructed e.g. ∑JP(M=i|T =i)w
i wherews are non-negative
and sum to 1, representing the relative importance of extracting each category. Some more graphi-cal methods of evaluation using P(M|T)are pre-sented below.
4.2 Estimator Properties
Given a likelihood function for the extraction sys-tem we can investigate its properties as an esti-mator. It is particularly useful to know the bias of an estimator, defined in this case as the dif-ference between the expected category response from the system when the true event category is i, andiitself, where the expectation is taken of re-peated information extraction tasks that instantiate the same event categories. We do not examine the corresponding variance here, and a more complete evaluation might also address the question of con-sistency.
4.2.1 Conflict and Cooperation
The machines response and the true category is best seen as a set of multinomial probabilities (with a unit vector with the value 1 at the index of the system’s extracted category or the true cate-gory respectively. Estimator properties are cum-bersome to represent in this format, so here we map the system’s response to a single real value corresponding to the level of conflict or coopera-tion of the event category. This re-representacoopera-tion is usual in international relations and allows stan-dard econometric time series methods to be ap-plied (Schrodt and Gerner, 1994; Goldstein and Freeman, 1990; Goldstein and Pevehouse, 1997).
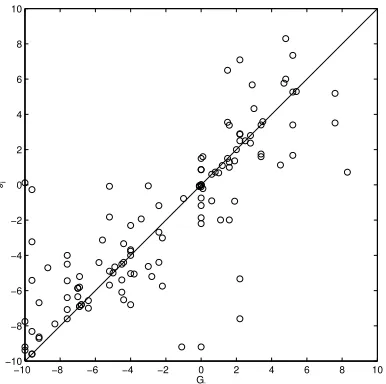
For our purposes it also allows the straightfor-ward graphical presentation of the main ideas. We define the level of conflict or cooperation level of an event category i as Gi, a real number
be-tween -10 (most conflictual) to 10 (most coopera-tive) (see Goldstein, 1992, for the full mapping). For example, according to this scheme, when i denotes the event category ‘extending economic
−10 −8 −6 −4 −2 0 2 4 6 8 10
−10 −8 −6 −4 −2 0 2 4 6 8 10
Gi
gi
Figure 1: Expected (gi) versus true (Gi)
conflict-cooperation level for each event category.
aid’, Gi=7.4, ‘policy endorsement’ maps to 3.6,
‘halt negotiations’ maps to -3.8, and a ‘military en-gagement’ maps to -10, the maximally conflictual event. The mapping allows univariate, and polit-ically relevant comparison between the true con-flict level and that of the event categories the sys-tem extracts.
The expected system response when the true category has conflict/cooperation levelGiis:
gi= J
∑
GjP(M= j|T =i,M6=0) (4)where
P(M=j|T =i,M6=0) =
P(M|T)1(M6=0) P(M6=0|T) .
and 1(M6=0)is an indicator function equaling 1 ifM6=0 and 0 otherwise.
A plot ofGiagainstgifor each event category is
shown in Figure 1. An unbiased estimator would show expected values on the main diagonal. Esti-mator bias for event category i is simply gi−Gi.
Estimator variance is simply the spread around the diagonal.
4.3 Comparison
get P(U |T). However, we cannot simply count
the proportion of times each undergraduate assigns a lead to categoryiwhen it is in fact in categoryi because this ignores the fact that we have sampled the leads themselves using the system, and must therefore condition onM. On the other hand we do have access to the relevant conditional distri-bution P(U,T |M=i). This is the distribution of
undergraduate and true categories, conditioned on the fact the the system assigns an event to cate-goryi. The desired P(U,T)is a weighted average Clearly these calculations can also be used to com-pare other systems with the same ontology using the same materials.
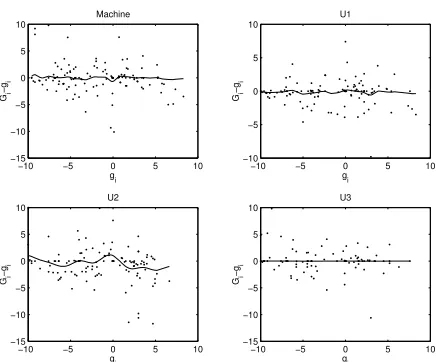
Summary statistics similar to those described above can be easily computed (King and Lowe, 2002). Here we provide graphical results: Fig-ure 2 plots the bias of the system and that of the un-dergraduates over the category set (with smoothed estimates superimposed). In the figure, the bias Gi−gi is plotted against Gi, so deflections from
the horizontal are systematic bias. In almost all cases we find that more conflictual (negative val-ued) categories are mistaken for more cooperative ones, with some suggestion of a similar effect at the cooperative end too. Of most interest is the ba-sic similarity in performance between undergrad-uates and the information extraction system.
It would be helpful if the bias that appears in these plots were systematically related to the ex-pected system response. If this was the case, in future use we could simply adjust the system’s response up or down by some coefficient deter-mined in the evaluation process and remove the bias. However, figure 3 shows that there is no systematic relation between the expected reponses and the level of bias, so no such coefficient canbe computed. This is a rather pessimistic result for this system, suggesting a level of bias that can-not be straightforwardly removed. On the other
6We would normally expect to use P(U|T
,U6=0), but
the undergraduates never failed to assign categories.
−10 −5 0 5 10
Figure 2: System (M) versus undergraduate coder (U1-3) bias. Connected lines are generated by smoothingGi−gi.
−100 −5 0 5 10
Figure 4: The probability that the system, or un-dergraduate fails to assign an event to a category, plotted against the level of conflict/cooperation of that category.
hand, one of the advantages of the methods pre-sented here is that this bias is nowestimated, and, since bias estimates are available on a category-by-category basis, redesigning effort can be di-rected in a way that maximizes generalization per-formance.
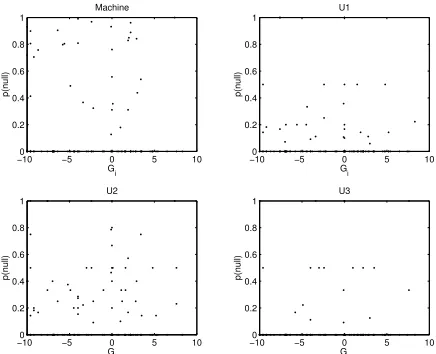
Finally, figure 4 plots the probability that the machine failed to assign an event category, P(M= 0|T =i)(denoted p(null) in the figure), as a func-tion of that category’s conflict/cooperafunc-tion value, Gi. Our interest in Gi reflects the use this data is
typically put to, since we are most concerned with errors that make the world look systematically more (or less) cooperative than it really is. But we might equally have plotted P(M=0|T =i) againstiitself, or any other property of events that might be suspected to generate difficult to catego-rize event descriptions.
Like the previous figures, plotting P(M=0|
T =i)against other quantities is a useful diagnos-tic, indicating where future work should best be applied. In this case there appears to be no sys-tematic relationship between the true level of con-flict/cooperation and the probability that either the system or the undergraduates will fail to assign the event to a category.
5 Conclusion
We have presented a set of statistical methods for evaluating an information extraction system without unreasonable manual labour when the dis-tribution of categories to be extracted is heav-ily skewed. The scheme uses a form of biased sampling and subsequent correction to estimate a probability distribution of system responses for each true category in the data. This distribution costitutes a likelihood function for the system. We then show how functions of this distribution can be used for evaluation, and estimate the system’s statistical bias.
The two main ideas: using estimates of P(M|
T) as the basis for evaluation, and using a non-standard sampling scheme for the estimation, are separate. Emphasis on using P(M|T)comes from standard statistical theory, and if correct, suggests how evaluation in information extraction might be integrated in to that body of theory. When a sam-ple of leads is randomly chosen and can be ex-pected to be reasonably representative, then the sampling machinery described above, the compu-tation of P(M), and the application of Bayes the-orem will not be necessary. But when the distri-bution of categories to be extracted is so highly skewed then our method is the only one that will make it feasible to evaluate a system on allof its categories in an unbiased way.
The principle difference between these and standard evaluation methods is in our explicitly statistical framework, and our consideration of how to sample in a representative way, and meth-ods to get around cases where we cannot. The ex-act relationship to precision, recall etc. is the topic of current research. In the meantime we hope that the methods presented might advance understand-ing of effective evaluation methods in computa-tional linguistics.
Acknowledgments
World Health Organization for research support.
References
Argamon-Engelson, S. and Dagan, I. (1999). Committee-based sample selection for proba-bilistic classifiers. Journal of Artificial
Intelli-gence Research, 11:335–360.
Azar, E. E. (1982). Codebook of the Conflict and
Peace Databank. Center for International
De-velopment, University of Maryland.
Cowie, J. and Lehnert, W. (1996). Informa-tion extracInforma-tion. Communications of the ACM, 39(1):80–91.
Goldstein, J. S. (1992). A conflict-cooperation scale for WEIS events data. Journal of Conflict Resolution, 36(2).
Goldstein, J. S. and Freeman, J. R. (1990). Three-Way Street: Strategic Reciprocity in World Pol-itics. Chicago University Press.
Goldstein, J. S. and Pevehouse, J. C. (1997). Reciprocity, bullying and international conflict: Time-series analysis of the Bosnia conflict.
American Political Science Review, 91(3):515–
529.
Grishman, R. (1997). Information extraction: Techniques and challenges. In Pazienza, M. T., editor, Information Extraction: A Multidisci-plinary Approach to an Emerging Information
Technology, volume 1299 of Lecture Notes in
Artificial Intelligence, chapter 2, pages 10–27.
Springer Verlag.
King, G. and Lowe, W. (2002). An automated in-formation extraction tool for international con-flict data with performance as good as hu-man coders: A rare events evaluation design. http://gking.harvard.edu/infoex.pdf.
Lehnert, W. and Sundheim, B. (1991). A perfor-mance evaluation of text-analysis technologies.
AI Magazine, pages 81–95.
McClelland, C. (1978). World Event /
Interac-tion Survey (WEIS) 1966-1978. Inter-University
Consortium for Political and Social Research, University of Southern California.
Schrodt, P. A., Davis, S. G., and Weddle, J. L. (1994). Political science: KEDS — a program
for the machine coding of event data. Social
Science Computer Review, 12.
Schrodt, P. A. and Gerner, D. J. (1994). Validity assessment of a machine-coded event data set for the Middle East, 1982-92.American Journal of Political Science, 38(3).
Sundheim, B. (1992). Overview of the fourth mes-sage understanding evaluation and conference.
In Proceedings of the Fourth Message
Under-standing Conference, pages 3–22.
Sundheim, S., editor (1991). Proceedings of the
Third Message Understanding Conference, San