Mining the Gaps: Towards Polynomial Summarization
Marina Litvak
Sami Shamoon College of Engineering Beer Sheva, Israel
Natalia Vanetik
Sami Shamoon College of Engineering Beer Sheva, Israel
Abstract
The problem of text summarization for a collection of documents is defined as the problem of selecting a small subset of sentences so that the contents and mean-ing of the original document set are pre-served in the best possible way. In this paper we present a linear model for the
problem of text summarization1, where a
summary preserves the information cover-age as much as possible in comparison to the original document set. We reduce the problem of finding the best summary to the problem of finding the point on a con-vex polytope closest to the given hyper-plane, and solve it efficiently with the help of fractional (polynomial-time) linear pro-gramming. The experimental results show the superiority of our approach over most of the systems participating in the generic multi-document summarization task (Mul-tiLing) of the TAC 2011 competition.
1 Introduction
Automated text summarization is an active field of research in various communities like Informa-tion Retrieval (IR), Natural Language Processing (NLP), and Text Mining (TM).
Some authors reduce summarization to the maximum coverage problem (Takamura and Oku-mura, 2009; Gillick and Favre, 2009) that, de-spite a great performance, is known as
NP-hard (Khuller et al., 1999). Linear
Program-ming helps to find an accurate approximated so-lution to this problem and became very popular in summarization field in the last years (Gillick and Favre, 2009; Woodsend and Lapata, 2010; Hi-toshi Nishikawa and Kikui, 2010; Makino et al.,
1This work was partially funded by U.S. Department of Navy, Office of Naval Research.
2011). However, most mentioned works use ex-ponential number of constrains or Integer Linear Programming which is an NP-hard problem.
Trying to solve a trade-off between summary quality and time complexity, we propose a novel summarization model solving the approximated maximum coverage problem by linear program-ming in polynomial time. We measure
informa-tion coverage by terms2and strive to obtain a
sum-mary that preserves the optimal value of the cho-sen objective function as much as possible in com-parison to the original document. Various objec-tive functions combining different parameters like term’s position and its frequency are introduced and evaluated.
Our method ranks and extracts significant sen-tences into a summary and it can be generalized for both single-document and multi-document summarization. Also, it can be easily adapted to cross-lingual/multilingual summarization.
Formally speaking, in this paper we introduce (1) a novel text representation model expanding a classic Vector Space Model (Salton et al., 1975) to Hyperplane and Half-spaces, (2) re-formulated extractive summarization problem as an optimiza-tion task and (3) its soluoptimiza-tion using linear or quadratic programming. The main challenge of this paper is a new text representation model mak-ing possible to represent an exponential number of extracts without computing them explicitly, and finding the optimal one by simple minimizing a distance function in polynomial time.
2 Our Method
2.1 Definitions
We are given a set of sentencesS1, ...,Sn derived
from a document or a cluster of related documents. Meaningful words in these sentences are entirely described by termsT1, ...,Tm. Our goal is to find a
2normalized meaningful words
subsetSi1, ...,Sik consisting of sentences such that
(1) there are at most N terms in these sentences,
(2) term frequency is preserved as much as possi-ble w.r.t. the original sentence set, (3) redundant
information among k selected sentences is
mini-mized.
We use the standard sentence-term matrix,A=
(ai j)of sizem×n, for initial data representation,
where ai j =k if term Ti appears in the sentence
Sj precisely k times. Here, columns of A
de-scribe sentences and rows dede-scribe terms. Since we are not interested in redundant sentences, in the case of multi-document summarization, we can initially select meaningful sentences by clustering
all the columns as vectors inRnand choose a
sin-gle representative from each cluster. In this case
columns ofAdescribe representatives of sentence
clusters. The total number of words (term
appear-ances) in the document, denoted byS, can be
com-puted from the matrixAas
S=
∑
i
∑
jai j (1)
Example 1. Given the following text of n=3 sen-tences and m=5(normalized) terms:
S1=A fat cat is a cat that eats fat meat. S2=My cat eats fish but he is a fat cat.
S3=All fat cats eat fish and meat.
Matrix A corresponding to the text above has the following shape:
S1 S2 S3
T1=“fat”
T2=“cat” T3=“eat”
T4=“fish”
T5=“meat”
a11=2 a12=1 a13=1
a21=2 a22=2 a23=1
a31=1 a32=1 a33=1
a41=0 a42=1 a43=1
a51=1 a52=0 a53=1
where ai jare term counts. The total count of terms in this matrix is
S=
5
∑
i=13
∑
j=1ai j =16
Our goal is to find subseti1, ...,ikofA’s columns
so that the chosen submatrix represents the best possible summary under some constraints. Since it is hard to determine what is the best summary mathematically (this task is usually left to human experts), we wish to express summary quality as a linear function of the underlying matrix. We strive to find a summary that gives an optimal value once the function in question has been determined.
2.2 Text Preprocessing
In order to build the matrix and then the poly-tope model, one needs to perform the basic text preprocessing including sentence splitting and to-kenization. Also, additional steps like stopwords removal, stemming, synonym resolution, etc. may be performed for resource-rich languages. Since the main purpose of these methods is to reduce the matrix dimensionality, the resulted model will be more efficient.
2.3 Polytope as a document representation
We represent every sentence by a hyperplane, and all sentences derived from a document form a hy-perplane intersections (polytope). Then, all pos-sible extracts can be represented by subplanes of our hyperplane intersections and as such that are not located far from the boundary of the polytope. Intuitively, the boundary of the resulting polytope is a good approximation for extracts that can be generated from the given document. We view
ev-ery column of the sentence-term matrix as alinear
constraint representing a hyperplane inRmn. An
occurrence of termti in sentenceSj is represented
by variablexi j. The maximality constraint on the
number of terms in the summary can be easily ex-pressed as a constraint on the sum of these vari-ables.
Example 2. This example demonstrates variables corresponding to the5×3matrix A of Example 1.
S1 S2 S3
T1 T2
T3
T4 T5
x11 x12 x13 x21 x22 x23
x31 x32 x33
x41 x42 x43 x51 x52 x53
Every sentence in our document is a hyperlane
inRmn, defined with columns of Aand variables
representing terms in sentences:
A[][j] = [a1j, . . . ,am j]
xj= [x1j, . . . ,xm j]for all 1≤ j≤n
We define a system of linear inequalities
A[][j]·xT j =∑
m
i=1ai jxi j ≤
≤A[][j]·1T =∑mi=1ai j
(2)
Every inequality of this form defines a hyperplane
Hi and it lower half-space specified by equation
(2):
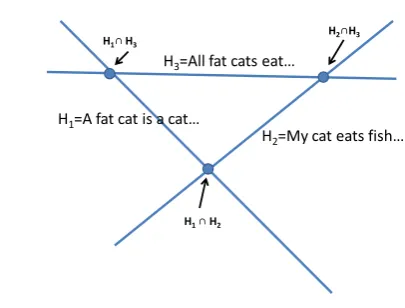
H3=All fat cats eat…
H1 ∩ H2
H1=A fat cat is a cat…
H2=My cat eats fish… H2∩H3
[image:3.595.76.279.67.221.2]H1∩ H3
Figure 1: Two-dimensional projection of hyperplane inter-section.
and with normal vectorn= (nxy)
nxy=
axy 1≤x≤m∧y= j
0 otherwise. (3)
To say that every term is either present or ab-sent from the chosen extract, we add constraints
0≤xi j≤1. Intuitively, entire hyperplaneHi and
therefore every point p∈Hi represents sentence
Si. Then a subset ofrsentences is represented by
intersection ofrhyperplanes.
Example 3. Sentence-term matrix A of Example 1 defines the following hyperplane equations.
H1: 2x11+2x21+x31+x51=2+2+1+1=6
H2: x12+2x22+x32+x42=5
H3: x13+x23+x33+x43+x53=5
Here, a summary consisting of the first and the second sentence is expressed by the intersection of hyperplanes H1 and H2. Figure 1 shows
how a two-dimensional projection of hyperplanes H1,H2,H3and their intersections look like.
2.4 Summary constraints
We express summarization constraints in the form
of linear inequalities inRmn, using the columns of
the sentence-term matrix A as linear constraints.
Maximality constraint on the number of terms in the summary can be easily expressed as a con-straint on the sum of term variablesxi j.
m
∑
i=1n
∑
j=1xi j ≤Tmax (4)
Example 4. Equation (4)for Example 1, Tmax=
11has the form
0≤xi j≤1,∀i,j ∑5i=1∑3j=1xi j≤11
Additionally, we may have constraints on the
maximalWmax number of words in the summary.
We take into account only words that remain in the text after stop-word removal and stemming. The difference between the number terms and the num-ber of words in a summary is that a single term can appear more than once in a sentence. Therefore, the total number of words in the text is expressed by summing up the elements of its term-count ma-trix. Therefore, maximality constraints for words are expressed by the following linear inequality.
m
∑
i=1n
∑
j=1ai jxi j≤Wmax (5)
Example 5. Equation (5) for the sentence-term matrix of Example 1 for Wmax=11has the form
2x11+2x21+x31+x51+ +x12+x22+2x32+x42+
+x13+x23+x33+x43+x53≤11
2.5 The polytope model
Having defined linear inequalities that describe each sentence in a document separately and the total number of terms in sentence subset, we can now look at them together as a system:
∑mi=1ai1xi1≤∑mi=1ai1
. . .
∑mi=1ainxin≤∑mi=1ain ∑mi=1∑
n
j=1xi j≤Tmax
∑mi=1∑
n
j=1ai jxi j≤Wmax
0≤xi j≤1
(6)
First n inequalities describe sentences S1, . . . ,Sn,
the next two inequalities describes constraints on the total number of terms and words in a sum-mary, and the final constraint determines upper and lower boundaries for all sentence-term vari-ables. Since every inequality in the system (6) is linear, the entire system describes a convex
poly-hedron inRmn, which we denote by P. Faces of
Pare determined by intersections of hyperplanes
defined in (6).
2.6 Objectives and summary extraction
We assume here that the surface of the polyhedron
P is a suitable representation of all the possible
sentence subsets (its size, of course, is not
polyno-mial inmandnsince the number of vertices ofP
can reachO(2n)). Fortunately, we do not need to
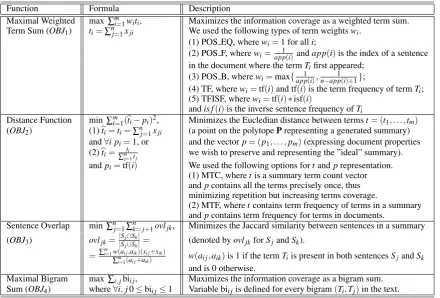
[image:3.595.355.472.430.515.2]Function Formula Description
Maximal Weighted max ∑mi=1witi, Maximizes the information coverage as a weighted term sum. Term Sum (OBJ1) ti=∑nj=1xji We used the following types of term weightswi.
(1) POS EQ, wherewi=1 for alli;
(2) POS F, wherewi=app1(i)andapp(i)is the index of a sentence in the document where the termTifirst appeared;
(3) POS B, wherewi=max{app1(i),n−app1(i)+1};
(4) TF, wherewi=tf(i)and tf(i)is the term frequency of termTi; (5) TFISF, wherewi=tf(i)∗isf(i)
andis f(i)is the inverse sentence frequency ofTi Distance Function min∑mi=1(bti−pi)
2, Minimizes the Eucledian distance between termst= (t 1, . . . ,tm) (OBJ2) (1)bti=ti=∑
n
j=1xji (a point on the polytopePrepresenting a generated summary) and∀i pi=1, or and the vectorp= (p1, . . . ,pm)(expressing document properties (2)bti=
ti
∑mj=1tj we wish to preserve and representing the ”ideal” summary). andpi=tf(i) We used the following options fortandprepresentation.
(1) MTC, wheretis a summary term count vector andpcontains all the terms precisely once, thus minimizing repetition but increasing terms coverage.
(2) MTF, wheretcontains term frequency of terms in a summary andpcontains term frequency for terms in documents.
Sentence Overlap min∑nj=1∑nk=j+1ovljk, Minimizes the Jaccard similarity between sentences in a summary (OBJ3) ovljk=|
Sj∩Sk|
|Sj∪Sk|= (denoted byovljkforSjandSk).
=∑
m
i=1w(ai j,aik)(xi j+xik)
∑mi=1(ai j+aik) w(ai j,aik)is 1 if the termTiis present in both sentencesSjandSk and is 0 otherwise.
[image:4.595.81.522.61.359.2]Maximal Bigram max ∑i,jbii j, Maximizes the information coverage as a bigram sum. Sum (OBJ4) where∀i,j0≤bii j≤1 Variable bii jis defined for every bigram(Ti,Tj)in the text.
Table 1: Objective functions for summarization using polytope model.
the point onPthat optimizes the chosen objective
function. Table 1 contains four different objective
functions3that we used for summarization, along
with descriptions of the changes in the model that were required for each function.
Since the LP method not only finds the minimal distance but also presents an evidence to that min-imality in the form of a pointx= (xi j), we use the point’s data to find what sentences belong to the chosen summary. We check which equations of
Hi the pointx satisfies as equalities. If an
equal-ity holds,xlies onHiand therefore the sentenceSi
is contained in the summary. This test is
straight-forward and takesO(mn)time. In a case of
insuf-ficient summary length, the sentences nearest to
the pointxare extracted to a summary in a greedy
manner.
3 Experiments
In order to evaluate the quality of our approach, we compared our approach to multiple summa-rizers participated in the generic multi-document summarization task of the TAC 2011 competi-tion (Giannakopoulos et al., 2011) and human
3Since our approach is unsupervised, there is no possibil-ity and meaning to use ROUGE, that needs Gold Standard, as an objective.
performance as well. Our software was
imple-mented in Java using lpsolve (Berkelaar, 1999)4.
We used the following objective functions, de-scribed in Table 1.
(1) Maximal weighted term sum OBJ1weight type,
where weight type is one of POS EQ, POS F,
POS B, TF, TFISF;
(2) Minimal distance OBJ2vector type, where
vector type is either MTC (Maximal Term Cov-erage) or MTF (Maximal Term Frequency);
(3) Minimal sentence overlapOBJ3;
(4) Maximal bigram sumOBJ4.
We conducted the experiments on the MultiL-ing 2011 (Giannakopoulos et al., 2011) English dataset. MultiLing dataset consists of 10 docu-ment sets, 10 docudocu-ments each one, in seven lan-guages. The original news articles in English were
taken from WikiNews5, organized into 10 sets,
and then summarized. According to the MultiL-ing summarization task, all systems must generate summaries in size of 250 words at most. Eight sys-tems (ID1-ID8) participated in the pilot and com-pared to the global baseline (ID9) and the global topline (ID10) systems. Systems A,B and C
de-4The software is available upon request.
note summaries manually created by human ex-perts. The choice of this dataset is argumented by future plans to adapt and evaluate the introduced system to multiple languages.
The automatic summarization evaluation pack-age, ROUGE (Lin, 2004), is used to evaluate the effectiveness of our approach vs. 10 summariz-ers participated in the MultiLing pilot of the TAC 2011 competition. For fair comparison, only first
250 words6 were considered in ROUGE
statis-tics. The recall scores of ROUGE-N for N ∈
{1,2,3,4}, ROUGE-W-1.2, and ROUGE-SU4
which are based on N-gram, Weighted Longest
Common Subsequence (WLCS), and Skip-bigram plus unigram, with maximum skip-distance of 4, matching between system summaries and refer-ence summaries, respectively, are reported in Ta-ble 2 below.
3.1 Experimental Results
As it can be seen from Table 2, our model using
unweighted term sum (OBJ1POS EQ) as an objective
function outperforms most of the systems – 6 sys-tems in terms of 1, 2,
ROUGE-SU4 and ROUGE-W-1.2, and 8 systems in terms
of ROUGE-3 and ROUGE-4. Conversely to our
expectations, adding any type of weights toOBJ1
reduces its performance. Minimizing repetition
while increasing terms coverage (OBJ2MTC) shares
the same rank withOBJ1POS EQ for most ROUGE
metrics. Minimizing distance to a document term
frequency vector (OBJ2MT F) performs worse – it
outperforms 3, 4, 5, 6, 5 and 3 systems in terms of 1, 2, 3,
ROUGE-4, ROUGE-SU4 and ROUGE-W-1.2, respectively.
Sentence overlap (OBJ3) and maximal bigram sum
(OBJ4) have very close scores, outperforming 3,
5, 5, 6, 5 and 3 systems in terms of ROUGE-1,
ROUGE-2, ROUGE-3, ROUGE-4, ROUGE-SU4
and ROUGE-W-1.2, respectively. Generally,
opti-mizing the most of introduced functions generates the near-quality summaries. All functions perform
better then the baseline (ID9) system.7
4 Conclusions and Future Work
In this paper we present a linear programming model for the problem of extractive
summariza-6ROUGE.pl -a -x -2 4 -u -c 95 -e data -r 1000 -n 4 -f A -p 0.5 -t 0 -d -l 250
7We did not perform tests of statistical significance due to too many comparisons (10 systems vs. 10 objective func-tions), leaving it as a future work.
tion. We represent the document as a set of inter-secting hyperplanes. Every possible summary of a document is represented as an intersection of two or more hyperlanes. We consider the summary to be the best if the optimal value of objective func-tion is preserved during summarizafunc-tion, and trans-late the summarization problem into a problem of finding a point on a convex polytope which is the closest to the hyperplane describing the ”ideal” summary. We introduce multiple objective func-tions describing the distance between a summary (a point on a convex polytope) and the best sum-mary (the hyperplane).
Since linear programming problem can be solved in polynomial time (see (Karmarkar, 1984), (Khachiyan, 1996; Khachiyan and Todd, 1993)), the time complexity of our approach is polynomial (quadratic, being more precise).
The results of experiments show that our method outperforms most of the systems partici-pated in the MultiLing pilot in terms of various ROUGE metrics. In future, we intend to (1) im-prove the system’s performance by introducing more objective functions and their combinations, (2) adapt our system to multiple languages, and (3) extend our model to query-based summarization.
Acknowledgments
Authors thank Igor Vinokur for implementing the introduced approach and performing experiments.
REFERENCES
Berkelaar, M. (1999). lp-solve free
soft-ware. http://lpsolve.sourceforge.
net/5.5/.
Giannakopoulos, G., El-Haj, M., Favre, B., Lit-vak, M., Steinberger, J., and Varma, V. (2011). TAC 2011 MultiLing Pilot Overview. InTAC 2011: Proceedings of Text Analysis Conference.
Gillick, D. and Favre, B. (2009). A Scalable
Global Model for Summarization. In
Pro-ceedings of the NAACL HLT Workshop on In-teger Linear Programming for Natural Lan-guage Processing, pages 10–18.
Hitoshi Nishikawa, Takaaki Hasegawa, Y. M. and
Kikui, G. (2010). Opinion Summarization
with Integer Linear Programming Formula-tion for Sentence ExtracFormula-tion and Ordering. In
system rouge-1 system rouge-2 system rouge-3 system rouge-4 system rouge-SU4 system rouge-W-1.2
A 0.6690 A 0.4725 A 0.4169 A 0.3951 A 0.4938 A 0.2205
C 0.6519 C 0.4578 C 0.4050 C 0.3851 C 0.4812 C 0.2103
B 0.6457 B 0.4388 B 0.3797 B 0.3589 B 0.4636 B 0.2102
ID10 0.5269 ID10 0.2560 ID10 0.1743 ID10 0.1349 ID10 0.2754 ID10 0.1458
ID2 0.4641 ID2 0.1715 ID3 0.0932 ID3 0.0639 ID2 0.2024 ID2 0.1283
ID4 0.4436 ID3 0.1655 OBJPOS EQ1 0.0868 OBJ1POS EQ 0.0636 ID3 0.1941 ID4 0.1227
ID3 0.4266 ID4 0.1507 ID2 0.0849 ID2 0.0551 ID4 0.1900 ID3 0.1199
OBJ1POS EQ 0.4166 OBJ1POS EQ 0.1463 ID4 0.0784 OBJPOS B
1 0.0546 OBJ
POS EQ
1 0.1819 OBJ
POS EQ
1 0.1140
OBJMTC
2 0.4143 OBJ
MTC
2 0.1426 OBJ
MTC
2 0.0776 OBJ
MTC
2 0.0545 OBJ
MTC
2 0.1777 OBJ
MTC
2 0.1136
ID5 0.4068 ID5 0.1343 OBJPOS B
1 0.0744 ID4 0.0518 ID5 0.1720 ID1 0.1113
ID1 0.4029 OBJPOS B
1 0.1293 OBJ
T FISF
1 0.0660 OBJ
MT F
2 0.0437 OBJ
POS B
1 0.1652 ID5 0.1111
OBJT FISF
1 0.3959 OBJ1T FISF 0.1266 ID5 0.0655 OBJ1T F 0.0437 OBJ1T FISF 0.1624 ID8 0.1098 OBJPOS B
1 0.3932 OBJ4 0.1238 OBJ3 0.0649 OBJ
T FISF
1 0.0436 OBJ3 0.1602 OBJ
POS B
1 0.1089
ID7 0.3911 OBJ3 0.1236 OBJ4 0.0649 OBJ3 0.0435 OBJ4 0.1600 OBJ3 0.1079
OBJ3 0.3907 ID8 0.1230 OBJMT F2 0.0646 OBJ4 0.0435 OBJ2MT F 0.1589 OBJ T FISF
1 0.1075
OBJ4 0.3894 OBJMT F
2 0.1222 OBJT F1 0.0646 OBJ1POS F 0.0433 OBJ1T F 0.1589 OBJ4 0.1072 OBJMT F
2 0.3874 OBJ
T F
1 0.1222 OBJ
POS F
1 0.0641 ID5 0.0429 ID1 0.1588 OBJ
MT F
2 0.1067
OBJT F
1 0.3874 OBJ1POS F 0.1216 ID8 0.0613 ID8 0.0409 OBJ1POS F 0.1587 OBJPOS F1 0.1063 OBJPOS F
1 0.3872 ID1 0.1191 ID1 0.0552 ID1 0.0367 ID8 0.1579 ID7 0.1038
ID8 0.3860 ID9 0.1053 ID6 0.0489 ID6 0.0331 ID9 0.1444 OBJT F
1 0.1000
ID9 0.3737 ID6 0.1043 ID9 0.0455 ID9 0.0277 ID6 0.1434 ID9 0.0983
ID6 0.3543 ID7 0.0923 ID7 0.0301 ID7 0.0165 ID7 0.1423 ID6 0.0948
Table 2: Evaluation results. MultiLing 2011. English.
Karmarkar, N. (1984). New polynomitime
al-gorithm for linear programming.
Combina-torica, 4:373–395.
Khachiyan, L. G. (1996). Rounding of
poly-topes in the real number model of
computa-tion. Mathematics of Operations Research,
21:307–320.
Khachiyan, L. G. and Todd, M. J. (1993). On the complexity of approximating the maximal
in-scribed ellipsoid for a polytope.
Mathemati-cal Programming, 61:137–159.
Khuller, S., Moss, A., and Naor, J. S. (1999). The
budgeted maximum coverage problem.
Infor-mation Precessing Letters, 70(1):39–45.
Lin, C.-Y. (2004). Rouge: A package for
auto-matic evaluation of summaries. In
Proceed-ings of the Workshop on Text Summarization Branches Out (WAS 2004), pages 25–26.
Makino, T., Takamura, H., and Okumura, M. (2011). Balanced coverage of aspects for text
summarization. InTAC ’11: Proceedings of
Text Analysis Conference.
Salton, G., Yang, C., and Wong, A. (1975). A vector-space model for information retrieval.
Communications of the ACM, 18.
Takamura, H. and Okumura, M. (2009). Text sum-marization model based on maximum
cov-erage problem and its variant. In EACL
’09: Proceedings of the 12th Conference of the European Chapter of the Association for Computational Linguistics, pages 781–789.
Woodsend, K. and Lapata, M. (2010). Automatic
Generation of Story Highlights. InACL ’10:
Proceedings of the 48th Annual Meeting of the Association for Computational