Feature Selection and Feature Extract ion for Text
Categorization
David
D.
Lewis
Center for Information and Language Studies
University of Chicago
Chicago,
IL
60637
ABSTRACT
The effect of selecting varying numbers and kinds of fea- tures for use in predicting category membership was inves- tigated on the Reuters and MUC-3 text categorization data sets. Good categorization performance was achieved using a statistical classifier and a proportional assignment strat- egy. The optimal feature set size for word-based indexing was found to be surprisingly low (10 to 15 features) despite the large training sets. The extraction of new text features by syntactic analysis and feature clustering was investigated on the Reuters data set. Syntactic indexing phrases, clus- ters of these phrases, and clusters of words were all found to provide less effective representations than individual words.
1.
Introduction
Text categorization-the automated assigning of natural language texts t o predefined categories based on their content-is a task of increasing importance. Its appli- cations include indexing texts to support document re- trieval [I], extracting data from texts [2], and aiding hu- mans in these tasks.
The indexing language used to represent texts influences how easily and effectively a text categorization system can be built, whether the system is built by human engi- neering, statistical training, or a combination of the two. The simplest indexing languages are formed by treating each word as a feature. However, words have properties, such as synonymy and polysemy, that make them a less than ideal indexing language. These have motivated at- tempts t o use more complex feature extraction methods in text retrieval and text categorization tasks.
If a syntactic parse of text is available, then features can be defined by the presence of two or more words in particular syntactic relationships. We call such a fea- ture a syntactic indexing phrase. Another strategy is t o use cluster analysis or other statistical methods t o de- tect closely related features. Groups of such features can then, for instance, be replaced by a single feature corre- sponding t o their logical or numeric sum. This strategy is referred to as term clustering.
Syntactic phrase indexing and term clustering have op-
posite effects on the properties of a text representation, which led us t o investigate combining the two techniques [3]. However, the small size of standard text retrieval test collections, and the variety of approaches available for query interpretation, made it difficult t o study purely representational issues in text retrieval experiments. In this paper we examine indexing language properties us- ing two text categorization d a t a sets. We obtain much clearer results, as well as producing a new text catego- rization method capable of handing multiple, overlap- ping categories.
2.
Data Sets and Tasks
Our first d a t a set was a set of 21,450 Reuters newswire stories from the year 1987 [4]. These stories have been manually indexed using 135 financial topic categories, t o support document routing and retrieval. Particular care was taken in assigning categories [I]. All stories dated April 7, 1987 and earlier went into a set of 14,704 training documents, and all stories from April 8, 1987 or later went into a test set of 6,746 documents.
The second data set consisted of 1,500 documents from the U S . Foreign Broadcast Information Service (FBIS) that had previously been used in the MUC-3 evaluation of natural language processing systems [2]. The docu- ments are mostly translations from Spanish t o English, and include newspaper stories, transcripts of broadcasts, communiques, and other material.
The MUC-3 task required extracting simulated database records ("templates") describing terrorist incidents from these texts. Eight of the template slots had a limited number of possible fillers, so a simplification of the MUC- 3 task is t o view filling these slots as text categorization. There were 88 combinations of these 8 slots and legal fillers for the slots, and each was treated as a binary cat- egory. Other text categorization tasks can be defined for the MUC-3 data (see Riloff and Lehnert in this volume).
nizers. We used the other 1,200 MUC-3 training docu- ments (encoded by 16 different MUC-3 sites) as our cat- egorization training documents, Category assignments should be quite consistent on our test set, but less so on our training set.
3.
Categorization Method
The statistical model used in our experiments was pro- posed by Fuhr [5] for probabilistic text retrieval, but the adaptation t o text categorization is straightforward. Figure 1 shows the formula used. The model allows the possibility that the values of the binary features for a document is not known with certainty, though that as- pect of the model was not used in our experiments.
3.1.
Binary Categorization
In order t o compare text categorization output with an existing manual categorization we must replace probabil- ity estimates with explicit binary category assignments. Previous work on statistical text categorization has often ignored this step, or has not dealt with the case where documents can have zero, one, or multiple correct cate- gories.
Given accurate estimates of P ( C j
=
11 Dm), decision the- ory tells us that the optimal strategy, assuming all errors have equal cost, is t o set a single threshold p and assign Cj t o a document exactly when P ( C j = llD,)>=
p [6].However, as is common in probabilistic models for text classification tasks, the formula in Figure 1 makes as-
sumptions about the independence of probabilities which do not hold for textual data. The result is that the esti- mates of P ( C j
=
llDm) can be quite inaccurate, as well as inconsistent across categories and documents.We investigated several strategies for dealing with this problem and settled on proportional assignment [4]. Each category is assigned to its top scoring documents on the test set in a designated multiple of the percentage of documents it was assigned t o on the training corpus. Proportional assignment is not very satisfactory from a theoretical standpoint, since the probabilistic model is supposed to already take into account the prior prob- ability of a category. In tests the method was found to perform well as a standard decision tree induction method, however, so it is at least a plausible strategy. We are continuing to investigate other approaches.
3.2. Feature Selection
A primary concern of ours was t o examine the effect of feature set size on text categorization effectiveness. All potential features were ranked for each category by expected mutual information
[7] between assignment of
0 WORDS-DF2: Starts with all words tokenized by
parts. Capitalization and syntactic class ignored. Stopwords discarded based on syntactic tags. To- kens consisting solely of digits and punctuation re- moved. Words occurring in fewer than 2 training documents removed. Total terms: 22,791.
0 WC-MUTINFO-135: Starts with WORDS-DF2,
and discards words occurring in fewer than 5 or more than 1029 (7%) training documents. RNN clustering used 135 metafeatures with value equal to mutual information between presence of the word and presence of a manual indexing category. Result is 1,442 clusters and 8,506 singlets, for a total of 9,948 terms.
0 PHRASE-DF2: Starts with all simple noun phrases
bracketed by parts. Stopwords removed from phrases based on tags. Single word phrases dis- carded. Numbers replaced with the token NUM- BER. Phrases occurring in fewer than 2 training documents removed. Total terms: 32,521.
0 PC-W-GIVEN-C-44: Starts with PHRASE-DF2.
Phrases occurring in fewer than 5 training docu- ments removed. RNN clustering uses 44 metafea- tures with value equal t o our estimate of P ( W =
1IC
=
1) for phrase W and category C . Result is 1,883 clusters and 1,852 singlets, for a total of 3,735 terms.Figure 2: Summary of indexing languages used with the Reuters data set.
that feature and assignment of that category. The top
k
features for each category were chosen as its feature set, and different values ofk
were investigated.4. Indexing Languages
We investigated phrasal and term clustering methods only on the Reuters collection, since the smaller amount of text made the MUC-3 corpus less appropriate for clus- tering experiments. For the MUC-3 data set a single in- dexing language consisting of 8,876 binary features was tested, corresponding t o all words occurring in 2 or more training documents. The original MUC-3 text was all capitalized. Stop words were not removed.
We estimate P ( C j = llDm) by:
P ( C j = 1)
x
(
p(wi= llcj
= 1) x P(Wi = IlDm)+
P(Wi = OlCj = 1) x P(Wi = OjD,)i P ( W j = 1) P(Wi = 0)
Explanation:
P ( C j = llD,) is the probability that category C j is assigned to document Dm. Estimating this probability is the goal of the categorization procedure. The index j ranges over categories to be assigned.
P ( C j = 1) is the prior probability that category C j is assigned t o a document, in the absence of any information about the contents of the particular document.
P(Wj = 1) is the prior probability that feature Wi is present in a randomly selected document. P(Wi = 0)
=
1-
P(Wi = 1). The index i ranges over the set of predictor features for categoryq.
P(Wi = ljCj = 1) is the probability that feature Wj is assigned t o a document given that we know category Cj is assigned t o that document. P(Wi
=
OICj=
1) is 1-
P(Wi = lICj=
1).P(Wi
=
llDm) is the probability that feature Wi is assigned t o document Dm.All probabilities were estimated from the training corpus using the "add one" adjustment (the Jeffreys prior).
Figure 1: Probabilistic model used for text categorization.
that were tagged as function words were removed from 5 .
Evaluation
phrases, and all items tagged as numbers were replaced
The effectiveness measures used were recall (number of with the NUMBER' We wed the parts seg- categories correctly assigned divided by the total num- mentation t o define the set of words indexed on.
ber of categories that should be assigned) and precision Reciprocal nearest neighbor clustering was used for clus- (number ofcategorie~ correctly assigned divided by total tering features. An RNN cluster consists of two items, number of categories assigned).
each of which is the nearest neighbor of the other ac- cording to the similarity metric in use. Therefore, not all items are clustered. If this stringent clustering strat- egy does not bring together closely related features, it is unlikely that any clustering method using the same metafeatures would do so.
Clustering features requires defining a set of metafea- tures on which the similarity of the features will be judged. We experimented with forming clusters from words under three metafeature definitions, and from phrases under eight metafeature definitions 141. Metafea- tures were based on presence or absence of features in documents, or on the strength of association of features with categories of documents. In all cases, similarity between metafeature vectors was measured using the co- sine correlation. The sets of clusters formed were exam- ined by the author, and categorization experiments were run with the three sets of word clusters and with the two sets of phrase clusters that appeared best. Figure 2 summarizes the properties of the most effective version of each representation type used in the experiments on the Reuters data.
For a set of k categories and d documents a total of n = kd categorization decisions are made. We used mi- croaveraging, which considers all kd decisions as a single group, t o compute average effectiveness 191. The propor- tionality parameter in our categorization method was varied t o show the possible tradeoffs between recall and precision. As a single summary figure for recall precision curves we took the breakeven point, i.e. the highest value (interpolated) at which recall and precision are equal.
6.
Results
We first looked a t effectiveness of proportional assign- ment with word-based indexing languages. Figure 3 shows results for the best feature set sizes found: 10 features on Reuters and 15 features on MUC-3. A breakeven point of 0.65 on Reuters and 0.48 on MUC-3 is reached. For comparison, the operational AIR/X system uses both rule-based and statistical techniques to achieve a microaveraged breakeven point of approximately 0.65 in indexing a physics database [lo].
Prec.
.8
.6
.4
.2
0
l i l l I
Reuters 0 MUC-3
0 .2 .4 .6 .8 1
Recall
Figure 3: Microaveraged recall and precision on Reuters (w/ 10 features) and MUC-3 ( w / 15 features) test sets.
a different, and possibly easier, testset drawn f r o m the Reuters d a t a [1]. This level of performance, the result of a 9.5 person-year effort, is an admirable target for learning-based systems to shoot for.
Comparison with published results on MUC-3 are diffi- cult, since we simplified the complex MUC-3 task. How- ever, in earlier experiments using the official MUC-3 test- set and scoring, proportional assignment achieved per- formance toward but within the low end of official MUC- 3 scores achieved by a variety of N L P methods. This is despite being limited in m o s t cases to 50% the score achievable by m e t h o d s t h a t a t t e m p t e d cross-referencing I n ] .
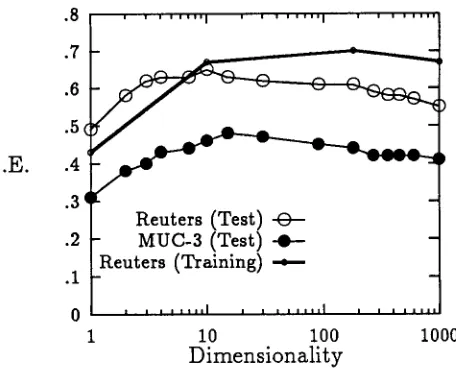
6.1. F e a t u r e S e l e c t i o n
Figure 4 summarizes our d a t a on feature set size. We show the breakeven point reached for categorization runs with various size sets of words, again on b o t h the Reuters and MUC-3 d a t a sets. T h e results exhibit the classic peak associated with the "curse of dimensionality." T h e surprise is the small n u m b e r of features found to be op- timal. W i t h 14,704 and 1,300 training examples, peaks of 10 and 15 features respectively are smaller t h a n one would expect based on sample size considerations.
Overfitting, i.e. training a model on accidental as well as systematic relationships between feature values and
.8
.7
.6
.5
B .E. .4
. 3 (
. 2
.1
O I
. , , , , , , , [ . , , , , . , , [ , , , , . , . .
Figure 4: Microaveraged breakeven points for feature sets of words on Reuters a n d MUC-3 test sets, and on Reuters training set.
category m e m b e r s h i p , was one possible villain [6]. We checked for overfitting directly by testing the induced classifiers on the training set. T h e thicker line in Figure 4 shows the effectiveness of the Reuters classifers when tested on the 14,704 stories used to train them. Surpris- ingly, effectiveness reaches a peak not m u c h higher t h a n t h a t achieved on the unseen test set, and even drops off when a very large feature set is used. A p p a r e n t l y our probabilistic model is sufficiently constrained t h a t , while overfitting occurs, its effects are limited3
Another possible explanation for the decrease in effec- tiveness with increasing feature set size is t h a t the as- sumptions of the probabilistic model are increasingly vi- olated. Fuhr's model assumes t h a t the probability of observing a word in a d o c u m e n t is independent of the probability of observing a n y other word in the document, b o t h for d o c u m e n t s in general and for d o c u m e n t s known to belong to particular categories. T h e n u m b e r of oppor- tunities for groups of dependent features to be selected as predictor features for the same category increases as the feature set size grows.
Finally, since features with a higher value on expected m u t u a l information are selected first, we intuitively ex- pect features with lower ratings, and thus a p p e a r i n g only in the larger feature sets, to simply be worse features. This intuition is curiously hard to justify. Any feature has some set of conditional and uncondltionM probabili- ties and, if the assumptions of the statistical model hold,
1 W e h a v e n o t y e t m a d e t h i s t e s t o n t h e M U C - 3 d s t a s e t .
[image:4.612.337.565.42.228.2] [image:4.612.67.310.45.273.2]Prec.
.8
.6
.4
.2
0 I I I
0 .2 .4 .6
Recall
I I
words word clusters 0
phrases © clusters [
.8 1
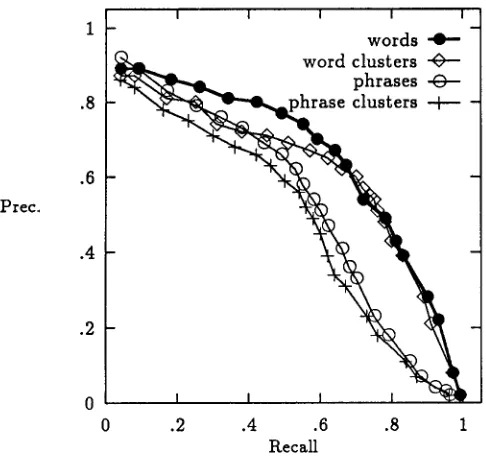
Figure 5: Microaveraged recall and precision on Reuters test set for W O R D S - D F 2 words (10 features), WC- MUTINFO-135 word clusters (10 features), P H R A S E - DF2 phrases (180 features), and PC-W-GIVEN-C-44 phrase clusters (90 features).
will be used in an appropriate fashion. It m a y be t h a t the inevitable errors in estimating probabilities from a sample are more harmful when a feature is less strongly associated with a category.
6.2. F e a t u r e E x t r a c t i o n
The best results we obtained for each of the four ba- sic representations on the Reuters test set are shown in Figure 5. Individual terms in a phrasal representation have, on the average, a lower frequency of appearance than terms in a word-based representation. So, not sur- prisingly, effectiveness of a phrasal representation peaks at a much higher feature set size (around 180 features) than t h a t of a word-based representation (see Figure 6). More phrases are needed simply to make any distinc- tions among documents. Maximum effectiveness of the phrasal representation is also substantially lower than that of the word-based representation. Low frequency and high degree of s y n o n y m y outweigh the advantages phrases have in lower ambiguity.
Disappointingly, as shown in Figure 5, t e r m cluster- ing did not significantly improve the quality of either a word-based or phrasal representation. Figure 7 shows some representative PC-W-GIVEN-C-44 phrase clusters.
.8
.7
.6
. 5 1
B.E. .4
.3
.2'
.1
0 1
i i i i , v l l I i i i I l l l l I I I I I l l l l '
words phrases 0
, i , , , i , I , i , , , i , * I I I I I I l l
10 100 1000
Dimensionality
Figure 6: Microaveraged breakeven point for various sized feature sets of words and phrases on Reuters test set.
(The various abbreviations and other oddities in the phrases were present in the original text.) Many of the relationships captured in the clusters appear to be acci- dental rather than the systematic semantic relationships hoped for.
W h y did phrase clustering fail? In earlier work on the CACM collection [3], we identified lack of training d a t a as a primary impediment to high quality cluster forma- tion. T h e Reuters corpus provided approximately 1.5 million phrase occurrences, a factor of 25 more than CACM. Still, it remains the case t h a t the a m o u n t of d a t a was insufficient to measure the distributional properties
'8 investors service inc, < amo > N U M B E R accounts, slate regulators N U M B E R elections, N U M B E R engines federal reserve chairman paul volcker,
private consumption
additional N U M B E R dlrs, america > canadian bonds, cme board
denmark N U M B E R , equivalent price
fund government-approved equity investments, fuji bank led
its share price, new venture new policy, representative offices same-store sales, santa rosa
Figure 7: Some representative PC-W-GIVEN-C-44 clus- ters.
[image:5.612.67.310.44.272.2] [image:5.612.333.567.49.238.2]of m a n y phrases encountered.
The definition of metafeatures is a key issue to recon- sider. Our original reasoning was that, since phrases have low frequency, we should use metafeatures corre- sponding to bodies of text large enough that we could expect cooccurrences of phrases within them. T h e poor quality of the clusters formed suggests that this ap- proach is not effective. T h e use of such coarse-grained metafeatures simply gives m a n y opportunities for acci- dental cooccurrences to arise, without providing a suffi- cient constraint on the relationship between phrases (or words). T h e fact that clusters captured few high quality semantic relationships, even when an extremely conser- vative clustering m e t h o d was used, suggests t h a t using other clustering methods with the same metafeature def- initions is not likely to be effective.
Finally, while phrases are less ambiguous than words, they are not all good content indicators. Even restrict- ing phrase formation to simple noun phrases we see a substantial number of poor content indicators, and the impact of these are compounded when they are clustered with better content indicators.
7.
F u t u r e Work
A great deal of research remains in developing text cat- egorization methods. New approaches to setting appro- priate category thresholds, estimating probabilities, and selecting features need to be investigated. For practical systems, combinations of knowledge-based and statisti- cal approaches are likely to be the best strategy.
On the text representation side, we continue to believe that forming groups of syntactic indexing phrases is an effective route to b e t t e r indexing languages. We be- lieve the key will be supplementing statistical evidence of phrase similarity with evidence from thesauri and other knowledge sources, along with using metafeatures which provide tighter constraints on meaning. Cluster- ing of words and phrases based on syntactic context is a promising approach (see Strzalkowski in this volume). Pruning out of low quality phrases is also likely to be important.
8 . S u m m a r y
We have shown a statistical classifier trained on manu- ally categorized documents to achieve quite effective per- formance in assigning multiple, overlapping categories to documents. We have also shown, via studying text cate- gorization effectiveness, a variety of properties of index- ing languages t h a t are difficult or impossible to measure directly in text retrieval experiments, such as effects of feature set size and performance of phrasal representa-
tions in isolation from word-based representations.
Like text categorization, text retrieval is a text classifi- cation task. T h e results shown here for text categoriza- tion, in particular the ineffectiveness of t e r m clustering with coarse-grained metafeatures, are likely to hold for text retrieval as well, though further experimentation is necessary.
9.
A c k n o wl e dg m e n t s
T h a n k s to Bruce Croft, Paul Utgoff, Abe Bookstein and Marc Ringuette for helpful discussions. This research was supported at U Mass Amherst by grant AFOSR- 90-0110, and at the U Chicago by Ameritech. Many thanks to Phil Hayes, Carnegie Group, and Reuters for making available the Reuters data, and to Ken Church and A T & T for making available parts.
References
1. Hayes, P. and Weinstein, S. CONSTRUE/TIS: a system for content-based indexing of a database of news stories.
In IAAIogO, 1990.
2. Sundheim, B., ed. Proceedings of the Third Message Un- derstanding Evaluation and Conference, Morgan Kauf- mann, Los Altos, CA, May 1991.
3. Lewis, D. and Croft, W. Term clustering of syntactic phrases. In ACM SIGIR-90, pp. 385-404, 1990. 4. Lewis, D. Representation and Learning in Information
Retrieval. PhD thesis, Computer Science Dept.; Univ. of Mass.; Amherst, MA, 1992. Technical Report 91-93. 5. Fuhr, N. Models for retrieval with probabilistic index- ing. Information Processing and Management, 25(1):55- 72, 1989.
6. Duda, It. and Hart, P. Pattern Classification and Scene Analysis. Wiley-Interscience, New York, 1973.
7. Hamming, It. C o d i n g and Information Theory.
Prentice-Hall, Englewood Cliffs, N J, 1980.
8. Church, K. A stochastic parts program and noun phrase parser for unrestricted text. In Second Conference on Applied NLP, pp. 136-143, 1988.
9. Lewis, D. Evaluating text categorization. In Speech and
Natural Language Workshop, pp. 312-318, Feb. 1991. 10. Fuhr, N., et ai. A I R / X - - a rule-based multistage index-
ing system for large subject fields. In RIAO 91, pp. 606-623, 1991.
11. Lewis, D. Data extraction as text categorization: An ex- periment with the MUC-3 corpus. In Proceedings MUC-
3, May 1991.