Clinical Epidemiology
Dove
press
O R I G I N A L R E S E A R C H open access to scientific and medical research Open Access Full Text Article
Time trends in the prescription of statins for the
primary prevention of cardiovascular disease in
the United Kingdom: a cohort study using The
Health Improvement Network primary care data
Aidan G O’Keeffe1
Irwin Nazareth2
Irene Petersen2
1Department of Statistical Science, 2Department of Primary Care and
Population Health, University College London, London, UK
Background: Statins are widely prescribed for the primary prevention of cardiovascular disease. Guidelines exist for statin prescriptions, but there is little recent analysis concerning prescription trends over time and how these vary with respect to demographic variables.
Methods and results:Using The Health Improvement Network primary care database, statin therapy initiation and statin prescription prevalence rates were calculated using data from 7,027,711 individuals across the UK for the years 1995 to 2013, overall and stratified by sex, age group, and socioeconomic deprivation level (Townsend score). Statin therapy initiation rates rose sharply from 1995 (0.51 per 1,000 person-years) up to 2006 (19.83 per 1,000 person-years) and thereafter declined (10.76 per 1,000 person-years in 2013). Males had higher initiation rates than females and individuals aged 60–85 years had higher initiation rates than younger or more elderly age groups. Initiation rates were slightly higher as social deprivation level increased, after accounting for age and sex. Prescription prevalence increased sharply from 1995 (2.36 per 1,000 person-years) to 2013 (128.03 per 1,000 person-years) with males generally having a higher prevalence rate, over time, than females. Prevalence rates over time were generally higher for older age groups but were similar with respect to social deprivation level.
Conclusion: The uptake of statins within UK primary care has increased greatly over time with statins being more commonly prescribed to older patients in general and, in recent years, males appear to have been prescribed statins at higher rates than females. After accounting for age and sex, the statin therapy initiation rate increases with the level of social deprivation.
Keywords: cardiovascular disease, primary prevention, statin therapy, time trend, United Kingdom
Introduction
Statins – a large class of cholesterol-lowering drugs – are widely prescribed for the primary prevention of cardiovascular disease (CVD).1,2 Since the 1990s, a number of
clinical trials and large-scale studies have demonstrated the effectiveness of statins for CVD prevention3–6 and, in recent years, statins have become one of the most regularly
prescribed medicines in the UK.7 In January 2006, the UK government’s National
Institute for Health and Care Excellence (NICE) issued guidelines suggesting that statins should be prescribed by general practitioners (GPs – UK family doctors) to adults aged under 75 years whose risk of developing CVD within 10 years exceeds 20%.8 Generally, the 10-year risk of developing CVD is calculated using an established
Correspondence: Aidan G O’Keeffe Department of Statistical Science, University College London, Gower Street, London, WC1E 6BT, UK Tel +44 20 3108 3409 Fax +44 20 3108 3105 Email a.o’keeffe@ucl.ac.uk
Journal name: Clinical Epidemiology Article Designation: ORIGINAL RESEARCH Year: 2016
Volume: 8
Running head verso: O’Keeffe et al
Running head recto: Time trends in the prescription of statins DOI: http://dx.doi.org/10.2147/CLEP.S104258
Clinical Epidemiology downloaded from https://www.dovepress.com/ by 118.70.13.36 on 20-Aug-2020
For personal use only.
This article was published in the following Dove Press journal: Clinical Epidemiology
27 May 2016
Dovepress
O’Keeffe et al
risk prediction method, such as the Framingham risk score9
or QRISK/QRISK2 risk calculators.10–12 In July 2014, this
guideline was adjusted, with the statin prescription risk score threshold reduced to a risk of 10%. For the over 75s, the same NICE guidelines have recommended that statin prescriptions should be considered irrespective of the 10-year CVD risk score.
Clearly, statins have been commonly prescribed in the UK and the NICE guidelines have recommended their use for a wide section of the UK population. However, despite this, few studies have investigated the rate at which statin therapy is initiated, the prevalence of statin prescriptions, and how these may have changed over time. Some studies on trends in statins prescription in the UK were undertaken during the late 1990s and early 2000s, mainly using small data sources.13–16
Other past works have examined statin prescription trends within Europe,17–24 Canada,25 and the US,26–28 though, again,
with either relatively small cohorts or not with the aim of examining statin prescription trends over time.
In this study, we attempt a comprehensive, large-scale assessment of prescribing trends for statins over time within the UK. We examine both the rate of statin therapy initiation (the rate at which subjects begin the use of statins) and the prevalence of statin prescriptions over time for the primary prevention of CVD. In addition, we examine possible dif-ferences in trends over time with respect to sex, age group, and level of socioeconomic deprivation. We use data from a large cohort of individuals that are generally representative of the UK population and have been collected over a long time period from 1995 to 2013.
Data and methodology
Data source
We used data from The Health Improvement Network (THIN) (www.epic-uk.org), a large-scale source of primary care data that is generally considered to be representative of the UK population.29,30 Approval for the use of THIN data for this
research was granted by the Cegedim Strategic Data Medical Research UK Scientific Review Committee in August 2014 (approval number: 14-021). Because this study was based on data extracted from THIN, it was exempt from human subjects review, and members of the study population did not have to provide written informed consent. THIN data contain tion on patient demographics alongside consultation informa-tion and diagnoses (indexed using Read codes)31 and patient
prescription records. Data in THIN are linked longitudinally for each patient, which facilitates analyses of trends over time. Fur-thermore, THIN data include information on Townsend score,
a measure of social deprivation using unemployment level, car ownership, home ownership, and household overcrowding levels to estimate the possible level of social deprivation within a particular postcode. Patients’ Townsend scores are categorized into five quintiles from 1 (least socioeconomic deprivation) to 5 (most socioeconomic deprivation).
Study participants
We used data from general practices after the date at which they had adopted adequate methods for mortality reporting (acceptable mortality rate)32 and had a sufficiently developed
computer system in use for patient data to be included in THIN (acceptable computer usage date).33 The study is on
the use of statins for the primary prevention of CVD and, as such, only patients who had not previously experienced a CVD event were included in the cohort.
For analyses on the initiation of statin therapy, patients were included in the cohort from the earliest of: January 1, 1995, their 18th birthday, or registration with the practice until the earliest of: death, first CVD event, transfer from GP practice, first statin prescription, or December 31, 2013. Patients who initiated statins within 6 months of practice reg-istration were excluded from analyses concerning initiation of statin therapy. This was done to ensure that patients who had moved GP practice but who had previously received statins would not be included. The use of such a 6-month “qualifi-cation period” has been routine in other studies concerning prescription trends using THIN data.34–36 For analyses on the
prevalence of statin prescriptions, a 6-month qualification period was not used and patients were followed from cohort entry and beyond their first statin prescription.
Statistical analysis
Initiation of statin therapy
We estimated the statin therapy initiation rate, that is, the rate of first statin prescription, per 1,000 person-years for each calendar year, over a time period from 1995 to 2013. Statin therapy initiation rates were estimated using data from all practices combined and also stratified by sex, age group, and Townsend deprivation score. Poisson regression models were used to estimate statin initiation rates, with log (person-years at risk) as an offset term, for each calendar year (1995–2013). We performed separate univariate analy-ses with each of: sex, age group, and Townsend score as explanatory variables and an overall multivariable analysis involving all of these variables. Age groups (in years) were classified as 18–34, 35–49, 50–59, 60–69, 70–74, 75–84, and ≥85.
Clinical Epidemiology downloaded from https://www.dovepress.com/ by 118.70.13.36 on 20-Aug-2020
Dovepress Time trends in the prescription of statins
Prevalence of statin prescriptions
We estimated the prevalence of statin prescription by consid-ering “episodes” during which a given patient was receiving regular statin prescriptions. For each patient, a statin prescrip-tion episode occurs for a time period where statins were pre-scribed at least every 273 days (approximately equivalent to 9 months). A maximum time between successive prescriptions of 9 months was used since statins tend not to be prescribed for >6 months before a repeat prescription is issued. For each patient, in each calendar year of the cohort, the time periods during which a statin prescription episode occurs were cal-culated and summed over all to give an overall time during which patients were receiving statins for each year. We call this the “statin prescription time”. The time “at risk” (ie, the overall time for which patients were eligible to receive statins in each calendar year) was calculated and the statin prescrip-tion time was divided by the at risk time for each calendar year (and stratified by sex, age group, and Townsend score quintile, where appropriate) to calculate overall estimates of statin prescription prevalence. Statin prescription prevalence rates were rescaled and reported per 1,000 person-years.
Data manipulation and extraction were performed using Stata (version 14), with data analysis undertaken in R (version 3.1.2).
Results
Statin therapy initiation
Overall, there were 6,732,469 patients in our study of statin therapy initiation analyses of whom slightly more were female than male (52.3% and 47.7% of the cohort, respec-tively). The number of patients in each of the Townsend score quintiles 1 to 4 was broadly similar with fewer patients in the most deprived, fifth, Townsend score quintile (Table 1). This distribution is in line with that of Blak et al.30 Overall,
statin therapy initiation rates rose at an increasing rate
from 1995 (initiation rate =0.51 per 1,000 person-years) to 2004 (initiation rate =16.32 per 1,000 person-years), with a sharp peak at 2006 (initiation rate =19.83 per 1,000 person years), followed by a steady decline up to 2011 (initiation rate =10.88 per 1,000 person years) and, since 2011, rates have remained fairly constant (Figure 1A; Table 2). Where initiation rates are stratified by sex (Figure 1B; Table 2), a similar overall pattern is seen, although notably, since 2004, there appears to be a separation between males and females in that females generally have a slower rate of statin therapy initiation than males.
When statin therapy initiation rates were stratified by age group (Figure 1C), the rates remain low over time for those aged under 50 years, compared to other age groups, with the maximum statin therapy initiation rates (per 1,000 person years) of 0.83 for the 18–34 years age group (in 2005) and 7.88 for the 35–49 years age group (in 2006). For the 50–59 years age group, the rates are higher, in general, over time, approximately following a similar pattern to that seen in Figure 1A with an increase from 1995 (initiation rate =0.95 per 1,000 person-years) to 2006 (initiation rate =30.12 per 1,000 person-years) and a general decrease from 2007 to 2011 (initiation rate =17.95 per 1,000 person-years), with rates remaining steady since 2011. The 70–74 years age group has the highest statin therapy initiation rate for each year overall, with the maximum statin therapy initiation rate occurring in 2006 (initiation rate =80.42 per 1,000 person years). The 60–69 years and 75–84 years age groups also have high statin therapy initiation rates in each year, with maximum initiation rates (per 1,000 person years) of 61.90 and 51.01, respectively, in 2006. In contrast, statin therapy initiation rates were considerably lower for those in the 85 years and over age group, in each calendar year, with a maximum initiation rate of 23.45 per 1,000 person years in 2006.
Stratified by Townsend score quintile (Figure 1D), the initiation rates follow the same general pattern over time as the overall rates (Figure 1A), though there do not appear to be any obvious differences in initiation rates between the different Townsend score quintiles.
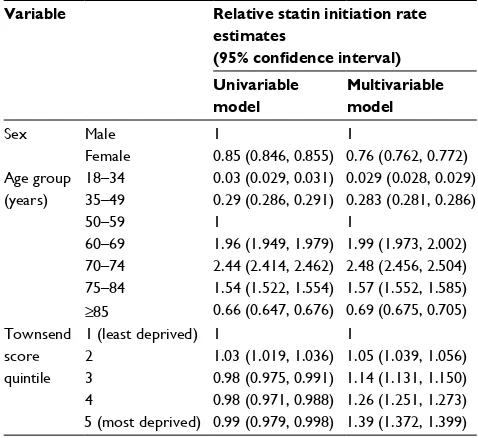
After adjusting for other demographic variables (multi-variable model in Table 3), females were ~24% less likely to initiate statins than males (initiation rate ratio [IRR] and cor-responding 95% confidence interval 0.76 [0.762 to 0.772]). For age groups, relative to a fixed rate of 1 in the 50–59 years group, some age groups show comparably higher estimates (60–69 years: IRR 1.99 [1.973 to 2.002], 70–74
Table 1 Demographics of the cohort for the initiation of statin therapy study
Total number of patients 6,732,469
Sex Male 3,211,813 (47.7%)
Female 3,520,656 (52.3%)
Townsend score quintile 1 (least deprived) 1,566,745 (23.3%)
2 1,384,301 (20.6%)
3 1,444,198 (21.4%)
4 1,359,639 (20.2%)
5 (most deprived) 977,586 (14.5%) Mean age at start of observation 39.2 years
Clinical Epidemiology downloaded from https://www.dovepress.com/ by 118.70.13.36 on 20-Aug-2020
Dovepress
O’Keeffe et al
years: IRR 2.48 [2.546 to 2.504], and 75–84 years: IRR 1.57 [1.552 to 1.585]). Other age groups show comparably lower estimates (18–34 years IRR: 0.029 [0.028 to 0.029], 35–49 years: IRR 0.283 [0.281 to 0.286], and ≥85 years: IRR 0.69 [0.675 to 0.705]). For the Townsend score quintiles, IRR estimates, relative to the reference group of Townsend score quintile 1, were similar for quintiles 2 to 5, with estimates ranging from 0.98 (quintiles 3 and 4) to 1.03 (quintile 2) (univariable model in Table 3). However, after accounting for age group and sex (multivariable model in Table 3),
the IRR estimates in the multivariable model increase with Townsend score quintile, with IRR estimates of: 1.05 (1.039 to 1.056), 1.14 (1.131 to 1.150), 1.26 (1.251 to 1.273), and 1.39 (1.372 to 1.399) for Townsend score quintiles 2, 3, 4, and 5, respectively.
Prevalence of statin prescriptions
We consider results for the estimation of the prevalence of statin prescriptions. Table 4 shows a summary of the patients considered in the analysis of statin prevalence.
Figure 1 Plots showing the estimated statin therapy initiation rates from 1995 to 2013.
Note: (A) Overall, (B) stratified by sex, (C) stratified by age group, and (D) stratified by Townsend score quintile.
0
1995
Age: 18–34 Quintile 1
Quintile 2 Quintile 3 Quintile 4 Quintile 5 Age: 35–49
Age: 50–59 Age: 60–69 Age: 70–74 Age: 75–84 Age: 85+
1995 1998 2001 2004 Year
2007 2010 2013 1995 1998 2001 2004 Year
2007 2010 2013 1998 2001
Statin initiation rate 1995–2013
Males Females
Initiation rate per 1,000 person-y
ears
Initiation rate per 1,000 person-y
ears
2004 Year
2007 2010 2013 1995 1998 2001 2004 Year
2007 2010 2013
51
01
52
02
5
0
Initiation rate per 1,000 person-y
ears
Initiation rate per 1,000 person-y
ears
50
40
30
20
10
60
70
80
90 30
20
10
0
05
10
15
20
25
A
Statin initiation rate 1995–2013 (stratified by age)
C Statin initiation rate 1995–2013
(stratified by Townsend score quintile) D
Statin initiation rate 1995–2013 (stratified by sex) B
Clinical Epidemiology downloaded from https://www.dovepress.com/ by 118.70.13.36 on 20-Aug-2020
Dovepress Time trends in the prescription of statins
Overall, statin prescription prevalence was low in 1995 (prescription rate =2.36 per 1,000 person years) but rose slowly up to 2001 (prescription rate =22.41 per 1,000 per-son years), after which there was an exponential increase in prevalence up to 2007 (96.53 per 1,000 person years). Since 2007, although the statin prescription rate rises, the rate of increase has slowed somewhat (Figure 2A; Table 5). This same pattern is repeated for males and females separately (Figure 2B; Table 5), but we note that, since 2001, the rate of increase in prevalence in females has generally lagged behind that for males and the difference in prescription prevalence between males and females appears to be on the increase. This shift between males and females is similar to that seen for the statin therapy initiation rate in Figure 1B.
When statin prescription prevalence is stratified by age group (Figure 2C), prescription prevalence remains very low for the 18–34 age group, with a maximum prescription preva-lence of 1.88 per 1,000 person years in 2008. For the 35–49 age group, prescription prevalence has tended to remain low, although the rate has risen in more recent years, increasing from 7.25 per 1,000 person-years in 2001 to 30.90 per 1,000 person-years in 2013. The change in the statin prescription rate has been more substantial for the 50–59 years age group, for whom prescription prevalence has increased from 4.96 per 1,000 years in 1995 to 131.56 per 1,000 person-years in 2013.
The oldest age groups (60–69, 70–74, 75–84, 85 and over) have experienced the greatest increase in statin pre-scription rate from 1995 to 2013. A sharp increase in the prescription rate was observed for each age group between 2000 and 2008. Since 2008, the increase in prescription prevalence has slowed slightly for the younger 60–69 years and 70–74 years age groups, with changes from 2008 to 2013 (per 1,000 person-years) of 264.00 to 305.18 and 392.15 to 453.77, respectively. In contrast, the prescription prevalence rate has continued to increase sharply for the 75–84 years and 85 years and over age groups with changes
Table 2 Table showing statin therapy initiation rates for all patients and for males and females separately from 1995 to 2013 per 1,000 person-years
Year Statin therapy initiation rate (per 1,000 person years)
All patients Males Females
1995 0.51 0.51 0.52
1996 1.44 1.29 1.59
1997 1.97 1.87 2.06
1998 2.31 2.24 2.37
1999 3.09 2.93 3.24
2000 4.28 4.29 4.27
2001 6.39 6.60 6.19
2002 9.07 9.39 8.77
2003 11.92 12.61 11.27
2004 16.32 16.66 15.99
2005 16.55 17.39 15.76
2006 19.83 21.24 18.49
2007 16.38 17.98 14.86
2008 16.14 17.88 14.50
2009 15.25 17.43 13.21
2010 12.45 14.11 10.91
2011 10.88 12.32 9.54
2012 11.38 12.66 10.20
2013 10.76 11.87 9.74
Table 4 Demographics of the cohort for the prevalence of statin therapy study
Total number of patients 7,027,711
Sex Male 3,356,438 (47.8%)
Female 3,671,273 (52.2%)
Townsend score quintile: 1 (least deprived) 1,633,640 (23.2%)
2 1,446,584 (20.6%)
3 1,506,846 (21.4%)
4 1,417,595 (20.2%)
5 (most deprived) 1,023,046 (14.6%) Mean age at start of observation 39.8 years
Table 3 Results from univariable and multivariable analyses, estimating the relative statin therapy initiation rates, adjusted for time, with regard to sex, age group, and Townsend score quintile
Variable Relative statin initiation rate estimates
(95% confidence interval) Univariable
model
Multivariable model
Sex Male 1 1
Female 0.85 (0.846, 0.855) 0.76 (0.762, 0.772) Age group
(years)
18–34 0.03 (0.029, 0.031) 0.029 (0.028, 0.029) 35–49 0.29 (0.286, 0.291) 0.283 (0.281, 0.286)
50–59 1 1
60–69 1.96 (1.949, 1.979) 1.99 (1.973, 2.002) 70–74 2.44 (2.414, 2.462) 2.48 (2.456, 2.504) 75–84 1.54 (1.522, 1.554) 1.57 (1.552, 1.585)
≥85 0.66 (0.647, 0.676) 0.69 (0.675, 0.705) Townsend
score quintile
1 (least deprived) 1 1
2 1.03 (1.019, 1.036) 1.05 (1.039, 1.056) 3 0.98 (0.975, 0.991) 1.14 (1.131, 1.150) 4 0.98 (0.971, 0.988) 1.26 (1.251, 1.273) 5 (most deprived) 0.99 (0.979, 0.998) 1.39 (1.372, 1.399)
Notes: In the multivariable model, rates for sex are adjusted for age and Townsend score, rates for age groups are adjusted for sex and Townsend score, and rates for Townsend score are adjusted for sex and age group.
There were slightly more females than males in the cohort (52.2% females and 47.8% males) with the distribution of Townsend score quintiles broadly similar to that for the cohort in Table 1.
Clinical Epidemiology downloaded from https://www.dovepress.com/ by 118.70.13.36 on 20-Aug-2020
Dovepress
O’Keeffe et al
between 2008 and 2013 of 383.15 to 494.60 for the 75–84 years group and 232.03 to 390.70 for the 85 years and over group. At present, the 70–74 years age group has the highest statin prescription rate.
Up to 2007, there was little difference in satin prescrip-tion prevalence between the five Townsend score quintiles (Figure 2D). In 1995, rates varied from 2.15 per 1,000 per-son years for quintile 5 to 2.48 per 1,000 perper-son-years for quintile 3. By 2007, rates for all Townsend score quintiles had increased substantially although little difference existed
between quintiles, with 2007 rates ranging from 94.84 per 1,000 years in quintile 4 to 99.81 per 1,000 person-years in quintile 2.
In recent years, there appears to be a slight difference in prescription prevalence rates, with rates slightly higher in more affluent quintiles (quintiles 1 and 2) compared to less affluent quintiles (quintiles 4 and 5). In 2013, rates for quintiles 1 to 5 (per 1,000 person-years) were 131.12, 134.13, 125.56, 122.40, and 124.39, respectively. It is of note that prescription prevalence rates have increased gradually
Figure 2 Plots showing the estimated statin prescription prevalence rates from 1995 to 2013.
Note: (A) Overall, (B) stratified by sex, (C) stratified by age group, and (D) stratified by Townsend score quintile.
02
04
06
08
0
100
120
140
160
1995 1998 2001 2004 Year
2007 2010 2013
1995 1998 2001 2004 Year
2007 2010 2013 1995 1998 2001 2004 Year
2007 2010 2013
Pre
valence rate per 1,000 person-y
ears
02
04
06
08
0
100
120
140
160
1995 1998 2001 2004 Year
2007 2010 2013
Pre
valence rate per 1,000 person-y
ears
Males Females
Statin prescription prevalence by year 1995–2013
A Statin prescription prevalence by year 1995–2013
(stratified by sex) B
Statin prescription prevalence by year 1995–2013 (stratified by age)
C D Statin prescription prevalence by year 1995–2013
(stratified by Townsend score quintile)
Age: 18–34 Age: 35–49 Age: 50–59 Age: 60–69 Age: 70–74 Age: 75–84 Age: 85+
Quintile 1 Quintile 2 Quintile 3 Quintile 4 Quintile 5
Pre
va
lence rate per 1,000 person-y
ears
500
400
300
200
100
0
Pre
va
lence rate per 1,000 person-y
ears
140
120
100
80
60
40
20
0
Clinical Epidemiology downloaded from https://www.dovepress.com/ by 118.70.13.36 on 20-Aug-2020
Dovepress Time trends in the prescription of statins
over time for each quintile, with no obvious sharp changes in prescription prevalence rates.
Discussion
Findings
The initiation rate of statin therapy increased sharply from 0.51 per 1,000 person-years in 1995 to 19.83 per 1,000 person-years in 2006, before declining slowly to a rate of 10.88 per 1,000 person-years in 2011 and remaining fairly steady up to 2013. Similar patterns were seen when initia-tion rates were stratified by sex, age group, and Townsend deprivation score quintile.
It is apparent that the use of statins became more wide-spread into the 2000s, especially as increasing evidence for the effectiveness of statins for the primary prevention of CVD became widespread.1–6 In addition, public awareness of the
importance of low-density lipoprotein cholesterol reduction and the use of statins, through the media and health promotion campaigns, may have been responsible for a general increase in the uptake of statins over time.37 Furthermore, the cost of
prescribing statins has decreased over time, which may also have influenced in the increase in statin therapy initiation.38,39
The peak in statin therapy initiation observed in 2006 coincides with the NICE recommendation that statins should be routinely prescribed for adults with clinical evidence of
CVD and adults considered to be at risk of CVD and, with this, the adoption of the general rule to prescribe statins to those whose risk of developing a CVD event within 10 years exceeds 20%. As a result, the slow decline in statin initia-tion rates beyond 2006 may be because a large proporinitia-tion of patients who were eligible for statin therapy had received their first statin prescription at this point. Another factor that may have influenced the decline in statin therapy initiation since 2006 may be the increase in the reporting of the pos-sible adverse effects of statins.40–42
We saw evidence of a difference in statin initiation rates for males and females in recent years, with females initiating statins at lower rates than males. The lower rates for females may originate from the fact that CVD risk scores, such as the Framingham risk score or QRISK score,9,10 are usually
calculated differently for males and females and, thus, males may be more likely to attain a 10-year risk score >20% and be prescribed statins. It is well known that CVD events tend to occur later for females than for males and that there are differences in the prevalence of CVD risk factors.43–46 After
accounting for age and sex, statin therapy initiation rates increased as Townsend score quintile increased, thereby implying that the initiation rate of statin therapy increases as the level of social deprivation increases. This concurs with evidence from another recent study on statin therapy initia-tion incidence using THIN.47
We observed higher statin therapy initiation rates for patients aged 70–74 years, which we would naturally expect according to the NICE prescription guidelines for statins. In addition, the low initiation rates seen for age groups under 50 would generally be expected as these are age groups whom we would expect to be at the least risk of experiencing a CVD event. Generally, the 70–74 years age group had a higher statin therapy incidence rate over time than both the 60–69 years group and the 75–84 years group. It is possible that many patients who reach 75 years may already have initi-ated statin therapy and those in the 75–84 years age group who remain eligible for a first statin prescription represent a unique, and perhaps more healthy, subgroup of the general population. In addition, there have been a limited number of randomized controlled trials of the efficacy of statins for low-density lipoprotein cholesterol reduction in the over 75s and it may be that GPs have not always had clear guidance on statin prescriptions for older age groups.48 This may also
explain why the statin therapy initiation rate is relatively low for the 85 years and over age group.
Statin prescription prevalence rates have increased smoothly from 1995 to 2001, but more rapidly from 2001
Table 5 Table showing statin prescription prevalence rates for all patients and for males and females separately from 1995 to 2013 (per 1,000 person-years)
Year Statin prescription prevalence rate (per 1,000 person years)
All patients Males Females
1995 2.36 2.47 2.25
1996 4.01 4.31 3.74
1997 6.27 6.75 5.82
1998 9.14 9.93 8.41
1999 12.36 13.30 11.50
2000 16.30 17.23 15.43
2001 22.41 23.69 21.21
2002 30.85 32.83 28.99
2003 41.59 44.45 38.90
2004 55.33 58.68 52.17
2005 69.94 74.26 65.85
2006 84.92 90.64 79.51
2007 96.53 103.88 89.57
2008 105.63 114.76 96.99
2009 113.57 124.33 103.37
2010 118.49 130.84 106.79
2011 121.10 134.92 108.08
2012 124.79 139.69 110.79
2013 128.03 143.95 113.12
Clinical Epidemiology downloaded from https://www.dovepress.com/ by 118.70.13.36 on 20-Aug-2020
Dovepress
O’Keeffe et al
to 2009. In recent years, males have had a higher prescrip-tion prevalence rate than females. Again, this is possibly because males tend to be at a higher risk of CVD devel-opment than females. Prescription prevalence rates are broadly similar over time for the different Townsend score quintiles, indicating that GP registered patients appear to be receiving statin prescriptions at similar rates across all levels of socioeconomic deprivation, though there is slightly more variation in rates for recent years than in the years up to 2007.
We saw smoothly increasing prevalence rates for the 70–74 years and 75–84 years age groups up to 2009–2010, at which point the rate for the 75–84 years group became higher than that for the 75–84 years group. This effect is perhaps because patients who were prescribed statins in their early 70s (the group with the highest statin therapy initiation rate) have aged and gradually moved into a higher age group over time.
The observed increase in statin prescription prevalence from 1995 to 2013 is perhaps what would be expected when comparing our results to those from some previous studies. Both Teeling et al17 and Walley et al18 reported significant
increases in the use of statins in Ireland and across Europe, in the late 1990s and early 2000s, though we note that these studies did not focus solely on the prescription of statins for the primary prevention of CVD. In our work, we have seen that the use of statins has increased even more rapidly between 2003 and 2013.
Strengths and limitations
First, we note that this work is the most recent and compre-hensive study on statin prescription rates among patients who are yet to experience a CVD event using a large database of UK primary care records.
A clear strength of this study is the large sample size which reflects the general UK population and allows us stratify quantities of interest without the problem of small group sizes for some strata. In addition, since most GPs generate prescriptions electronically, the nature of the THIN database allows us to accurately monitor statin pre-scriptions in a detailed manner, by patient, longitudinally. We feel that this has allowed us to make an informed and comprehensive assessment of statin prescription rates for primary prevention of CVD over time, within the UK population.
However, there are limitations to our methods and sample. We used data from those who are registered and received statin prescriptions from a GP and hence we will not have
captured those who receive treatment outside primary care. We note, though, that the majority of the UK population are registered with a GP.49 Some individuals may be initiated
treatment while they are in hospital; however, the prescribing budget lies within primary care. Also, low dose statins can be bought over the counter and we would not have captured these in our estimates.
Finally, it is important to note that receipt of a statin prescription does not necessarily imply that a patient actually takes the medication. However, we note that the large number of patients who receive repeat prescriptions for statins over time is perhaps an indication that these patients are actually taking the treatment prescribed on a regular basis.
Clinical implications
One clinical question of interest is whether or not statins are under- or over-prescribed. Our results would allow clinicians to assess whether or not the observed statin prescription rates in THIN data are in line with those that would be expected for a particular group within the general population who have yet to experience a CVD event. As an example, results from Abramson et al50 suggested that, in 2011, if CVD risk was
estimated using the QRISK2 score, then one would expect 2% of females and 9% of males in their 50s and 16% of females and 48% of males in their 60s to be eligible for regular statin prescriptions. Comparatively, our 2011 estimated statin pre-scription prevalence rates would suggest that, approximately, statins were over-prescribed for the 50–59 age group but were approximately in line with what would be expected for the 60–69 years age group.
Final conclusion
The uptake of statins for the primary prevention of CVD within UK primary care has increased greatly over time up to 2013 with statins being more commonly prescribed to older patients in general and, in recent years, males appear to have been prescribed statins at higher rates than females. After accounting for sex and age group, the rate of statin therapy initiation is slightly higher as social deprivation level, as measured by Townsend score quintile, increases.
Acknowledgments
Approval for use of the THIN data was granted by a medi-cal research scientific review committee on August 6, 2014 (reference 14-021). The authors received financial support through grant MR/K014838/1 from the UK Medical Research Council.
Clinical Epidemiology downloaded from https://www.dovepress.com/ by 118.70.13.36 on 20-Aug-2020
Dovepress Time trends in the prescription of statins
Disclosure
The authors report no conflicts of interest in this work.
References
1. Taylor F, Ward K, Moore TH, et al. Statins for the primary prevention of cardiovascular disease. Cochrane Database Syst Rev. 2013;1:CD004816. 2. Ebrahim S, Taylor FC, Brindle P. Statins for the primary prevention of
cardiovascular disease. BMJ. 2014;348:g280.
3. Scandinavian Simvastatin Survival Study Group. Randomised trial of cholesterol lowering in 4444 patients with coronary heart dis-ease: the Scandinavian Simvastatin Survival Study (4S). Lancet.
1994;344:1383–1389.
4. ALLHAT Officers and Coordinators for the ALLHAT Collaborative Research Group. The antihypertensive and lipid-lowering treatment to prevent heart attack trial. Major outcomes in moderately hypercho-lesterolemic, hypertensive patients randomized to pravastatin vs usual care: The Antihypertensive and Lipid-Lowering Treatment to Prevent Heart Attack Trial (ALLHAT-LLT). JAMA. 2002;288:2998–3007. 5. Baigent, C, Keech A, Kearney PM, et al; Cholesterol Treatment
Trial-ists’ (CTT) Collaborators. Efficacy and safety of cholesterol-lowering treatment: prospective meta-analysis of data from 90,056 participants in 14 randomised trials of statins. Lancet. 2005;366:1267–1278. 6. Brugts JJ, Yetgin T, Hoeks SE, et al. The benefits of statins in people
with-out established cardiovascular disease but with cardiovascular risk factors: meta-analysis of randomised controlled trials. BMJ. 2009;338:b2376. 7. Trusler D. Statin prescriptions in UK now total a million each week.
BMJ. 2011;343:d4350.
8. NICE. Statins for the Prevention of Cardiovascular Events. London: NICE; 2006.
9. D’Agostino RB, Vasan RS, Pencina MJ, et al. General cardiovascular risk profile for use in primary care: the Framingham Heart Study.
Circulation. 2008;117:743–753.
10. Hippisley-Cox J, Coupland C, Vinogradova Y, Robson J, May M, Brindle P. Derivation and validation of QRISK, a new cardiovascular disease risk score for the United Kingdom: prospective open cohort study. BMJ.
2007;335:136.
11. Hippisley-Cox J, Coupland C, Vinogradova Y, et al. Predicting cardiovas-cular risk in England and Wales: prospective derivation and validation of QRISK2. BMJ. 2008;336:1475–1482.
12. Collins GS, Altman DG. Predicting the 10 year risk of cardiovascular disease in the United Kingdom: independent and external validation of an updated version of QRISK2. BMJ. 2012;344:e4181.
13. DeWilde S, Carey IM, Bremner SA, Richards N, Hilton SR, Cook DG.
Evolution of statin prescribing 1994–2001: a case of agism but not of sexism? Heart. 89;2003:417–421.
14. Wei L, Ebrahim S, Bartlett C, Davey PD, Sullivan FM, MacDonald TM. Statin use in the secondary prevention of coronary heart disease in primary care: cohort study and comparison of inclusion and outcome with patients in randomised trials. BMJ. 2005;330:821.
15. Carey IM, DeWilde S, Shah SM, Harris T, Whincup PH, Cook DG.
Statin use after first myocardial infarction in UK men and women from 1997 to 2006: Who started and who continued treatment? Nutr Metab Cardiovasc Dis NMCD. 2012;22:400–408.
16. Ashworth M, Lloyd D, Smith RS, Wagner A, Rowlands G. Social depri-vation and statin prescribing: a cross-sectional analysis using data from the new UK general practitioner ‘Quality and Outcomes Framework’.
J Public Health (Oxf). 2007;29:40–47.
17. Teeling M, Bennett K, Feely J. The influence of guidelines on the use of statins: analysis of prescribing trends 1998–2002. Br J Clin Pharmacol.
2005;59:227–232.
18. Walley T, Folino-Gallo P, Stephens P, Van Ganse E. Trends in prescribing and utilization of statins and other lipid lowering drugs across Europe 1997–2003. Br J Clin Pharmacol. 2005;60:543–551.
19. Bartholomeeusen S, Vandenbroucke JP, Truyers C, Buntinx F. Trends in total cholesterol screening and in prescribing lipid-lowering drugs in general practice in the period 1994–2003. BMC Fam Pract. 2008;9:39.
20. Geleedst-De Vooght M, Maitland-van der Zee AH, Schalekamp T, Mantel-Teeuwisse A, Jansen P. Statin prescribing in the elderly in the Netherlands: a pharmacy database time trend study. Drugs Aging.
2010;27:589–596.
21. Bijlsma MJ, Hak E, Bos JHJ, Berg LTW, de J den, Janssen, F. Inclusion of the birth cohort dimension improved description and explanation of trends in statin use. J Clin Epidemiol. 2012;65:1052–1060.
22. Wallach Kildemoes H, Vass M, Hendriksen C, Andersen M. Statin utilization according to indication and age: a Danish cohort study on changing prescribing and purchasing behaviour. Health Policy.
2012;108:216–227.
23. Upmeier E, Korhonen MJ, Helin-Salmivaara A, Huupponen R. Statin use among older Finns stratified according to cardiovascular risk. Eur J Clin Pharmacol. 2013;69:261–267.
24. Bijlsma MJ, Janssen F, Lub R. Birth cohort appeared to confound effect estimates of guideline changes on statin utilization. J Clin Epidemiol.
2015;68:334–340.
25. Neutel CI, Morrison H, Campbell NRC, de Groh M. Statin use in Canadians: trends, determinants and persistence. Can J Public Health.
2007;98:412–416.
26. Ma J, Sehgal NL, Ayanian JZ, Stafford RS. National trends in statin use by coronary heart disease risk category. PLoS Med. 2005;2:e123. 27. Johansen ME, Green LA, Sen A, Kircher S, Richardson CR.
Car-diovascular risk and statin use in the United States. Ann Fam Med.
2014;12:215–223.
28. Cohen JD, Brinton EA, Ito MK, Jacobson TA. Understanding Statin Use in America and Gaps in Patient Education (USAGE): an internet-based survey of 10,138 current and former statin users. J Clin Lipidol.
2012;6:208–215.
29. Bourke A, Dattani H, Robinson M. Feasibility study and methodology to create a quality-evaluated database of primary care data. Inform Prim Care. 2004;12:171–177.
30. Blak BT, Thompson M, Dattani H, Bourke A. Generalisability of The Health Improvement Network (THIN) database: demographics, chronic disease prevalence and mortality rates. Inform Prim Care.
2011;19:251–255.
31. Chisholm, J. The Read clinical classification. BMJ. 1990;300:1092–1092. 32. Maguire A, Blak BT, Thompson M. The importance of defining periods of complete mortality reporting for research using automated data from primary care. Pharmacoepidemiol Drug Saf. 2009;18:76–83. 33. Horsfall L, Walters K, Petersen I. Identifying periods of acceptable
computer usage in primary care research databases. Pharmacoepidemiol Drug Saf. 2013;22:64–69.
34. Man SL, Petersen I, Thompson M, Nazareth I. Antiepileptic drugs during pregnancy in primary care: a UK population based study. PLoS One. 2012;7:e52339.
35. Petersen I, McCrea RL, Osborn DJ, et al. Discontinuation of anti-psychotic medication in pregnancy: a cohort study. Schizophr Res.
2014;159:218–225.
36. Marston L, Nazareth I, Petersen I, Walters K, Osborn DP. Prescrib-ing of antipsychotics in UK primary care: a cohort study. BMJ Open.
2014;4:e006135.
37. Abramsom J. Prescribing statins: time to rein it in. Pharm J. 2015;294. doi:10.1211/PJ.2015.20068145.
38. Mihaylova B, Briggs A, Armitage J, Parish S, Gray A, Collins R; Heart Protection Study Collaborative. Lifetime cost effectiveness of simvastatin in a range of risk groups and age groups derived from a randomised trial of 20 536 people. BMJ. 2006;333:1145.
39. Lazar LD, Pletcher MJ, Coxson PG, Bibbins-Domingo K, Goldman L. Cost-effectiveness of statin therapy for primary prevention in a low-cost statin era. Circulation. 2011;124:146–153.
40. Mansi I, Frei CR, Pugh MJ, Makris U, Mortensen EM. Statins and musculoskeletal conditions, arthropathies, and injuries. JAMA Intern Med. 2013;173:1–10.
41. Mikus CR, Boyle LJ, Borengasser SJ, et al. Simvastatin impairs exercise training adaptations. J Am Coll Cardiol. 2013;62:709–714.
42. Zhang H, Plutzky J, Skentzos S, et al. Discontinuation of statins in rou-tine care settings: a cohort study. Ann Intern Med. 2013;158:526–534.
Clinical Epidemiology downloaded from https://www.dovepress.com/ by 118.70.13.36 on 20-Aug-2020
Dovepress
Clinical Epidemiology
Publish your work in this journal
Submit your manuscript here: https://www.dovepress.com/clinical-epidemiology-journal
Clinical Epidemiology is an international, peer-reviewed, open access, online journal focusing on disease and drug epidemiology, identifica-tion of risk factors and screening procedures to develop optimal pre-ventative initiatives and programs. Specific topics include: diagnosis, prognosis, treatment, screening, prevention, risk factor modification,
systematic reviews, risk and safety of medical interventions, epidemiol-ogy and biostatistical methods, and evaluation of guidelines, translational medicine, health policies and economic evaluations. The manuscript management system is completely online and includes a very quick and fair peer-review system, which is all easy to use.
Dove
press
O’Keeffe et al
43. Mosca L, Barrett-Connor E, Wenger NK. Sex/gender differences in cardiovascular disease prevention what a difference a decade makes.
Circulation. 2011;124:2145–2154.
44. Kannel WB, McGee DL. Diabetes and cardiovascular disease. The Framingham study. JAMA. 1979;241:2035–2038.
45. Barrett-Connor E. Sex differences in coronary heart disease why are women so superior? The 1995 Ancel Keys Lecture. Circulation.
1997;95:252–264.
46. Wilson PWF, D’Agostino RB, Levy D, et al. Prediction of coronary heart disease using risk factor categories. Circulation. 1998;97:1837–1847.
47. O’Keeffe AG, Petersen I, Nazareth I. Initiation rates of statin therapy for the primary prevention of cardiovascular disease: an assessment of differences between countries of the UK and between regions within England. BMJ Open. 2015;5:e007207.
48. Wilmot KA, Khan A, Krishnan S, Eapen DJ, Sperling L. Statins in the elderly: A patient-focused approach. Clin Cardiol. 38, 56–61 (2015). 49. Lis Y, Mann RD. The VAMP Research multi-purpose database in the
U.K. J Clin Epidemiol. 1995;48:431–443.
50. Abramson JD, Rosenberg HG, Jewell N, Wright JM. Should people at low risk of cardiovascular disease take a statin? BMJ. 2013;347:f6123.
Clinical Epidemiology downloaded from https://www.dovepress.com/ by 118.70.13.36 on 20-Aug-2020