The ATLAS Access Manager Policy Browser:
state-of-the-art web technologies for a rich and interactive
data visualization experience
IgorSoloviev1,∗,GiuseppeAvolio2, andSamiPerrin2
1University of California, Irvine, CA 92697-4575, US
2European Laboratory for Particle Physics, CERN, Geneva 23, CH-1211, Switzerland
Abstract.The ATLAS experiment is operated daily by many users and experts working concurrently on several aspects of the detector. The safe and opti-mal access to the various software and hardware resources of the experiment is guaranteed by a role-based access control system (RBAC) provided by the ATLAS Trigger and Data Acquisition (TDAQ) system. The roles are defined by an inheritance hierarchy. Depending on duties, every ATLAS user has a well-defined set of access privileges (rules) corresponding to a specific set of assigned roles. In total, there are several hundred roles and several thousand users. Over the years, the system grew up in terms of users and roles, motivat-ing the deployment of a visualization tool named "Policy Browser". Currently, it is the primary tool for role administrators to manage all the aspects of the Access Management via a rich web-based interface. This paper presents the requirements, design and implementation of the "Policy Browser". The tool is able to aggregate and correlate all the information provided by the RBAC system and offers a visual representation of the interrelations occurring among roles, users, hosts and rules. Additionally, the "Policy Browser" implements a powerful and flexible query mechanism facilitating the browsing of all the au-thorizations granted by the system. As an example of the available visual rep-resentations, the "Policy Browser" is capable of dynamically generating graphs to quickly display the role giving a user some defined privileges. A graph ex-plorer is also provided in order to browse the role’s inheritance hierarchy. The "Policy Browser" is implemented using robust JavaScript frameworks: Angu-larJS, Bootstrap, D3.js for the front-end, and Django a python framework for the back-end. The use cases and the results based on an informal evaluation provided by the roles administrators are also presented.
1 Introduction
The Access Manager Service (AM) [1] is a software infrastructure component of the Trigger and Data Acquisition system (TDAQ) [2] of the ATLAS [3] detector at the Large Hadron Col-lider (LHC) at CERN. The ATLAS experiment comprises a significant number of hardware devices, software applications and human personnel to operate the experiment. The protec-tion of the experiment equipment against damages as a result of misuse and its optimized
∗e-mail: [email protected] c
exploitation by avoiding the conflicting accesses to resources are key requirements for the successful running of ATLAS.
In most cases the personnel operates the ATLAS experiment and accesses its resources using CERN user accounts. We are avoiding the group accounts as it is an unsafe solution. The user obtains AM roles in accordance with the qualification and functions in the ATLAS experiment. Usually the expert roles are assigned and enabled permanently. Some roles can be automatically enabled by the ATLAS Operation Task Planner while needed for ongoing user’s duties like participation in shifts. In other cases, the decision to assign or to enable a particular user role is taken by the corresponding ATLAS sub-detector or sub-system coordi-nators. When the coordinators receive a request to grant a user an access to certain resources, they have to check the present situation, and, if needed, to select the most appropriate avail-able role to be assigned to the user. In rare cases such roles do not exist and need to be discussed with the role administrators to be created. Thus there is a group of coordinators and administrators, that requires an efficient mechanism to browse hierarchy of the existing
roles, the resources they provide access to, and the status of the roles assigned to the users and the cumulative permissions granted by them. The AM service itself does not provide such information in a single point. The information about the hierarchy of roles and their assign-ment to users is stored in LDAP, and the description of the experiassign-ment resources associated with the roles is stored in a text file.
2 Previous Implementation
During the preparation for the LHC Run-1 the documentation about the available roles and their permissions was manually updated on a TWiki page by system administrators. Such approach was inefficient especially taking into account the fast growing needs of various
groups when the AM policies were updated or created every week, and the AM permissions granted to the users were updated every day.
The first interactive web-based Policy Browser was implemented in 2011 using Google Web Toolkit (GWT) [4] visualization library. The web graphical backend was designed using high-level Java programming language, that was translated by the GWT framework into low-level Google Charts JavaScript [5]. The design, the implementation and the testing cycles were very short and efficient thanks to the simple Java code and integration into Eclipse
framework. An example of the resulted web graphical interface is shown in Figure 1.
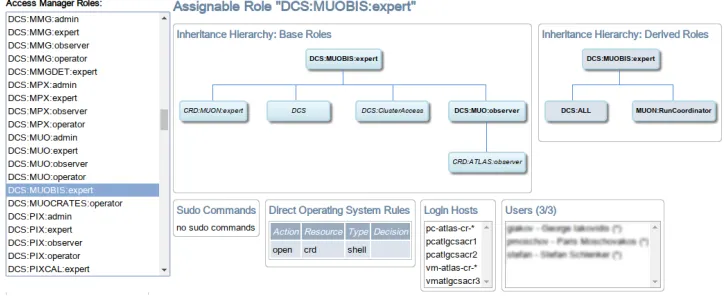
Figure 1.First version of interactive Policy Browser based on GWT.
The interface allowed to browse and search available roles, their inheritance hierarchies, the details of associated rules, permissions and of the assigned and enabled users.
Internally the Policy Browser reads complete information from a JSON file periodically updated by the Access Manager service and uploaded on predefined web URL. Such JSON file contains the complete information about roles, rules, permissions and users.
The interface was successfully used since it was put into production. However there were two issues which motivated us to search for a different solution:
• The Google Charts toolkit is a solid technology used by Google for various widely used web tools like Gmail, calendar, maps, etc. However at some moment Google had stopped support for the visualization library. It is still compatible with interfaces of the previously used charts, however any new charts or extensions are unavailable. It is also not clear for how long such compatibility will be provided.
• The JavaScipts code implementing the Google Charts cannot be downloaded on our web servers and has to be directly accessed from the Google ones. This creates security problem for browsers running inside isolated experiment computing network normally prohibiting connections with external world. Thus the functionality of the browser depends on Internet connection with external world from the experiment area, the status of the Google servers and state of the Internet infrastructure, i.e. on many items outside of our control. This has to be avoided.
As well we acquired new user requirements. The browser has to present an aggregation of all permissions granted by all enabled user roles. It has to be possible to search all users having certain permission, for example to login to a particular host, to edit some databases or to issue run control commands. One has to be able to display a graph of roles inheritance hierarchy in a selectable way (i.e. be able to select a group of participating roles by type or by mask) and to export the result in a graphical vector format to be inserted into various presentations, papers, etc. All above motivated us for a new Policy Browser implementation.
3 The new Policy Browser design and implementation
In 2017 we started the evaluation of suitable web technologies to choose modern solid one for implementation of the new Policy Browser. The decision was to use the client server approach to clearly decouple the server side logic from the client side implementation. The server performs the processing of complex user requests which will be too inefficient on a
client side. The result is that both the client and the server are more generic and reusable in other contexts or modifiable.
The Policy Browser server is a web application exposing a REST API. The server pro-duces data and graphical files, and sends them to the client that displays them. The server is using Django [6], a Python framework that follows the Model-View Controller (MVC) [7] architecture. The selection of Python was particularly interesting to do short prototyping it-erations at the beginning of the project and the MVC architecture allowed to focus the code development on the specific features of the project.
The client is using AngularJS [8], an open source JavaScript framework, in conjunction with Bootstrap [9], an open source toolkit for CSS development.
The architecture of the new Policy Browser is shown in Figure 2.
3.1 The Policy Browser server
Figure 2.The architecture of the Policy Browser.
3.1.1 AM configuration data handling
The actual AM permissions used by the system are stored on LDAP server and in a text file. Calculations of their interrelations for visualization require complex manipulations with its data. The first in-memory prototype had acceptable performance and resources usage, but resulted in a complicated and hardly maintainable codebase for various search and compare loop operations.
As this problem is best solved by a query optimizer, it became clear that leveraging a Relational Database Management System (RDBMS) was the best approach. The total amount of data stored to represent the complete current state of the AM configuration does not exceed a few megabytes. After a careful evaluation we decided to use SQLite [10], that is a portable RDBMS and does not require an independent server process, so its library is directly linked with the Policy Browser server application. All required data are stored into a single database file, which is updated every time the server is notified about the AM configuration changes. Django ships with an Object-Relational Mapping (ORM) that accelerates the initial design of the schema and simplifies data access.
3.1.2 Graph Engine
The roles are organized into an inheritance hierarchy reflecting different levels of users
exper-tise. For a given role, it is often necessary to visualize its “inherits from” and “inherited by” graphs. We investigated various possibilities for graphs drawings including the force based graphs, the tree layouts, the arc diagrams, the circular layouts and the layered graphs. The tree layout drawing is attractive for the readability, and it was used in the first GWT-based version of the Policy Browser. However the inheritance hierarchy is not a tree. To represent a graph it was necessary to duplicate some nodes, as that was the only possibility for such sort of data representation using GWT technology. For our dependency graphs (directed acyclic) we chose the layered graph drawing (also called Sugiyama drawing).
Ideally no edge should go upward, and the goal is to minimize the number of edge cross-ings for readability. As for a large graph this can be a costly operation, the server relies on a dedicated graph engine, Graphviz [11], for all the graphs generation. An optimal solution can be found by trying various nodes permutations at each layer. We configure the Graphviz for the maximum number iterations during optimization, the appearance style and the output format. Because it is a standalone command line application, we integrated it by launching subprocesses in the Python thread. The Policy Browser server builds the description of the subgraph comprising of all the nodes that can be reached from the selected node (i.e. the central role to be drawn) and of the nodes that can reach it and finally adds all the edges that have both endpoints in this set. Then the data are passed to the Graphviz subprocess. If the output has to be statically displayed in the browser, the SVG [12] output format is selected for its scalability and low weight. Another type of output format is PDF used for downloading
the resulted graph. A third possibility is to animate the graph drawing on the client-side; this is called the Graph Explorer and it is described with more details in the next section.
Graphviz can be configured to produce three types of edges: linear, curved (bezier curves) or orthogonal. We discarded the linear option as it sometimes produces edges that overlap nodes. We tested the two remaining types of graphs and found that for most graphs of rea-sonable size the curved edge mode gave the best visual results. For larger graphs however the distinction was less clear. The curved option produces more straightforward edges, but edge crossings can have small angles and make the edges harder to follow. The orthogonal edge mode guarantees that edge crossings produces 90◦ angles, implying easier to follow edges
but longer on average. We decided to propose the two modes to the user while having the default mode set to curved.
An issue that was raised with the orthogonal mode was the increased total time to produce graphs. While still imperceptible for most graphs, the worst case scenario required 15 seconds production time. To improve the usability we introduced a dedicated cache storing user query and a corresponding result produced by the Graphviz on a file system.
3.1.3 Administration and metadata management
Django ships by default with a complete authentication mechanism. As the Policy Browser is designed to run inside a protected local network, we already have the guarantee that users reaching the http server have a remote authorization in ATLAS. We nevertheless used the authentication mechanism system to access privileged functions.
One of the privileged function the system offers is the cache management. The privileged
user should be able to query the state of the cache, whether it is enabled or not and if it is, its total size and the number of objects stored. If necessary, the user should be able to clear it.
The second privileged function is the meta information management. The structure of the permissions granted by the roles may be evolved in time, e.g. new types of commands or data access privileges could be introduced following the requirements from the TDAQ software. In such case, the Policy Browser should be adaptable to that change without requiring code modification or change in the database schema, so the structure of the permissions has to be defined in a single meta data configuration file and easily updatable. We selected the JSON format for such meta data file. On reload the Policy Browser server checks the syntax and applies required configuration changes gracefully reporting possible mismatches between the new Policy Browser and the Access Manager service configurations or JSON syntax errors.
Finally, to manage users, the default Django interface is also present.
3.2 The Policy Browser client
The web interface consists of data panels to display roles, users and permissions. A tree widget compacts thousands of objects by few resource categories and subsystems. For a specific object, we display the list of related authorization (e.g. for a given command it displays a list of roles that allows its execution and the list of authorized users). It also proposes text and category filters to further help finding the appropriate resource.
The AngularJS is an open-source front-end framework built in JavaScript using MVC pattern architecture. It was designed by redefining the boundary between the declarative lan-guage part of the application (HTML) and the the dynamic part (JavaScript). The declarative part is entirely in charge of the interface and the dynamic part is solely responsible of the business logic.
The D3.js is a JavaScript library designed to simplify the creation of data visualizations. It permits to dynamically create and update the content according to some dataset. The Policy Browser implementation uses D3.js to produce the Detail Graph. It uses the capability of modern web browser to inline and optimize SVG a format to describe 2D vector graphics.
3.2.1 The views
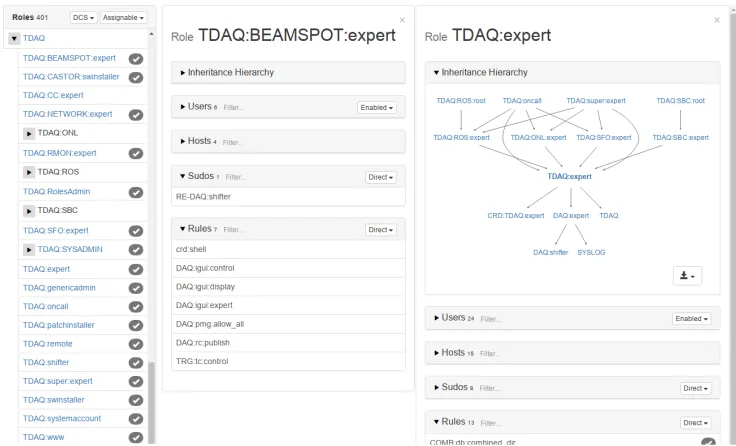
The data panels can be expanded to allow browsing and comparing the roles, users and their permissions without switching between windows or tabs. For example the list of roles allows to show details of associated users, hosts, commands and rules for one or more roles without leaving the current view as shown in Figure 3.
Figure 3.The roles client view.
3.2.2 Detail Graph
The role is the key element granting permissions. A user may have permission granted by several roles. Sometimes it is required to know not only which resource a user is accessing, but also via which role. This is where the detail graph is useful. Since often several paths allow access to a resource, the detail graph is an effective way to represent this information.
The AngularJS is an open-source front-end framework built in JavaScript using MVC pattern architecture. It was designed by redefining the boundary between the declarative lan-guage part of the application (HTML) and the the dynamic part (JavaScript). The declarative part is entirely in charge of the interface and the dynamic part is solely responsible of the business logic.
The D3.js is a JavaScript library designed to simplify the creation of data visualizations. It permits to dynamically create and update the content according to some dataset. The Policy Browser implementation uses D3.js to produce the Detail Graph. It uses the capability of modern web browser to inline and optimize SVG a format to describe 2D vector graphics.
3.2.1 The views
The data panels can be expanded to allow browsing and comparing the roles, users and their permissions without switching between windows or tabs. For example the list of roles allows to show details of associated users, hosts, commands and rules for one or more roles without leaving the current view as shown in Figure 3.
Figure 3.The roles client view.
3.2.2 Detail Graph
The role is the key element granting permissions. A user may have permission granted by several roles. Sometimes it is required to know not only which resource a user is accessing, but also via which role. This is where the detail graph is useful. Since often several paths allow access to a resource, the detail graph is an effective way to represent this information.
It is possible to distinguish the active permissions granted by the enabled roles (solid black lines on the graph) and potentially granted by assigned but disabled roles (grey lines). See example in Figure 4.
Figure 4.The detailed graph example.
3.2.3 Graph Explorer
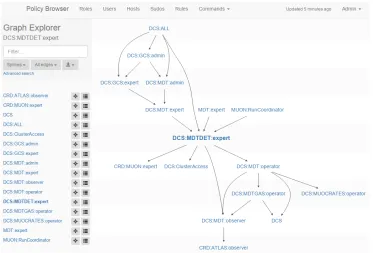
The Graph Explorer is a tool that allows displaying the inheritance hierarchy. It allows brows-ing large graphs comprisbrows-ing many layers and hundreds of roles with zoom and pan. It permits an easy navigation from role to role with a graph morphing animation. Lateral filters are shown in order to highlight subgraph and an advanced search mode allows to fully customize the display. An example of the graph explorer window is shown in Figure 5.
Figure 5.The graph explorer example.
4 Conclusion
ex-periment produced for the previous version of the Policy Browser. All the initial require-ments have been implemented. Thanks to the modern technologies, the development was rather straightforward and allowed to produce a state-of-the-art GUI in a short time span. Performance-wise, the graph generation is the critical part of the API. Benchmark results show that the current implementation requires an average of 70 ms per graph (CERN Cen-tOS 7, i7-3770 CPU) which should not be perceptible by end users. The user feedback is generally very positive. It tends to indicate an intuitive layout and general ease of use.
References
[1] M. Leahu, M. Dobson, G. Avolio, IEEE Trans. Nucl. Sci.55, 386 (2008) [2] The ATLAS TDAQ Collaboration, JINST11, P06008 (2016)
[3] The ATLAS Collaboration, JINST3, S08003 (2008)
[4] Google web toolkit, http://www.gwtproject.org/, accessed: 2018-10-02
[5] Google charts, https://developers.google.com/chart/, accessed: 2018-10-03
[6] Django, https://www.djangoproject.com, accessed: 2018-10-02
[7] F. Buschmann, R. Meunier, H. Rohnert, P. Sommerlad, M. Stal,Pattern-Oriented Soft-ware Architecture(1996)
[8] AngularJS — superheroic JavaScript MVW framework, https://angular.io/, accessed:
2018-10-03
[9] Bootstrap, https://getbootstrap.com/, accessed: 2018-10-03
[10] SQLite, https://www.sqlite.org, accessed: 2018-10-03
[11] Graphviz - graph visualization software, https://www.graphviz.org/, accessed:
2018-10-03
[12] Scalable Vector Graphics, https://www.w3.org/TR/2011/REC-SVG11-20110816/,
ac-cessed: 2018-10-15