ISSN (Print) : 2320 – 3765 ISSN (Online): 2278 – 8875
I
nternational
J
ournal of
A
dvanced
R
esearch in
E
lectrical,
E
lectronics and
I
nstrumentation
E
ngineering
(An ISO 3297: 2007 Certified Organization)
Vol. 3, Issue 12, December 2014
Study of Kalman Filtering Techniques and Its
Application for Optimal Power System
Operation
K. Sowjanya, Prof., P.Sangameshwara Raju
Department of EEE, SV University, Tirupati, India
Department of EEE, SV University, Tirupati, India
ABSTRACT: Improve in power consumption cause serious balance issues in electrical power systems if there are no on- going or upcoming development tasks of new power plants or transmission lines. Additionally, such increase can result in large energy failures of the system. In expensive and ecologically effective way to prevent building the new infrastructures such as power plants, transmission lines, etc., the distributed generation (DG) has been compensated great attention.
KEYWORDS: Distributed generation, grid connection, Kalman filter algorithm, load-concentration-bus, optimal location, optimal size, power loss
I.INTRODUCTION
IN response to the recently improved prices of oil and natural gas, it is expected that the electrical energy industry will go through significant and fast change with regard to its framework, function, preparing, and control. Moreover, because of new restrictions placed by cost-effective, governmental, and ecological factors, styles in power system preparing and function are being forced toward maximum usage of current power facilities with limited working edges[2]. Therefore, the electrical powered power companies are attempting to achieve this purpose via many different ways, one of which is to delay the distribution generation (DG) remedy by a separate energy manufacturer (IPP) to meet growing customer fill demand. In this case, deferral attributes obtained by the IPP rely on the step-by-step system stability enhancement made by the DG remedy[1]-[4]. The DG is based on the alternative energy such as energy cell, photovoltaic or PV and wind energy as well as mixed heat and energy gas generator, micro-turbine, etc. Now, it becomes an essential important component of the modern energy system recently for several reasons.
II.ELECTION OF OPTIMAL LOCATIONS A. Reduction of Power Loss by Connecting DG
In general, the presented power plants tend to be far from the consumption regions, and this situation causes a large amount of power loss on the power system. The IEEE benchmarked 30-bus system is shown in Fig. 1, The directly-connected-bus is defined as a bus connected to a location bus that does not pass through any other buses. For example, buses 12, 14, 18, and 23 in Fig. 1 are the directly-connected-buses if bus 15 is chosen as a reference bus. The load-concentration-bus handles relatively large loads, and Is more linked to the other directly-connected-buses when compared to other nearby buses. In Fig. 1, buses 10, 12, 27, and 5 can be selected as the delegate load-absorption buses of Areas 1 through 4, respectively. Then, they provide an effect similar to the case where there are all DGs on each load bus, but with added benefit of reduced
power loss From the Simplified unit circuit shown in Fig. 2, the power loss, between two buses, and , is computed by
ISSN (Print) : 2320 – 3765 ISSN (Online): 2278 – 8875
I
nternational
J
ournal of
A
dvanced
R
esearch in
E
lectrical,
E
lectronics and
I
nstrumentation
E
ngineering
(An ISO 3297: 2007 Certified Organization)
Vol. 3, Issue 12, December 2014
Fig1. IEEE benchmarked 30-bus system.
Fig2. Simplified unit circuit between two buses.
Also, the one-line plan of a distribution feeder with a total of unit tour is proven in Fig. 3. When energy flows in one
direction, the value of bus volt, , has a smaller sized than that of , and this associated formula can be indicated by
(2).
Fig3. One-line diagram of a distribution feeder.
ISSN (Print) : 2320 – 3765 ISSN (Online): 2278 – 8875
I
nternational
J
ournal of
A
dvanced
R
esearch in
E
lectrical,
E
lectronics and
I
nstrumentation
E
ngineering
(An ISO 3297: 2007 Certified Organization)
Vol. 3, Issue 12, December 2014
Earl, the reactive power , is decreased by linking a capacitor bank on bus in purchase to decrease the volts gap between
and . In other terms, the capacitor financial institution at bus creates it possible to decrease energy reduction and
control the currents by adjusting the value of in the following:
If a DG is set up at the place of the capacitor financial institution, the proper delicate energy management of the DG has the same effect on the system as does the capacitor financial institution. Fig. 4 reveals the system power loss corresponding to the different energy and volts machines of the DG at the load-concentration-bus 10 in Place 2 of Fig. 1. It is noticed that the power loss is decreased almost linearly as the dimension DG improves.
B. Choice of Maximum Place for DGs by Considering Power Loss Before drawing the equations necessary to choose the optimal location for the DG, the following conditions is firstly defined.
Fig5. Power flow from the generator to the loads
Fig6. Power flow from the several generators to the l load.
𝐹𝑗𝑙 ,𝑘: Power flowing from the generator to the load through bus j connected to the load; 𝐷𝑗𝑙 ,𝑘 : Ratio of to the power supplied by the kth generator;
𝑃𝑙𝑜𝑠𝑠 ,𝑘: Power loss on transmission line due to the power supplied from generator;
𝐹𝑘𝑗 ,𝑙 : Power flow from the generator to the load through bus j connected to the generator; 𝐷𝑘𝑗 ,𝑙 : Ratio to the power supplied by the generator;
𝑃𝑙𝑜𝑠𝑠 ,𝑙: Power loss on a transmission line due to power supplied to the lth load; 𝑝𝑙𝑜𝑠𝑠 ,𝑖,𝑗: Power loss between buses i and j;
The IEEE benchmarked 30-bus system in Fig. 1 is now analyzed for two different cases with respect to generator or load. In other words, the rest case is one where power flows from the generator to many loads. The first case is one where
power is flowing from several generators to the load. These two surroundings are shown in Figs. 5 and 6, respectively.
In First case power supplied from generator to the load among a number of loads is considered by the following:
𝑃𝑘 ,𝑙 |𝑐𝑎𝑠𝑒 −1 = 𝐹𝑗𝑙 ,𝑘 =
𝐷 𝑗𝑙 ,𝑘 𝑃𝑘 𝑗 ∈𝑐(𝑙)
𝑗 ∈𝑐 𝑙 (3)
Where c(l) are the buses coupled to the load. Then power loss joint with the generator is designed by the
ISSN (Print) : 2320 – 3765 ISSN (Online): 2278 – 8875
I
nternational
J
ournal of
A
dvanced
R
esearch in
E
lectrical,
E
lectronics and
I
nstrumentation
E
ngineering
(An ISO 3297: 2007 Certified Organization)
Vol. 3, Issue 12, December 2014
𝑃𝑙𝑜𝑠𝑠 ,𝑘 =𝑃
𝑘− 𝑁𝑙=𝑁𝐺 +1𝑃𝑘,𝑙 (4)
Case-2The power supplied from the generator to along with a number of generators to the load is designed.
𝑃𝑘 ,𝑙 |𝑐𝑎𝑠𝑒 −2 = 𝐹𝑘𝑗 ,𝑙=
𝐷 𝑘𝑗 ,𝑙 𝑃𝑙 𝑗 ∈𝑐(𝑘)
𝑗 ∈𝑐 𝑘 (5)
Where c(k) are the buses coupled to the generator the power loss joint with the load is calculated by the following
equation:
𝑃𝑙𝑜𝑠𝑠 ,𝑙= 𝑃 𝑘,𝑙 𝑁𝐺
𝑘 =1 𝑃𝑙 (6)
In a mixture of the situations described above, the power system in Fig. 1 can be indicated by total power loss shown in Fig. 7 with concern of only energy years and consumptions. The division between buses and in Fig. 7 can become an arbitrary division in Fig. 1. When the product routine of Fig. 2 is regarded, Fig. 8 reveals the difference of power loss corresponding to the dimension DG at load-concentration-bus 10 and the amount of fill intake at bus 21 in Fig. 1.
Fig7. Simplified circuit with only power generations and consumptions.
III.PROCEDURE TO SELECT OPTIMAL SIZE OF MULTIPLE DGS USING KALMAN FILTER ALGORITHM
The quantity of power consumption each area could be selected as the optimal values for the DGs to be placed. However, these are not maximum principles for the DGs because the power reduction in lines linking two buses is ignored. The Kalman filter criteria have the removing properties and the disturbance being rejected ability effective to the process and statistic sounds. In realistic surroundings (in which the declares are motivated by procedure disturbance and statement is made in the existence of statistic noise),
Where the matrices, and, and the
vector, , are known deterministic variables, and the identity matrix, , is usually chosen for the
matrix,. The state vector, , can represent the size of each of the multiple DGs or their coefficients. Also,
is the process noise vector, is the measured power loss, and is stationary measurement noise. Then, the estimate of the state vector is updated by using the following steps.
• Measurement update: Acquire the measurements, , and compute a posteriori quantities:
Where is the Kalman gain, is a positive-definite symmetric matrix, and Is a positive number selected to
avoid a singular matrix typically, is given as , where is an identity matrix.
Where is a positive-defined covariance matrix, which is zero in this study because the stationary process
ISSN (Print) : 2320 – 3765 ISSN (Online): 2278 – 8875
I
nternational
J
ournal of
A
dvanced
R
esearch in
E
lectrical,
E
lectronics and
I
nstrumentation
E
ngineering
(An ISO 3297: 2007 Certified Organization)
Vol. 3, Issue 12, December 2014
Time increment: Increment and repeat. Thereafter, the estimated output (the total power loss of the system) is calculated as
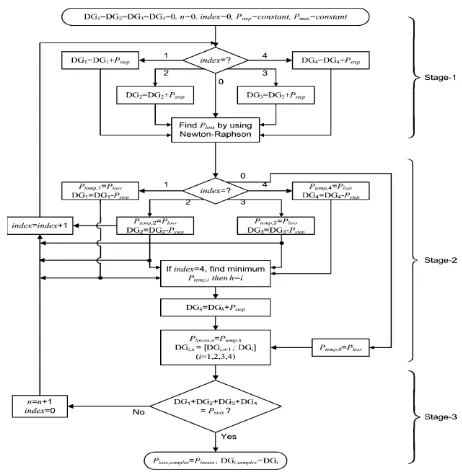
Fig. 9 shows the process to acquire information examples for the sizes of several DGs and the power reduction needed before applying the Kalman filter criteria. In Stage-1 of Fig. 9, the algorithm begins with the zero principles for all DGs, and the catalog signifies the number of given DG. Including the little bit of power, of 10 MW to each DG, the preliminary power reduction is obtained by a energy flow calculations in accordance with the Newton–Raphson Method.
Fig.9. Procedure to obtain data samples of the Kalman filter algorithm
Then, the details on the person power loss, required before applying.
corresponding to each DG improved by 10 MW is sent to Stage-2, where the of are replaced with those of. After the
lowest value of is chosen, its value and the corresponding dimensions of several DGs are saved in the memory of
and DG in Fig. 9, respectively. This process is then recurring until the complete sum of all DGs is the same as
the predefined value, in Stage-3 by increasing n to . Finally, the accumulated data of the minimum power
loss and sizes of DGs, which are respectively, are obtained.
The information examples acquired above might be dissimilar from the real values due to the giant testing period of 10 MW. If this testing period is decreased to locate more precise principles, the computational need will be significantly improved.
In Phase-1 of Fig. 10, the anticipated sizes of multiple DGs, are determined by applying the Kalman filter
algorithm with the data samples obtained from Fig. 9, which are and . Its associated
ISSN (Print) : 2320 – 3765 ISSN (Online): 2278 – 8875
I
nternational
J
ournal of
A
dvanced
R
esearch in
E
lectrical,
E
lectronics and
I
nstrumentation
E
ngineering
(An ISO 3297: 2007 Certified Organization)
Vol. 3, Issue 12, December 2014
Where is the normalize value, and is the number of last samples in . To approximation the size of
each DG, the Kalman filter algorithm is useful in series with dissimilar dimensions of in (13). After estimating the most
favorable sizes of numerous DGs in Phase-1, the overall power loss, , is estimated in Phase-2 of Fig. 10
with the power loss information samples, , from Fig. 9 and the estimated DG sizes, DG , in Phase-1. The
coupled parameters required to apply the Kalman filter algorithm are given in the following:
Where is the estimated size for each DG from (14).
Future scope:
In future we have to find out the cost function. Depending up on the cost function of dispatchable DGs used.
IV.SIMULATION RESULTS
Active power losses Reactive power losses
1.907 Mw 10.827MVAR
Power losses
Estimation performance of total power loss.
V.CONCLUSION
ISSN (Print) : 2320 – 3765 ISSN (Online): 2278 – 8875
I
nternational
J
ournal of
A
dvanced
R
esearch in
E
lectrical,
E
lectronics and
I
nstrumentation
E
ngineering
(An ISO 3297: 2007 Certified Organization)
Vol. 3, Issue 12, December 2014
REFERENCES
[1] A. A. Chowdhury, S. K. Agarwal, and D. O. Koval, “Reliability modeling of distributed generation in conventional distribution systems planning and analysis,” IEEE Trans. Ind. Appl., vol. 39, no. 5, pp.1493–1498, Oct. 2003.
[2] M. F. AlHajri and M. E. El-Hawary, “Improving the voltage profiles of distribution networks using multiple distribution generation sources,” in Proc. IEEE Large Engineering Systems Conf. Power Engineering, 2007, pp. 295–299.
[3] G. Carpinelli, G. Celli, S. Mocci, F. Pilo, and A. Russo, “Optimization of embedded generation sizing and siting by using a double trade-off method,”
Proc. Inst. Elect. Eng., Gen., Transm., Distrib., vol. 152, no. 4, pp. 503–513, Jul. 2005.
[4] T. Senjyu, Y. Miyazato, A. Yona, N. Urasaki, and T. Funabashi, “Optimal distribution voltage control and coordination with distributed generation,”
IEEE Trans. Power Del., vol. 23, no. 2, pp. 1236–1242, Apr. 2008.
[5] H. Saadat, Power System Analysis, 2nd ed. , Singapore: McGrawHill, 2004, pp. 234–227.
[6] J. J. Grainger and S. H. Lee, “Optimum size and location of shunt capacitors for reduction of losses on distribution feeders,” IEEE Trans. Power App. Syst., vol. PAS-100, no. 3, pp. 1105–1118, Mar. 1981.
[7] M. Baran and F. F. Wu, “Optimal sizing of capacitors placed on a radial distribution system,” IEEE Trans. Power Del., vol. 4, no. 1, pp. 735–743, Jan. 1989.
[8] M. A. Kashem, A. D. T. Le, M. Negnevitsky, and G. Ledwich, “Distributed generation for minimization of power losses in distribution systems,” in