Status of Measurement of R Value at BESIII
WenbiaoYan (On behalf of BESIII Collaboration)1,?
1State Key Laboratory of Particle Detection and Electronics, University of Science and Technology of China,
Hefei 230026, China
Abstract.The R value is important for muon magnetic momentaµand QED running coupling constant evaluated at Z pole, is useful to extract resonance parameters. BESIII experiment collected about 130 energy points between 2.0GeV and 4.6GeV for a precise measurement of R value. The status of R measurement at BESIII is reported in this paper.
1 Introduction
The muon magnetic momentaµ=(gµ−2)/2 has very high level of precision (∼0.5part per million) in experiment and theory, and provides a critical test of standard model (SM). a deviation of experimental measurement of SM prediction could be a hint for new physics. The SM prediction foraµis divided into three parts [1]
aS Mµ =aQEDµ +aEWµ +ahadµ (1)
The QED component aQEDµ and electroweak component aµEW are calculated with high precision, hadronic componentahad
µ is not calculable from first principle. Theahadµ has lowest order (i.e.,O(α2) ) hadronic vacuum polarization contributionahadµ ,LO, higher order(O(α3)) contributionahadµ ,HO and hadronic "light-by-light" scattering contributionahadµ ,LBL. The main source of theory uncertainty to aS M
µ is fromahadµ ,LOandahadµ ,LBL[2].
Theahadµ ,LOis calculated via dispersion relation
ahadµ ,LO= 1 3(
α π)
2 Z ∞
m2 π
dsK(s)
s R(s) (2)
whereK(s) ∝1/sis QED kernel function, andR(s) is defined as the lowest order cross section for e+e− →γ? →hadrons in units of lowest order QED processe+e−→ µ+µ−, namelyR=σ(e+e− →
hadrons)/σ(e+e−→ µ+µ−), whereσ(e+e−→µ+µ−)=4πα2(0)/3s. Because of 1/s2weight in Eq.2, contributions of R value from low energy √sare enhanced, about 75% come from region 2mπ <
√
s<1GeV dominated byππchannel [3]. The relevant energy scale in Eq.2 is too low for applying 4-loop pQCD calculation on R value, experimental R values for some energy region are used in Eq.2. The precise measurement of R value could reduce theory uncertainty ofahadµ ,LO. As an example in Ref. [2], R values by sum of experimental exclusive cross sections are used up to 1.8GeV; R values in
energy range 1.8-3.7GeV and above 5GeV are calculated with 4-loop pQCD calculation; experimental R values in open charm region 3.7-5GeV are used; contributions from narrow resonance J/ψ and
ψ(3686) are described by Breit-Wigner line shapes with currently best known parameters. The BESIII experiment is operated at Beijing Electron Positron Collider II (BEPCII) with beam energy 1.0−
2.3GeV, we could provide R values between 2.0GeV and 4.6GeV with energy scan method, and measure cross sections of exclusive processes for R values below 2.0GeV with initial state radiation method at BESIII, see Ref. [4] for more detail.
Unlike case ofahadµ ,LOandaµhad,HO, there is no direct experimental input for theahadµ ,LBL[5]. How-ever, by using dispersion theory, theahadµ ,LBLcan be written as a convolution of integral kernels and two meson-photon transition form factor (TFF) [6]. The experimental data or theoretical models on TFF could be used forahadµ ,LBL. BESIII could measure space-like TFF ofπ0,ηandη0with two-photon process, see Ref. [7] for more detail.
The QED running coupling constant,α(s)=α(0)/(1−∆αlep(s)−∆αtop(s)−∆α5
had(s)),at Z pole,
is an important ingredient of SM fit to electroweak precision data [8]. similar toaµ, uncertainty of
α(M2
Z) is dominated by hadronic vacuum polarisation in∆α
5
had(M
2
Z), which is calculated by
∆α5
had(M
2
Z)=− α(0)M2
Z
3π Re Z ∞
m2 π
ds R(s) s(s−M2
Z)−i
(3)
Contrary toahadµ ,LO,∆α5had(M
2
Z) is not dominated by uncertainty of R values at low-energy data, but by
contributions from all energy regions [8]. The uncertainty ofα(M2
Z) could be improved with precise
measurement of R values at BESIII.
Above open flavour thresholds where resonance structures show up, we could use R values to determine parameters of resonances withJPC = 1−−, e.g. ψ(3770), ψ(4040), ψ(4160) and ψ(4410). The are good agreement between data and pQCD calculation onτdata, a precise measurement of R values at BESIII energies could provide a test of 4-loop pQCD calculation on R value and determine strong coupling constant.
2 BESIII data
BESIII Collected data between 2.0GeV and 4.6GeV for R value and QCD studies. At 2012 run, BESIII collected data at √s=2.232GeV,2.400GeV,2.800GeV and 3.400GeV with about total inte-grated luminosity 12 pb−1. We use it to build up R analysis frame and methods for Monte Carlo (MC) tuning. There are 104 energy points between 3.85GeV and 4.59GeV with about integrated luminosity 800 pb−1at 2013-2014 runs, and it is a fine R scan for R value, high mass charmonium lineshape and resonant parameters. There are 22 energy points between 2.0GeV and 3.08GeV with total integrated luminosity 500 pb−1at 2015 run. It is for R value and QCD study.
3 Measurement of R value
In experiment, R value is determined by
R= Nhad−Nbkg
σ(e+e−→µ+µ−)· L ·
had·(1+δ)
(4)
3.1 Measurement of integrated luminosity
The integrated luminosity is measured with large angle Bhabha processe+e−→(γ)e+e−and diphoton processe+e−→(γ)γγ[10], which are well known in QED, and simulated by generator Babayaga v3.5 with precision 0.5%. The uncertainty of measured luminosity is about 0.8% and 1.1% for Bhabha process and diphoton process respectively. Fig. 1 shows ratio ratios of luminosity measured by e+e− → (γ)e+e− ande+e− → (γ)γγ, the two methods give fully compatible results within quoted uncertainties.
Figure 1.The ratio ratios of integrated luminosity measured bye+e−→
(γ)e+e−
ande+e−→
(γ)γγ
3.2 Radiative correction factor
The hadronic cross section directly measured in experiment is total cross section σtot, with con-tribution from tree level and higher order Feynman diagrams, however, R value only has contri-bution by tree level σ(e+e− → hadrons), The radiative correction factor (1 +δ) is defined as
σtot/σ(e+e− →hadrons). With help of ISR theory, the (1+δ) could be calculated by Feynman dia-gram (FD) scheme and structure function (SF) scheme [11]. Fig. 2 compares (1+δ) for FD scheme (marked as Crystalball) and SF scheme (marked as WU and Kureav & Fadin), which are consistent with 1.2% with same input of R values in PDG2016 [1].
3.3 Background event
The background of hadronic event has two sources, Beam-associated backgrounds and QED pro-cesses. The Beam-associated backgrounds, such as beam-gas and beam-wall events, are non-collision backgrounds in hadronic events, and are estimated by sideband method with average event vertex in Z direction. The possible background from QED processes are Bhabha event, diphoton event,e+e−→
(γ)µ+µ−,e+e−→(γ)τ+τ−and two-photon processe+e−→e+e−+X (X=leptons or hadrons), their contributions to hadronic event are determined with MC samples, which is scaled with luminosity of experimental data.
The Bhabha and diphoton are simulated with Babayaga v3.5 and BabayagaNLO, The generator Babayaga v3.5 and Phokhara9.1 are used fore+e−→(γ)µ+µ−. Thee+e− →(γ)τ+τ−is simulated by generator KKMC. The contribution two-photon process is underestimated by BESTwoGam generator. According to reference [12] and number of good track selection criteria for hadronic event, we use dedicated generator for dominant exclusive processese+e−→e+e−e+e−,e+e−→e+e−µ+µ−,e+e−→
e+e−π+π−,e+e− → e+e−K+K−,e+e− → e+e−ηande+e− → e+e−η0, these generators are tested by two-photon study at BESIII [7]. The cross section of exclusive decays in two-photon process is tiny [12], and negligible.
3.4 Hadronic event generator
The hadronic event selection efficiency is determined by hadronic event MC sample, which should describe experimental data well. We developed two generators LUARLW [13] and ConExc [14] for R measurement.
The well-known generator JETSET is not built to describe few-body states (in particular at few GeV level), the generator LUARLW based on the Lund area law is proposed to simulates hadronic event productions ine+e−annihilation and decays of continuous and resonant hadronic states from 2mπ up to 5 GeV [13]. After we compare distribution of BESIII experimental data and LUARLW generator, parameters in LUARLW are determined by MC tuning process. The tuned LUARLW gen-erator should describe experimental data for most of distributions, especially for those distributions, which are sensitive to hadronic event selection, e.g. multiplicity, polar angle cosθof charged track. As an example, Fig. 3 displays comparison between experimental data and LUARLW on multiplicity (left) and cosθof charged track (right) for selected hadronic events. The LUARLW generator could describe experimental data well.
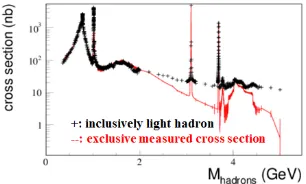
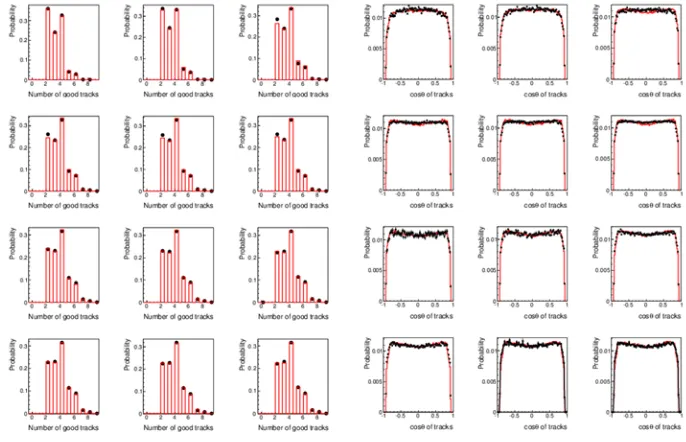
Many exclusive modes have been measured in thee+e−collision experiments. We use published Born cross sections in paper, and show sum of these cross sections in Fig. 4. We could take into ac-count these known processes in generator for hadronic event, and use following strategy for ConExc generator [14]. (1) Phokhara9.1 is applied for 11 exclusive processes with know cross section and structures, (2) For processes with only known cross section, phase space model is used for multi-body decays. angular distributions are implemented only for two-multi-body decays. (3) For unmeasured processes are simulated by LUARLW. The parameters LUARLW generator are optimized with pa-rameterized response function method. The optimal values are obtained by simultaneously fitting this function to experimental data distributions [14]. Fig. 5 shows comparison between experimental data and ConExc generators. The ConExc generator could describe experimental data well.
3.5 R value at BESIII
Figure 3.The distributions for multiplicity (left) and cosθof charged track (right), the black points are distribu-tion of experimental data, where contribudistribu-tion from background events are already subtracted, the red histogram are obtained by LUARLW generator.
Figure 4.The cross section for light hadron production, where black points with errors are total hadronic cross section [1], and histogram is sum of measured cross sections for exclusive processes
for R scan between 3.85GeV and 4.6GeV is performed, and a set of reasonable MC parameters is obtained.
4 Summary
Figure 5.The distributions for multiplicity (left) and cosθof charged track (right), the black points are distribu-tion of experimental data, where contribudistribu-tion from background events are already subtracted, the red histogram are obtained by ConExc generator.
5 Acknowledgement
This work is supported by National Natural Science Foundation of China under Contract NO. 11475164 and No. 11335008.
References
[1] C. Patrignani et al., (Particle Data Group), Chinese Physics C,40100001 (2016) [2] Michel Davier, Nuclear and Particle Physics Proceedings,287-28870 (2017) [3] Fred Jegerlehner, EPJ Web of Conference,118011016 (2016)
[4] Martin Ripka, in these proceedings [5] Joaquim Prades et al., arXiv:0901.0306
[6] Fu-Guang Cao, Nuclear and Particle Physics Proceedings,287-28839 (2017) [7] C. F. Redmer, in these proceedings
[8] Andreas Hoecker, Nucl. Phys. Proc. Suppl.,218189 (2011) [9] N. Berger et al., Chinese Physics C34, 1779 (2010)
[10] M.Ablikim et al., (BESIII Collaboration), Chinese Physics C,41063001 (2017) [11] H. Hu et al., High Energy and Nuclear Physics,25701 (2001) in chinese [12] V.M. Budnev et al., Phys. Rep.15181 (1975)
[13] Bo Andersson and Haiming Hu, arXiv:hep-ph/9910285;
Haiming Hu, Nuclear and Particle Physics Proceedings,287-28861 (2017) [14] Ronggang Ping et al., Chinese Physics C40, 113002 (2016);