Copyright to IJIRSET www.ijirset.com 5528
Seasonal variation of PM
10
around an
upcoming airport
Arun Kumar Mishra
1, Prabhat Srivastava
2, R. S. Patil
3Assistant Professor, Department of Civil Engineering, .M.M.M. Govt. Engg. College Gorakhpur,.U.P.India1
Professor & Head , Department of Civil Engineering, S.P.College of Engg. Andheri, Bombay,,India 2
Professor, Emeritus, Department of CESE, IIT Bombay,Mumbai,, India 3
Abstract: In this paper an attempt has been made to study the variation of PM10 at different receptor locations
around an upcoming airport at Navi Mumbai, India. Air monitoring was carried out during all seasons in the base year i.e premonsoon, monsoon, post monsoon and winter season and results were analyzed. It was observed that overall yearly average concentrations of PM10 are lower than permissible lower limit of CPCB except two stations.
It was found that PM10 concentrations were highest during winter season and PM10 is decreasing during pre
monsoon, monsoon and monsoon seasons. Aviation affects the environment through the emission of pollutants from the aircrafts and other supporting airport infrastructure facilities, resulting on human health and the atmosphere. Emitted pollutants resulting from the aircrafts include green house gases and particulates matter that contribute to forcing of climate and gases and particulate matter that are harmful to human health. Navi Mumbai in the state of Maharashtra, India has been chosen as the study area. The PM10 concentrations were compared with the National
Ambient Air Quality Standards (NAAQS).
Key words : Airport, PM10, secondary particles,NAAQS
I INTRODUCTION
ISSN: 2319-8753
I
nternational
J
ournal of
I
nnovative
R
esearch in
S
cience,
E
ngineering and
T
echnology
(An ISO 3297: 2007 Certified Organization)
Vol. 2, Issue 10, October 2013
Copyright to IJIRSET www.ijirset.com 5529
II DESCRIPTION OF THE STUDY AREA
The site of Navi Mumbai airport is selected near Panvel town in an area admeasuring 2347 acres of land which is situated about 45 km away from the CBD of Mumbai/Santacruz airport. The airport is planned with two runways of 3700 M with parallel taxiways designed to suit the new generation large aircraft. The other facilities include the domestic terminal, international terminal, cargo terminal, airfield lighting, city side facilities etc. The phase wise development approach has been adopted to suit the air travel demand
The study area shown in Figure 1 covers the area around the airport falling within the radius of 10 kms. The study area is further divided in two parts namely core area and fringe area. The core area covers the area within the radius of 10 km, in which all the scooped environmental parameters have been studied to understand the magnitude of impact. In the remaining area i.e. fringe area places of historical importance, aesthetics, cultural including
environmentally sensitive have been studied
Copyright to IJIRSET www.ijirset.com 5530
Fig 1: Location map of Navi Mumbai International Airport
III SAMPLING AND ANALYSIS
Air quality assessment of the project area was carried out by monitoring the pollutants at different receptor locations
(Fig.2). The pollutants which were monitored are;, Total Suspended Particulate Matter (TSPM), Respirable
ISSN: 2319-8753
I
nternational
J
ournal of
I
nnovative
R
esearch in
S
cience,
E
ngineering and
T
echnology
(An ISO 3297: 2007 Certified Organization)
Vol. 2, Issue 10, October 2013
Copyright to IJIRSET www.ijirset.com 5531
Hydrocarbons (HC). The selections of stations were based on WHO (1981) guidelines. The monitoring was done
during all seasons of the base year i.e premonsoon, monsoon, post- monsoon and winter season at a frequency of
twice a week at each station for 24 hours. Respirable Dust Sampler and High Volume Sampler were used for
monitoring of RPM, TSPM and gaseous pollutants like SO2 and NOx. To monitor the traffic pollutant Carbon
Monoxide, a portable multi gas monitor with digital display was used. CO pollutant was monitor at all the 10
locations at a frequency of twice a week at each station for 24 hrs. Anemometer was used to note the wind speed
and direction. Digital thermometer was used to record the existing temperature. Horizontal and vertical dispersion
parameters were taken based on the atmospheric stability class B and downwind distance.
Copyright to IJIRSET www.ijirset.com 5532
ISSN: 2319-8753
I
nternational
J
ournal of
I
nnovative
R
esearch in
S
cience,
E
ngineering and
T
echnology
(An ISO 3297: 2007 Certified Organization)
Vol. 2, Issue 10, October 2013
Copyright to IJIRSET www.ijirset.com 5533
Table 1: Location of the Air Monitoring Stations in the Project Area
Sr.
-
Station
Code -
Station
Remarks
1.
PCO
Panvel CIDCO Office
Location of meteorological station
and in residential zone
2.
KRS
Khandeshwar railway station
Commercial activity centre
3.
KCO
Kalamboli CIDO Office
Receptor oriented as it is in
residential zone
4.
KNO
Kharghar Nodal Office
Receptor oriented as it is in
residential zone
5.
BCB
Belapur CIDCO Bhavan
Major commercial activity centre,
heavy traffic movement
6.
PHS
Pargaon High School
Rural and mixed area
7.
GWT
Gavanphata Water Tank
Near to main Traffic Junction and
hence heavy traffic movement
8.
ACL
Ambuja Cement Ltd.
Industrial activity centre
9.
KGH
Kille Gaothan Gueust House
Receptor oriented as it is in
residential zone
Copyright to IJIRSET www.ijirset.com 5534
Table 2: Traffic growth rate for different links
Category
Car, Taxi, Van
2/3 Wheelers
Buses
Trucks
Upto 2008
4.5
10.0
5.0
7.5
2009-2015
4.5
10.0
5.0
6.0
2015-2030
4.0
10.0
5.0
3.0
IV RESULTS AND DISCUSSION
In this study the mass concentration of PM10 and its associated chemicals constituents analyzed. Results obtained
from the analysis were compared from the standards prescribed by CPCB and these results are given in following
table 3
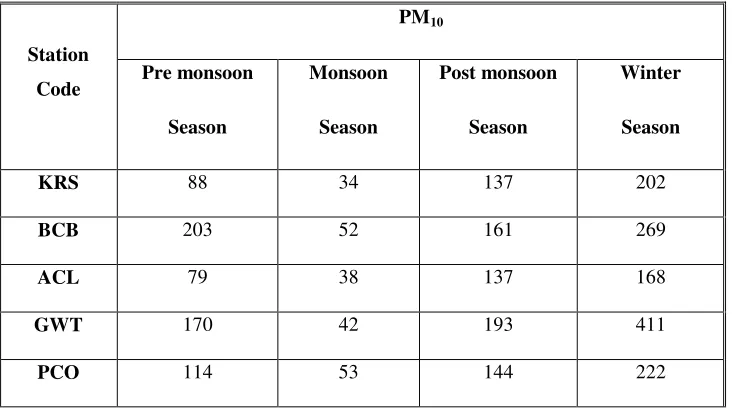
Table 3: Average values of different air pollutants concentration at various stations of the study area during winter season
Station Code
PM10
Pre monsoon Season
Monsoon Season
Post monsoon Season
Winter Season KRS 88 34 137 202
BCB 203 52 161 269
ACL 79 38 137 168
GWT 170 42 193 411
ISSN: 2319-8753
I
nternational
J
ournal of
I
nnovative
R
esearch in
S
cience,
E
ngineering and
T
echnology
(An ISO 3297: 2007 Certified Organization)
Vol. 2, Issue 10, October 2013
Copyright to IJIRSET www.ijirset.com 5535
KCO 137 45 193 259
KNO 113 38 125 176
PHS 105 53 161 170
KGH 112 32 116 210
PGH 107 38 117 199
V CONCLUSION
The average concentrations of PM10, in the study area during post monsoon season were in the range of
116-193 µg/ m3 ,
The average concentrations of, PM10, in the study area during winter season were in the range of 170-411
µg/ m3
The average concentrations of PM10, in the study area during pre monsoon season were in the range of
79-203 µg/ m3 ,
The average concentrations of PM10, in the study area during monsoon season were in the range of, 32-53
µg/ m3
The average concentrations of PM10, NOx, SO2, NH3, CO and HC in the study area during winter season
were in the range of, 170-411 µg/ m3 , 20.4-32.0 µg/ m3 ,3.4-4.7 µg/ m3 , 27.0-37.6 µg/ m3 , 0.6-0.8 µg/ m3 , 2.01-2.30 µg/ m3 respectively.
Air monitoring results of the study period showed that PM10 were highest during winter season whereas
concentration of PM10 was observed to be decreased during pre monsoon, monsoon and post monsoon season.
Winter season is the worst time for air quality, since surface atmospheric temperature drops down with an
inversion condition. Little mixing or dilution of pollutants takes place at this stability condition (low mixing
height) of the atmosphere and hindered pollutant dispersion during winter months. Moreover, suspended
particles in the study area are natural and not chemical in nature and may not have adverse effect on human
Vol. 2, Issue 10, October 2013
Copyright to IJIRSET www.ijirset.com 5536
VI ACKNOWLEDGEMENT
The authors are thankful to Dr Omkar Dixit and Dr. Mukesh Sharma, Professors, Civil Engineering Department, I.I.T. Kanpur-208016 (U.P.), India for their valuable guidance and suggestions
.
REFERENCES
[1] Barman. S.C., R. Singh, M.P.S Negi and S.C. Bhargava. Fine particles (PM2,5) in residential areas of Lucknow city and factors
influencing the concentration. Clean Soil Air Water, Vol.36, pp. 111-117, 2008
[2] Caselles, J., C. Colliga and P. Zornoza: Evaluation of trace elements pollution from vehicle emissions in Petunia plants. Water Air Soil Pollut., 136.1-9 (2002).
[3] CPCB: (1994). “National Ambient Air Quality Standards”. Central Pollution Control Board. Gazzete Notification, New Delhi
[4] Curtis. L.W. Rea, P.Smith-Willis, E. Fenvyes and Y. Pan: Adverse health effects of outdoor air pollutants. Environ. Intern., Vol. 32, ,
pp.815-830, 2006
[5] Fang, G.C., Y.S. Wu, S.H. Huang and J.Y. Rau: Review of atmospheric elements in Asia during 2000-2004. Atmos.Environ., Vol. 39,
pp.3000-3003, 2005
[6] Jayaraman, G.N.:2007 “Air quality and respiratory health in Delhi”. Environ. Monitoring. Assesses DOI 0.007/s 1066-007-965-007- [7] Kaushik, CP., K. Yadav: Assessment of ambient air quality in urban centres of Haryana (India) in relation to different anthropogenic activities and health risk. Environ. Monit. Assess.,Vol. 122, , pp. 27-40, 2006
[8] Kumar. A.V., R.S. Patil and K.S.V. Nambi: Source appointment of suspended particulate matter at two traffic unction at Mumbai., India. Atmos. Environ., Vol.35, , pp.4245-425, 2001
[9] Nolte. C.G., J.J. Schauer, G.R. Cass and G.R. Simoneit: Trimethylsilyl derivatives of organic compounds in source samples and in atmospheric fine articulate ,matter. Environ. Sci. Technol., Vol.36, pp.4273-4281, 2002.
[10] Sagai.M., A. Furnayama and T. Ichinose: Biological effects of diesel exhaust particles (DEP). III. Pathogenesis of asthma like symptoms in mice. Free Rad, Biol.Med., Vol.21, pp.199-209, 1996.
[11] Schwartz, J., D.W. Dockery and L.M. Neas: Is daily mortality associated specifically with fine particles ? J. Air Waste Manage. Asso., Vol.46, pp.927-939, 1995.