Dutch Delta Resiliency by Societal Learning
1
Introducing the Intertwined Process of Daily Practice and
2
Theory Development
3
Dr. F.C. Sanders MSc. MBA1 Senior-Fellow2 ORCID: 0000-0003-1180-4656
4
1 Delft University of Technology, Architecture and the Built Environment, Urbanism
5
2 TSM Twente School of Management, Enschede in the Netherlands.
6
E-Mail: [email protected] - Mobile phone: +31 654773140
7
8
Abstract: The Wester coastal Delta zone of the Netherlands is the relatively more crowded area of
9
the country where ten of the seventeen million people live. The governmental prognosis is that
10
this number of people will increase steadily in the coming decennia, unless the threat of
climate-11
change seawater level rising. This is the picture in more Delta zones globally what makes the topic
12
of resiliency for these delta-areas of importance. Approaches of resiliency are often dominated by
13
governmental rescue planning and believe in technology solutions, while in the process the
behav-14
iour of people can make the difference in overcoming climate-change impact disasters. In the
15
struggle against high water storming and flooding, the Dutch people prove this by developing
so-16
cietal resilient behaviour in a broad spectrum of activities. Post-PhD research on Dutch resilient
17
behaviour in the in 1016-flooded Zaanstreek-Waterland area near the city of Amsterdam confirms
18
that. Recently research by questionnaire among citizens in this region shows that people have
fa-19
vour for shared responsibility with government and related professional organizations. The Dutch
20
examples of societal resiliency carried by people also show a action-learning perspective
inter-21
twined with governmental contingency planning. Therewith the Dutch practice shows a positive
22
cross-fertilization of practice and knowledge development.
23
Keywords: water-resilience; climate-change; action-learning; and resident-empowerment
24
25
1. Dutch practice of Climate-change ‘Water Resilience’ 1 (Sanders, 2018)
26
An Old Dutch saying tells ‘God created the world, but the Dutch created the Netherlands’,
un-27
less the fact that in the past the Western part of the country counted flooding regularly. History tells
28
us about the highlights; how the severe storms of 1421 and 1675 for instance braked through dunes
29
and dikes by which layers of peat poured into the sea disturbing the landscape creating open water
30
areas in the countryside, with new threats for the people. Unless these water areas were made dry
31
in later decennia, creating ‘polders’, in more recent times the floods of 1916 and the last flood of
32
1953 unexpectedly again set large polder land areas under water (Aten, 2009). The most severe
33
floods though stimulated the Dutch to start defence planning, as these were:
34
• The ‘Saint Nicolas’ flooding of 1196 in the Northwestern part of the country, near the city of
35
Alkmaar, by seawater braking through the dunes using an old gully. The villages in the area
de-36
cided to build a new dike for protection and they divided the work. The effect was the creation
37
of the first Water-authority in the Netherlands by Count Willem I in 1214.
38
• The ‘Saint Elisabeth’ flooding of 1421 resulted in sea-dikes breaking in the Southwestern and
39
Northwestern row of dunes resulting in the seawater finding its way to the land. Almost thirty
40
villages flooded and 2.000 residents did not survive.
41
1 The former RRAU18 post-PhD congress paper on resilience among residents of the
• The flooding of 1916 resulted in sea-dikes and river-dikes succumbed to damage because of the
42
combination of a severe storm and heavy rainfall. The most affected was the ‘Waterland’ area
43
North of Amsterdam, which flooded completely. There were only three casualties.
44
• The flooding of 1953, caused by breaking of dikes along the whole Dutch coastal line from South
45
to North, resulted in severe damage to villages, infrastructure, and the water defence system; in
46
addition to the severe damage, 1836 people died. This disaster motivated the decision of the
na-47
tional government to build a complete new water defence system to defence the Western Delta
48
called the ‘Delta-works’ [Dutch: ‘Deltawerken’].
49
The Dutch learned from these accidents and every disaster was followed-up by new and better
50
delta defence water resistant constructions(Aten and Wieringa, 2015). With the ‘Delta Plan’
devel-51
oped after the flood of 1953 the country should be defended against storms and high tide
combina-52
tions, whereby the dikes were upgraded to what is called the delta-level related to a chance of
ex-53
ceeding of ‘one in a million years’
54
In 2016 the EO local television broadcast organization presented a drama series in the
Nether-55
lands concerning ‘What would happen when the dikes break’ [Dutch; Als de dijken breken’] by
56
Johan Nijhuis creator and Hans Herbots cineaste. This series played on the growing interest among
57
the Dutch people for the topic of seawater raise dangers as a result of climate-change, and included
58
a call to the national government for better information concerning the personal risks of people and
59
their houses. The result was that the national governmental organization for water defence called
60
‘Rijkswaterstaat’ consulted experts, started-up informational processes, and opened a website by
61
which every household could review what the current risks are and how far their house lays below
62
seawater level [www.overstroomik.nl]. In addition, a report on the risks of flooding for common
63
people came available (Vergouwe, 2016). The maps out of this report show the threats of
climate-64
change for the Netherlands coming from the rising see level and heavy rainfall both. Concerning
65
the rainfall, the increasing intensity of rainfall will not only increase the water influx from the East,
66
but also the ‘polders’ maintenance will the suffer difficulties with pumping capacities, see figure 1.
67
68
Figure 1. Showing flooding [left] en economic effects of flooding risks [right] (Vergouwe, 2016).
69
This www.overstroomik.nl website of the ‘Rijkswaterstaat’ department features the opinions of
70
specialists to explain the current situation to the Dutch people to address their role and
responsibili-71
ties too, accompanied by information what they could do themselves for reducing their risks:
build-72
ing housing different, more green gardening for water storage inside cities and showing interest for
73
civilian movements and organizations that are related to water safety programming.
74
The forecast for the Netherlands is that climate-change will make this situation worse in the
75
coming decennia, the seawater level will rise and storms will become more severe, because large
76
areas of the Netherlands are situated below sea level in the past. Today it is up to 6,7 meters minus
77
For the Dutch situation every structural seawater-level rise can be far-reaching and will influence
79
the circumstances of the people and their land, whereby the national and global debate on
sea-80
water-level raise development (IPCC, 2007) (UN, 2015) (Delta-commission, 2017) (Deltares, 2018)
81
undoubtedly influences the feelings and worrying of the people.
82
That’s why a former post-PhD research focussed on the resiliency of the people behaviour in
83
such flood disaster situations, research done in the Zaanstreek-Waterland area situated adjacent to
84
Amsterdam a 100 years after the 1916 flooding (Sanders, 2018). This area, however, concerns a rural
85
area in the situation of nowadays that most people live in cities increasingly. Which implicitly
86
makes it important for a total picture to expand this research into the city. For the new added
re-87
search the research question remains unchanged:
88
How do people act resilient, in a context of governmental disaster management?
89
The answer on this research question is sought in the combining of both research results by;
90
presenting the Dutch resiliency developed attitude first [chapter 2] with working-out a definition
91
for ‘water resilience’ [chapter 3], with subsequent the presentation of these research results
[chap-92
ters 5, 6 and 7], for working-out conclusions and thoughts [chapters 8 and 9].
93
2. Dutch Practice of Action-Learning Resiliency Developments
94
New circumstances have challenged the Dutch people develop resilient behaviour in recent
95
years, climate change not only water related mostly. This development makes it important for
gov-96
ernment and the people themselves to understand their resilient behaviour better. These other
cir-97
cumstances therewith influence the context the Dutch people are living in nowadays, what makes it
98
worthwhile searching for patterns in these developments, that are:
99
• The Northwest of the Netherlands is suffering by mild earthquakes caused as the result of many
100
decennia of emptying the gas fields (Van der Voort and Vanclay, 2015). Since the first 1986
101
earthquake [Richter 3.0] the total of 1269 [until November 2018] seismologic incidents took
102
place.2 A 2014 focus-group research proved that 60% of the area residents accepts this calmly,
103
and for 20% decreased confidence in government (SPG, 2014).
104
• In the Northwest of the country milder seismologic turbulences are felt, caused by emptying
oil-105
bearing layers in the last century; in the villages Anna Paulowna 2015 [Richter 1.5 and Warder
106
2018 [Richter 2.5]. Unless the villagers experienced little of this, local government because of the
107
Groningen experience started up a network of measuring points.
108
• Heavy clustered rainfall and longer periods of dry weather due to climate change show to be
109
increasingly of negative influence on the Dutch agricultural sector, and do cause inconveniences
110
in the cities as flooded tunnels too.3
111
• The great rivers flowing from Germany into the Netherlands have disturbing periods of very
112
low and very high water due to melting of the glaciers in the Alps (Bresser et al., 2005) (Vellinga
113
et al., 2014), causing inconvenience for shipping and nearby housing. This encouraged the
de-114
velopment of floating housing in the river flood plain areas, and in 2007 an investing program
115
for giving these river in the Netherlands more space was started by government.
116
• Near the coast the hinterland suffers of salinization during periods of prolonged drought by
117
seepage through the dunes because of the extra water-level differences (Van Bakel et al., 2009),
118
what effects agricultural production of potatoes and flower bulbs two major export product of
119
the Netherlands. Branch associations [KAVB and LTO] started discussion with their member in
120
recent years, to mobilize awareness under the agricultural enterprises and for pressuring
gov-121
ernment to take reducing measures.
122
2 https://www.nam.nl/feiten-en-cijfers/aardbevingen.html
These examples show resiliency developments in the Netherlands whereby area residents and
123
government cooperate together, in every situation in a different equilibrium, the government often
124
takes the initiative, but citizens and citizen organizations also take the initiative, or a combined,
125
start-up, start-up. Evidently, this combination delivers positive results, in two indexes scoring
resil-126
ienness Dutch cities are on the top of these lists; The ‘Sustainable Cities Water Index’ identifying
127
cities harnesses water assets for their long term advantage; 1. Rotterdam, 2. Copenhagen, 3.
Am-128
sterdam.4
129
3. ‘Water Resilience’ Defined
130
‘Climate Resilience’, which includes ‘Water resilience’, has been given a number of expressions
131
depending on the focus chosen, by people related to climate-change. Resilience focuses on the
abil-132
ity to handle, as a society, mobilizing the capacity to adapt to extreme undesirable changing
cir-133
cumstances (Nelson et al., 2007). Concerning the far-reaching circumstances of climate-change,
134
which can be severe storms, severe rainfall, seawater rising, loss of bio-diversity, and economic
135
recession; many of these climate change examples are water related.
136
Adaptation to such extreme external stimuli and stress to Nelson should be seen as a system
137
wide result from which the social component and social actors behaviour could be made particular;
138
see the cycle of ‘Adaptedness and resilience’ figure 2. Nelson sketches the slight differences
be-139
tween adaptation and resilience. Resilience concerns the power of people to learn and to develop
140
resilience capacity more than adaptation (Berkhout et al., 2006). Resilience therefore is a process of
141
development making the system of adaptation stronger by every new experience (Walker et al.,
142
2002).
143
144
Figure 2. Showing the cycle of ‘Adaptedness to Resilience’ (Nelson et al., 2007).
145
According to Nelson, the resilience approach is unfortunately narrowed down to mainly the
146
technological and governmental policy approach (Holling, 1973). Resilience though should be seen
147
as an ecological reaction that cannot be considered void of peoples’ action and behaviour (Nelson et
148
al., 2007). Searching for resilience requires exploring and defining variables to create vulnerable
149
preconditions and action-prospects for the time an impact takes place (Tompkins and Adger, 2004).
150
The understanding of ‘Climate resilience’ has developed in the past four decades along with
151
the understanding of climate-change (Martin-Breen and Anderies, 2011). Originally in the sixties of
152
the past century resilience became ecologically related and initially outlined as ‘the capacity for
153
ecological systems to persist and absorb changes’. By which ecological systems are described as
154
from nature searching for the equilibrium towards some stable prior point under all circumstances
155
(Holling, 1973). In the years after these ecological systems were seen less stable and functioning in a
156
dynamic surrounding by adaptive management and environmentally limited resources (Holling,
157
1973). In the seventies the resilience phenomenon became connected to social science in a more
158
evolutionary approach and transformed in the eighties to a reacting system approach through
159
4
which external stresses could be offended. In the nineties when the issue of global-warming
160
emerged resilience became related to change (Pelling, 2010). Resilience related to
climate-161
change water flooding became an important new issue of growing attention from the beginning of
162
the twenty-first century. The extreme flooding of New Orleans, New York are examples of that
163
(Sebastian et al., 2017).
164
4. Dutch ‘Water Resilience’ by People’s Behaviour
165
Taking responsibility has always been a part of the mentality only the incentives have changed
166
and become more urgent due to climate-change developments. (Wiering and Winnubst, 2017).
167
Dutch experts with knowledge of this new defence systems today advise globally to make flood
168
defence barriers in the USA, India and South America concerning several cities over the last years.
169
Remarkably some of these cities managed to recover much faster then the others unless nothing
170
profound was done yet. The city of New York for example recovered in 2012 from the Sandy
hurri-171
cane in only a number of weeks while New Orleans is still starting up the recovery of the Katrina
172
hurricane from 2005. The difference should possibly be the behaviour of the residents, how they
173
took initiative and started-up cleaning and recovery tasks. This likely proves that the action
pro-174
spects of the people does make the difference to make cities resilient for water flood disasters not
175
just technology and governmental ruling alone (Chamlee-Wright and Storr, 2011).
176
Recently in 2017, Delft University of Technology in a ‘Hacketon’ session of researchers and 80
177
students discussed the tropical hurricane ‘ Harvey’ that hit Houston Texas USA on August 17th
178
2017. In a four-day period the areas received more than a 1,000 mm of rain as the system slowly
179
meandered over eastern Texas and adjacent waters, causing catastrophic flooding, with peak
accu-180
mulations of 1,539 mm with made Harvey the wettest tropical cyclone on record in the United
181
States. The resulting floods inundated hundreds of thousands of homes, displaced more than 30,000
182
people, and prompted more than 17,000 rescues’. One of the conclusions generated by 3D mapping
183
analyses studying the flooded area and the city development of Houston over the last decennia
184
found that new housing built in recent decennia’s replaced former ‘swamp’ water storage areas that
185
surrounded the city. Since 2001 over a period of 15 years the Houston had grown 23% without
tak-186
ing into account new water collection facilities (Sebastian et al., 2017). The residents of Houston
187
showed the self-reliance of concerned residents. Volunteer firemen, neighbourhood’s brigades,
188
individual residents, and others mobilized themselves by successfully rescuing area residents and
189
managing the reconstruction afterwards.
190
Comparing the disastrous flood hurricane effects of ‘Katrina’ New Orleans August 29th 2005,
191
‘Sandy’ New York October 30th 2012 and ‘Harvey’ Houston August 17th, these severe USA
hurri-192
canes of the 21-century show remarkable differences in reconstruction speediness’, see figure 3.
193
Unless ‘Sandy’ hit New York enormously by which 650.000 houses became uninhabitable and
194
downtown Manhattan became flooded, the city recovered very fast after the hurricane. After only a
195
number of days Manhattan was again in business. In the surrounding areas people left their houses
196
to other places making place for new housing developments. The New York city council asked
197
Henk Ovink from the Netherlands to be their special advisory to take the damage as a change for
198
building a better city back, for transforming New York to a resilient region (Ovink, 2014). Houston
199
the young the damage to the city is, already making recovering progress as well. New Orleans
piti-200
ful for the residents is still starting-up the recovery from the ‘Katrina’ hurricane of 2005 years longer
201
ago. As Henk Ovink wrote in his report to the New York council, what the city needs is ‘Working
202
together to build a more resilient region’. Like the Houston residents after ‘Harvey’ showed, the
203
205
Figure 3. USA hurricanes left to right: Sandy, Sandy, Katrina, Harvey [source: Wikipedia].
206
Europe has laid in the shadow zone of these hurricanes in the past decennia. It was in autumn
207
2017 that the first Atlantic hurricane in 100 years reached the coast of Ireland. It was on the 17th of
208
October 2017 that ‘Ophelia’ hit the mainland. It became the first time that Ireland needed a national
209
storm alert. 120.000 houses lost electric power and three people were killed by the storm. According
210
to ‘The New York Times’ the latest comparable storms were in 1893 and 1961. According to Ovink,
211
Europe will become more vulnerable to hurricanes as a result of climate-change in the coming
212
years. However, it will not be the storms but, the water nuisance from heavy rainfall and seawater
213
rice that will cause the damage and threat (Ovink, 2014).
214
Surprisingly in the reports of these hurricane disasters little information is given about the role
215
of residents in the recovering of the cities concerned. Their contribution is mentioned as important
216
and indispensable in many of the witness reports and related research. It becomes unclear what the
217
role of residents is in overcoming climate-change disasters, how these are mobilized, and what their
218
motivation factors are. Because climate-change disasters are predicted to increase in intensity and
219
frequency, the importance of fulfilling these knowledge gaps is obligatory. Therefore a comparative
220
case in the Netherlands was used because the Netherlands has a history of struggling with water
221
disasters since its existence. Additionally, there is conformity of the lack of knowledge with the
222
Dutch research on the theme of resident-initiative and resident responsibility. Research done
re-223
cently concerning sustainable city refurbishing and reintroducing neighbourhood responsibility
224
group programs could be used as the ‘body of knowledge’ for this new research on ‘Water
resili-225
ence’ (Sanders, 2014) (Sanders and Van Timmeren, 2017a) (Sanders and Van Timmeren, 2017b).
226
5. Exploring the ‘Zaanstreek-Waterland’ Societal Resiliency
227
In 2016, research was done that focused on the water-consciousness and self-reliance of the
228
Dutch people in the Northwestern part of the Dutch Delta area where relatively the majority of the
229
countrywide flooding took place in the past. The most recent flooding, the one of 1916 [see figure 4
230
for an impression], is interesting because this area is since 1916 a safety area in which all cities and
231
civilian organizations worked together, including a large number of volunteers.
232
Figure 4. Impressions of 1916 ‘Zaanstreek-Waterland’ flooding (Aten and Wieringa, 2015).
234
The 1916 Zaanstreek-Waterland’ area flooding, what happened and why, and its effect on
pre-235
sent safety in the region is badly documented according to Aten and Wierenga (Aten and Wieringa,
236
2015). Looking back at the symbiotic cooperation of the people in the region and the local
munici-237
palities have remarkable importance in minimizing the number of casualties, the reoccupation of
238
the people, and the help during this disaster. The ‘Zaanstreek-Waterland’ safety region still has
239
large numbers of volunteers in the fire brigade, health care and other civilian supported
organiza-240
tions like welfare and animal-ambulance work sectors.
241
The security region of ‘Zaanstreek-Waterland’ (www.veiligheidsregiozaanstreekwaterland.nl)
242
is an independent organization in which seven municipalities in this region have supervision. This
243
security region finds its historic existence in the flooding of January 14th 1916, when almost the
en-244
tire region. This incident created a feeling of mutual responsibility between the municipalities,
re-245
lated organizations, and civilians to manage safety and a diversity of tasks together. The mission
246
statement of this security region still addressed these responsibilities in 2017: managing integral
247
security, ready for disasters and crises, working together with police, and working together with
248
civilians in self-reliance. The security region is active in case of fire, disasters, and crisis, has an
249
emergency and coordination room and facilitates medical help in the region included ambulance
250
help.
251
The present situation makes the civilian history of interest in relation to resilience capacity of
252
regions to research the dynamics of this cooperation, what is remarkably distinctive. That’s why for
253
this area Dutch Officials, volunteers and residents were interviewed on location in a focus group
254
Living-Lab setting to clearly distinguish what the important factors of resiliency for the area are.
255
The invited interviewees were: one or two mayors, representatives of the volunteer fire brigade, the
256
regional police, ambulance, water authority with two civilians and other dedicated residents. Based
257
on this focus group session the following general conclusions are generated by this research:
258
• The role of volunteering to manage disasters was diminished in the last century due to city
de-259
velopment, where people know each other less than compared to the agricultural areas and the
260
little villages where most people lived before. This resulted in governmental authorities gaining
261
responsibility and taking over the mayor role of managing safety for the people, residents, and
262
people living in the surrounding areas.
263
• Since the flood of 1953 the Netherlands manages severe disasters by dividing roles by which
264
people and professionals work on the different scales of the village or the neighbourhood and
265
the city or a region respectively. The speculation is that in the case of severe disasters people can
266
act faster to save others personally, and to help older and less able people. The official
authori-267
ties on the other hand can focus on hospitals and other vulnerable places and begin recovery
268
plans that include refugees.
269
• Wealth and long periods of safety can decrease the basic attitude of people taking responsibility
270
when disasters take place because they are acclimated to a situation where the government has
271
the responsibility. To be ready for severe disasters, based on the predictions of climate change,
272
its important to activate people structurally in better times. Officials should not argue this
be-273
haviour as it diminishes the role of common people in case of severe disasters because these are
274
needed to overcome disasters.
275
• Common people, residents, and people in the agricultural areas can be taught to learn and
pre-276
pare themselves for volunteering in case of severe disasters by involving them in minor
disturb-277
ances and giving them feedback on the results. Official authorities can learn additional
infor-278
mation from previous severe disaster recoveries in other countries, the hurricane disasters in the
279
USA for example.
280
• From the 1916 ‘Zaanstreek-Waterland’ and other flooding recapitulations [Chapters 3 and 5] it
281
becomes clear that the cooperation and tuning of civilian initiatives and government ruling in
282
case of emergencies depends more on the values and choices of individual people, residents,
283
more effective when the situation becomes clear to official authorities at helicopter level and
285
when police and/or military forces arrive at the area of damage.
286
6. Resilience of Citizens, by ‘Zaanstad Research Questionnaire
287
In spring 2018 a compact questionnaire is launched to the citizens of Zaanstad, the larger of the
288
two cities in the Zaanstreek-Waterland region. Reason for this questionnaire was to research the
289
resilience among the citizens for danger of flooding.
290
Awareness of the questionnaire for stimulating participation was taken care of by the local
ra-291
dio station and the local newspaper. By QR code participation was made easy to stimulate a large
292
sample for the research, see figure 5. Chosen was for simple questions only to be answered by YES,
293
NO or DON’T KNOW to facilitate the accuracy of the results. Nevertheless, the result was a low
294
turnout, only 40 participants filled in the questionnaire, which is very little given the number of
295
80.000 households in the Zaanstad city. A second limitation of the research is that the composition
296
of the participants is not representative in comparison with the local population, most of the
partic-297
ipants were older then 60 years of age [70% instead of 22,5%] and none were young and lesser of
298
middle age [zero instead of 22,5% and 30% instead of 50%] [According to CBS 2017 national
statis-299
tics], see table 5. Therewith this research can only be seen as one of exploratory nature.
300
Table 5. The questionnaire participation presented in age categories.
301
Questionnaire participation <20 20-60 >60
* Divided in age categories [%] 0,0 30,77 69,23
With the results of the questionnaire can though be concluded that all the questions show a
302
remarkable clear result, all questions resulted in a preference of more then 60% for one out of the
303
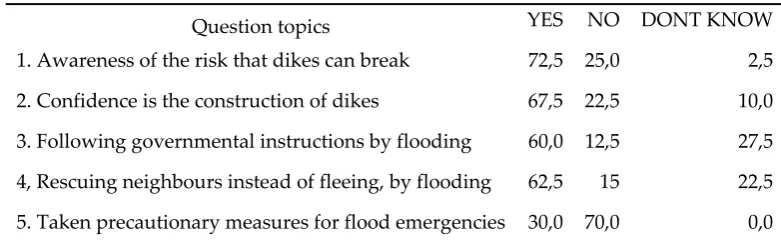
three possible answers, what somewhat compensates for the low turnout, see table 6.
304
Table 6. The questionnaire questions presented with results.
305
Question topics YES NO DONT KNOW
1. Awareness of the risk that dikes can break 72,5 25,0 2,5
2. Confidence is the construction of dikes 67,5 22,5 10,0
3. Following governmental instructions by flooding 60,0 12,5 27,5
4, Rescuing neighbours instead of fleeing, by flooding 62,5 15 22,5
5. Taken precautionary measures for flood emergencies 30,0 70,0 0,0
Analysing the questionnaire outcome there could be concluded:
306
• Most of the citizens of Zaanstad are aware of the risk that dikes protecting their living area could
307
break [72,55 out of 100%] although most of them have confidence in the construction of these
308
dikes and their safety [67,5% out of 100%].
309
• Most of the Zaanstad citizens will follow the instructions given by governmental organizations
310
in case of flooding [60% out of 100%] although they will rescue neighbours instead of running
311
for the flooding if asked for, what seems to expose a dilemma for these citizens. Taking the order
312
of the questions asked into account, in that case, it is reasonable to conclude based of these
out-313
comes; that citizens will first rescue neighbours before they follow the instructions government.
314
• An interesting part of the citizen populations reacted positively that they have taken precautions
315
In general from this questionnaire can be concluded, under the emphasis of the limiting factors
317
mentioned, that most of the citizens of the Dutch city Zaanstad are aware of the danger and local
318
risks of flooding, that an interesting part of the populations have taken precautions, and that they
319
follow instruction of government loyally, after they have take care of neighbours that need that.
320
7. Dutch Resilient Behaviour of Citizens, Conclusions and Lessons Learned
321
By comparing the resilience research results of Zaanstad with the of the former wider
322
Zaanstreek-Waterland area research (Sanders, 2018), then it stands out that there is less difference
323
between the people living in the countryside or the citizens living in the city nearby; 1.they are
324
aware of the risks of flooding, 2. They rely on governmental instructions, and 3. They are willing to
325
take responsibility for neighbours and other people nearby that need help in case of such
emergen-326
cies.
327
The 2018 focus group session with representatives of the ‘Zaanstreek-Waterland’ safety area
328
confirmed though that the contribution of official authority, people, and civilians in case of
emer-329
gencies differs based on the scale of focus and the quickness of taking action. The extent, to which
330
this also applies to the city and the citizens their behaviour, has not been investigated with the
331
Zaanstad questionnaire research. There could be suggested that where population density in cities
332
is greater the communication among and the support to people there will be able to develop more
333
quickly then in the countryside. On the other hand the density of cities can cause people to be
over-334
looked and auxiliaries to run into obstructions in streets. For substantive conclusions on this point
335
its is necessary and advised to cities that the local control room teams become involved and
inter-336
viewed.
337
The Zaanstreek-Waterland research resulted with the conclusion that residents and people
liv-338
ing in the farmland areas to overcome severe disasters yet to come, can learn from less severe
dis-339
turbances on two levels: 1. Learning to take action and volunteer on small scale in their living area
340
by socially warning others and becoming prepared themselves, and 2. That taking civilian
initia-341
tives in case of emergencies is important in the first hours and days after a disaster takes place
be-342
cause the official authorities can not handle that fast giving support to all the people in their area.
343
The governmental first focus is taking away the threat, the evacuation of less mobile people, such as
344
hospitals and houses for elderly, and organizing refugees. This too is not researched for the urban
345
situation of Zaanstad. Nevertheless, I can be accepted in a safe manner that in cities this will not be
346
different.
347
Based on both research concerning the resilience by flooding in the situation of the Zaanstad
348
city and the Zaanstreek-Waterland region, the message to conclude is; civilians and professionals
349
from government and other authorities can work together successfully in case of severe disasters as
350
long they know and accept their own role, and work on different scales and time schedules.
Be-351
cause besides government the people living are aware of the danger and an interesting percentage
352
of them take precautions. Sharing experiences from overcoming less severe disturbances will help
353
to bring these skills and motivations into practice to both civilians and professionals. This will make
354
the Netherlands resilient for the coming future, in cities and in the countryside.
355
9. Dutch Resiliency Prospects Coupled to New Research Initiatives
356
In The Netherlands the four Universities of Technology in 2018 started a combined research
357
program on resilience coupled to climate-change called DeSIRE [Designing Systems for informed
358
Resilience Research] under management of the new 4TU-RE Research Center.5 These Dutch four
359
Universities of Technology [in Delft, Eindhoven, Twente and Wageningen] had not worked
togeth-360
er in such an important program before, what shows the urgency in the Netherlands to work on
361
combining practice, innovation and theory forming. Smaller programs have started too, like ‘SOS
362
Waterfront’ for exchanging knowledge and vision on water related resilience between professionals
363
of Universities in Europe. This program more then DeSIRE program focuses on the behaviour of
364
area residents and citizens similar to the research done in the Zaanstreek-Waterland region.
365
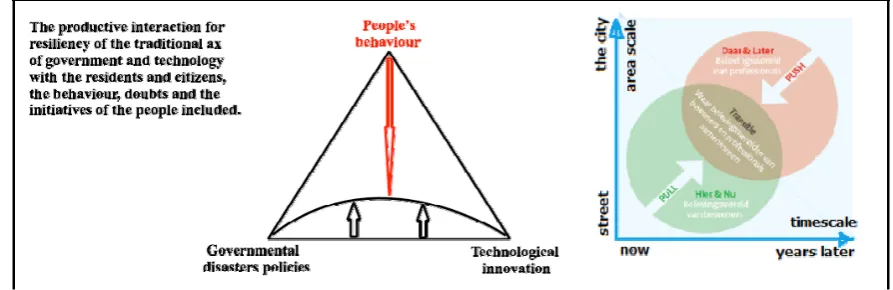
366
Figure 7. The resilient interaction of; government, technical professionals and residents.
367
These research programs differ in their focus, some take the interaction of government and
368
technical professionals central, while for others the behaviour of residents is the starting point.
369
From the research done in the Zaanstreek-Waterland area is concluded that the one approach
can-370
not be seen separately from the other. As given a picture left in figure 7; these relations form a
tri-371
angle, by which the collaboration between government and technical professionals has to seek
372
alignment with the residents living in the areas for which resilient results should be developed.
373
PhD research has proved that residents think short term attached to a small territory, while
profes-374
sionals think long term for large territories, what makes that a productive interaction asked for
mu-375
tual respect and empathy for creating results, as pictures right in figure 7 (Sanders, 2014). Both
in-376
sights confirm each other, that resilience for an area askes cooperation of all parties involved, each
377
from their own strength without giving priority to the one or the other. Research proves to that this
378
cooperation does not happen automatically, there are stimulating and frustrating conditions to be
379
recognized. Therefor further research area, culture and situational coupled is recommended, that
380
theory and practice come together for developing resiliency where needed.
381
References
382
ATEN, D. 2009. Stormenderland, canon waterstaatsgeschiedenis boven het IJ 700-2008., Edam, HHNK.
383
ATEN, D. & WIERINGA, F. 2015. The ‘Water-wolf in Waterland,the flooding of 1916 in the Waterland
384
and Zaanarea [Dutch: De Waterwolf in Waterland, de overstroming van 1916 in Waterland en de
385
Zaanstreek], Schoorl, Pirola.
386
BERKHOUT, F., HERTIN, J. & GANN, D. M. 2006. Learning to adapt: organisational adaptation to
387
climate change impacts. Climatic change, 78, 135-156.
388
BRESSER, A., BERK, M., VAN DEN BORN, G., VAN BREE, L., VAN GAALEN, F., LIGTVOET, W.,
389
VAN MINNEN, J., WITMER, M., AMELUNG, S. & BOLWIDT, L. 2005. Effecten van
klimaat-390
verandering in Nederland, Milieu-en Natuurplanbureau.
391
CHAMLEE-WRIGHT, E. & STORR, V. 2011. Social capital as collective narratives and post-disaster
392
community recovery. The sociological review, 59, 266-282.
393
DELTA-COMMISSION 2017. Deltaprogramma 2018. Delta-commission.
394
DELTARES 2018. Possible consequenties of speeding-up sealvel rise for the Dutch Delta defence
395
system [Dutch: Mogelijke gevolgen van versnelde zeespiegelstijging voor het
Deltapro-396
gramma] Deltares Delft.
397
HOLLING, C. S. 1973. Resilience and stability of ecological systems. Annual review of ecology and
398
IPCC 2007. Climate change 2007, impacts, adaptation and vulnerability. WMO.
400
MARTIN-BREEN, P. & ANDERIES, J. M. 2011. Resilience: A literature review.
401
NELSON, D. R., ADGER, W. N. & BROWN, K. 2007. Adaptation to environmental change:
contri-402
butions of a resilience framework. Annual review of Environment and Resources, 32.
403
OVINK, H. 2014. Rebuild by Design: Recovering New York after Sandy.
404
PELLING, M. 2010. Adaptation to climate change: from resilience to transformation, Routledge.
405
SANDERS, F. 2018. Dutch Resiliency of under sea-level cities due to brave people. RRAU18.
Gro-406
ningen, the Netherlands: Ierek.
407
SANDERS, F. C. 2014. Sustainable Development through Resident’s Collective Initiatives (Dutch:
Duur-408
zame ontwikkeling door collectief bewonersinitiatief, leidraad voor professionals om bewonersgroepen
409
aan de duurzaamheidsopgave te verbinden) (Peer-reviewed Dissertation), Delft, Delft University
410
of Technology.
411
SANDERS, F. C. & VAN TIMMEREN, A. 2017a. Pride the Civilians Motivator for Resilient
Sustain-412
able Cities, results of the 2016 questionnaire research under Dutch Amsterdam council
413
members (Peer-reviewed). WSBE17 5-7 June (peer-reviewed). Hong Kong China.
414
SANDERS, F. C. & VAN TIMMEREN, A. 2017b. ‘Success factors for Greenish Initiatives of the
415
Commons’, results of the best practices 2016 research under Dutch Rotterdam project
initia-416
tives (Peer-reviewed). IASC17. Utrecht University of Applied Science: IASC.
417
SEBASTIAN, A. G., LENDERING, K. T., KOTHUIS, B. L. M., BRAND, A. D. & JONKMAN, S. N.
418
2017. Hurricane Harvey Report, A fact-finding effort in the direct aftermath of Hurrican
419
Harvey in the Greater Houston Region. Delft: Delft Un. of Technology.
420
SPG 2014. Earthquakes in Groningen; the feelings of civilians [Dutch: Aardbevingen in Groningen;
421
wat zijn de ervaringen van burgers]. SPG [Social Planbureau Groningen].
422
TOMPKINS, E. & ADGER, W. N. 2004. Does adaptive management of natural resources enhance
423
resilience to climate change? Ecology and society, 9.
424
UN 2015. Paris Agreements framework convention on climate change. Paris, France.
425
VAN BAKEL, P., KSELIK, R., ROEST, C. & SMIT, A. 2009. Review of crop salt tolerance in the
426
Netehrlands. Alterra, Wageningen University and research.
427
VAN DER VOORT, N. & VANCLAY, F. 2015. Social impacts of earthquakes caused by gas
extrac-428
tion in the Province of Groningen, The Netherlands. Environmental Impact Assessment
Re-429
view, 50, 1-15.
430
VELLINGA, N., HOITINK, A., VAN DER VEGT, M., ZHANG, W. & HOEKSTRA, P. 2014. Human
431
impacts on tides overwhelm the effect of sea level rise on extreme water levels in the
432
Rhine–Meuse delta. Coastal Engineering, 90, 40-50.
433
VERGOUWE, R. 2016. The water safety of the Netherlands mapped (Dutch: De veiligheid van
Ne-434
derland in kaart). Rijkswaterstaat Ministery M&I, the Netherlands.
435
WALKER, B., CARPENTER, S., ANDERIES, J., ABEL, N., CUMMING, G., JANSSEN, M., LEBEL, L.,
436
NORBERG, J., PETERSON, G. & PRITCHARD, R. 2002. Resilience management in
social-437
ecological systems: a working hypothesis for a participatory approach. Conservation ecology,
438
6.
439
WIERING, M. & WINNUBST, M. 2017. The conception of public interest in Dutch flood risk
![Figure 1. Showing flooding [left] en economic effects of flooding risks [right] (Vergouwe, 2016)](https://thumb-us.123doks.com/thumbv2/123dok_us/7977262.1322840/2.595.76.525.443.628/figure-showing-flooding-economic-effects-flooding-risks-vergouwe.webp)

![Figure 3. USA hurricanes left to right: Sandy, Sandy, Katrina, Harvey [source: Wikipedia]](https://thumb-us.123doks.com/thumbv2/123dok_us/7977262.1322840/6.595.74.569.73.206/figure-hurricanes-sandy-sandy-katrina-harvey-source-wikipedia.webp)