Article
1
Performance Evaluation of Monocrystalline PV
2
Module in Hot Arid Climate for Developing Smart
3
Cities
4
Asif Khan1,*, Saim Memon 1,*
5
1 Division of Electrical and Electronic Engineering, School of Engineering, London South Bank University,
6
103 Borough Road, London, SE1 0AA, UK; [email protected] , [email protected]
7
* Correspondence: [email protected]; Tel.: +44 (0)20 7815 7510 (S.M.)
8
9
Abstract: Due to an increase of the monocrystalline PV systems installations, for a drive towards
10
the sustainable smart cities in the hot arid developing country such as Pakistan, pose challenges of
11
the performance and degradation issues. Monocrystalline PV module efficiencies are declining and
12
damaging under the continuous exposure to higher surface day-time temperatures in the different
13
parts of the country. A MATLAB simulations were performed based on the validated mathematical
14
approach. This paper investigates the hot arid surface temperature impacts on the performance of
15
PV modules during the summer and winter seasons in Pakistan. The investigations are performed
16
examining the power generating efficiency of the PV system. This paper also investigates the
17
influence of installations of PV-system in the North, South, East and West regions of Pakistan. It
18
was examined that the northern areas of Pakistan are more suitable for maintaining the long-term
19
durability of the PV system. Investigations are performed for the peak summer and peak winter
20
days. During summer months, cooling strategies have to be implemented to overcome the heating
21
effects whilst reducing degradation effect on installed PV-system.
22
Keywords: photo-voltaic; monocrystalline; energy efficiency; hot-arid climate; smart cities;
23
MATLAB simulations.
24
25
1. Introduction
26
Substantial efforts in tackling the energy shortage are being applied with the rollout of
Photo-27
voltaic (PV) panels in all regions of Pakistan in reducing the carbon emissions [1-2] with a drive
28
towards the sustainable smart cities as a developing country. It is well-known that electrical energy
29
demand in Pakistan is consistently increasing imposing fuel poverty in rural areas, so far a shortage
30
of 4000 MWh in Pakistan causing many hours of load-shading and damaging the economic growth
31
[3-4]. Most of the urban areas are suffering through 10-12 hours of power load-shedding. In rural
32
areas, the load-shedding occur between 16 and 18 hours a day [5]. The energy generation from
33
conventional sources has already been identified as insufficient in overcoming the energy demand.
34
The utilisation of a large amount of fossil fuel produces the carbon emissions resulting climate-change
35
[6, 7]. To reduce this effect, renewable energy resources are one of the solutions [8, 9]. Among
36
renewable energy, PV integrated buildings plays a significant part, because buildings are responsible
37
of over 60% of total energy consumption. The installations of PV panels in the domestic buildings of
38
Pakistan are relatively new and are growing faster due to greater benefits of shunning the energy
39
supply-demand gap [10]. In recent years, Pakistan shifted its environmental and energy policies
40
towards sustainable and renewable energy economic policies. Due to this, a large number of PV
41
systems are being implemented across the country [11-13]. The PV systems installed are of two types,
42
on-grid and off-grid systems. In the grid-connected system PV panels are connected directly to the
43
grid by using DC/AC power electronics converters. The major component to convert the DC
44
generated power into AC power with required voltage is the inverter. Maximum power point
45
tracking (MPPT) algorithm makes PV units capable of generating the power at full capacity. It does
46
not move the panel towards sun to extract power instead it varies the electrical properties of the PV
47
panel for achieving the maximum power and improving the efficiency of the PV panel by maintaining
48
the voltage and current at an appropriate level. MPPT calculates the energy values to apply the
49
correct duty cycle to achieve the required results. It is typically suitable for charging up battery banks
50
because it increases the efficiency of battery charging rate. The off-grid system is autonomous and is
51
not connected to the grid. [14-16].
52
53
A recent study shows the results obtained from the 69 metrological stations over the recent 30
54
years period that the more than 70% area of Pakistan receives the average yearly solar radiation of
55
5.5 kWh/m2/day as shown in Fig.1 [17]. The data collected by the Pakistan metrological department
56
for the five major cities of Pakistan show that the west of Pakistan (Quetta) located in Baluchistan
57
receives 21.6 MJ/m2/day. The annual average in the other cities of Pakistan such as Lahore receives
58
19.25 MJ/m2/day, Karachi has 18.7 MJ/m2/day, Multan has 18.36 MJ/m2/day and Peshawar receives
59
the 17.0 MJ/m2/day. The investigations were carried out by using the temperature ranges between
60
minimum and maximum in that area and by considering the duration of irradiation. The estimate in
61
this is compared with the National renewable energy laboratory (NREL) of USA and shows that
62
batter average capacity of 5.5kWh/m2/day to 7.5kWh/m2/day [18]. While the National Renewable
63
energy laboratory of US indicates the average solar power from 5kWh/m2/day to 7kWh/m2/day [19].
64
Some cities in the province of Baluchistan and Sindh such as Larkana, Quetta receives the 5.5
65
kWh/m2/day [20-22].
66
67
68
69
70
71
72
73
74
75
76
77
78
79
80
81
Figure 1. Pakistan annual direct solar radiations [23]
82
Power generation from the PV system is dependent on the environmental conditions due to the
83
variations in surface temperatures across different parts of Pakistan. During summer months,
consistent higher temperatures reduce the power generation capacity of the PV system, ultimately
85
damaging the performance of PV panels and in winter temperature fall to a low level where PV
86
panels perform under nominal temperatures [24].To address the overheating issue, the temperature
87
regulatory system is required with high reliability and fast real-time features and improving the
88
durability of the PV system to its rated duty cycle [25]. PV system is becoming an important
89
renewable energy source for power generation in Pakistan. Pakistan is situated in the region where
90
some areas receive the higher solar radiation in the summer months, it allows harnessing the large
91
amount of solar energy [26], despite the fact the PV systems are not completely rolled out because of
92
the recent crises of overheating of the PV panels and significant financial loss to consumers [27]. Thus,
93
it is required to investigate the higher potential smart cities. Pakistan council of appropriate of
94
technology and Pakistan national institute of silicon technology established the Pakistan council of
95
renewable technologies in 2001. But this council did not investigate the suitable areas for installations
96
of solar farms and never built any mega solar project for a drive towards smart cities [28]. The
97
installations of solar energy at residential sectors and in an appropriate region with smart national
98
grid connection would provide relief from severe load shedding.
99
100
This paper investigates the influence of hot arid climate temperatures on the PV panel
101
performance for the investigation of the developing smart cities to avoid overheating and strategies
102
to reduce the hot-arid climate impact on the energy efficiency of the PV panels by utilising validated
103
MATLAB modelling approach for predictions. This paper contributes to investigate the suitable solar
104
sites where the performance of PV system is analysed which influences the long-term durability of
105
the solar power plants in Pakistan. This paper also contributes to quantitatively compare the
106
performance of PV systems across the country and strategies in maintaining the reliability of PV
107
systems and avoiding overheating of PV systems by introducing cooling strategies.
108
2. Materials and Methods
109
A PV monocrystalline system is designed and modelled with the nominal power generation
110
capacity of 295W and nominal power point output voltage 31.5 VDC for the residential sector in
111
several areas of Pakistan. A schematic diagram of the model is shown in Fig.2 and the system is
112
validated by analysing the simulation results in MATLAB and Simulink. The output power is
113
calculated at different temperatures across several areas of Pakistan such as North-East, North-West,
114
South-East and West side of Pakistan. The efficiency of the power generation from the PV system is
115
predicted for winter and summer months.
116
The sunlight incident onto the monocrystalline PV cells can be absorbed or reflected or pass
117
through the cells. The absorbed light by the cells generates electrical power also known as solar power
118
[29, 30]. PV cells achieve better efficiency when operated under nominal temperatures and it is
119
important to examine the hot arid climate changes in several areas of Pakistan before considering the
120
installation of the PV system [31]. For every degree rise temperature above 25˚C, an efficiency of the
121
PV panels could be reduced to 0.25% for amorphous cells and 0.4-0.5% for crystalline cells [32].
122
During summer months, most areas of Pakistan reach 45˚C that reduces the efficiency of the panels.
123
An increase of cumulative surface temperatures causing over 60 ˚C reduces the voltage generation
124
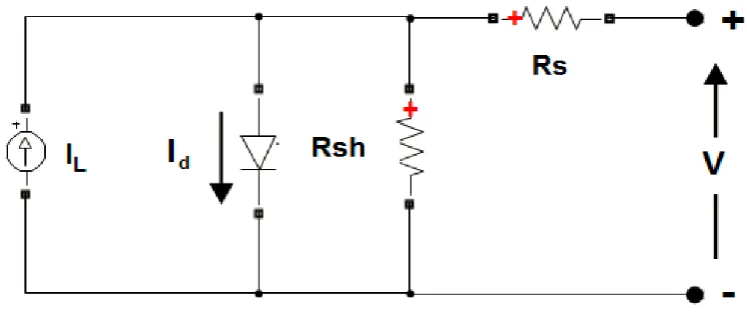
by the PV system that impacts the overall power generation and minimises efficiency.
126
Figure 2. Illustrates the schematic model of the typical monocrystalline PV cell. The measurements
127
are used to examine the output at different temperatures.
128
The power supplied by the PV modules is dependent on the internal resistance Rs and the
129
external irradiance and incident temperatures. The temperature and irradiance directly affect the
130
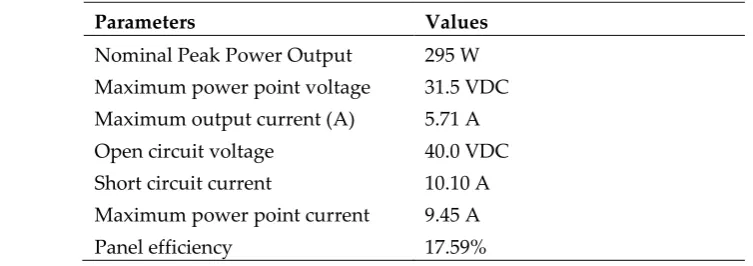
power generation from the PV system [33]. The nominal parameters of the implemented PV system
131
are detailed in Table 1. The relation of the solar photovoltaic current to the temperature is described
132
by eq.1. [34]
133
IPh= (Iscn+ K1∆T) S
Sn (1)
134
Where Iscn is the current generation at the suitable conditions i.e 25°C and 1000W/m2. ∆T is the
135
difference between the actual temperature and nominal temperature received by the monocrystalline
136
PV module. IPh is the photo voltaic current. S is the actual irradiation on the monocrystalline PV
137
module and Sn is the nominal irradiance [35].
138
The temperature effects on the diode saturation current Io can be described as eq.2.
139
Io= Ion( T Tn)
3
e[qEGoNsak( 1 Tn−
1
T)] (2)
140
Where Ionthe saturation is is current, EGo is the bandgap semiconductor energy, Ns is the total
141
number of solar cells which are linked with series in the parallel as shown in eq.3 [36]
142
Ion=
Iscn+KI∆T
e((Vocn+Kv∆T)/VT) (3)
143
Where Ion is the nominal saturation current that is improved by including the KI and Kv
144
coefficients. Where KI and Kv are the current and voltage coefficients. This modification is used to
145
determine the voltage at the several ranges of temperatures. The Io saturation current is dependent
146
on the temperature. Efficiency of power generation depends on the temperature of the (PV) panel.
147
Lower or nominal surface temperatures and higher irradiance enhances the efficiency to generate
148
maximum power from the PV panel using eq. 4. In the morning/evening during winter months, the
149
solar irradiation reduces but the average surface temperatures are suitable that tends to generate the
150
power at its achievable efficiency.
151
Pm= ImVm= ISCVoc (4)
Where Voc is open circuit voltage and ISC is the short circuit current. Pm is the maximum
153
power generated by the PV panel at the weather temperature. A decrease in voltage, short circuit
154
current and so efficiency can be calculated when increasing the surface temperature using eq.5 [37]
155
ɳc= ɳTref[1 − βref(Tc− Tref)] (5)
156
Where ɳc is correlation efficiency of the PV panel, Tref is the reference temperature, ɳTref is the
157
panel electrical efficiency at the applied temperature and irradiance where the maximum power is
158
generated, βref is the temperature coefficient calculated using eq. 6 [38].
159
βref= 1
To−Tref (6)
160
Where To is the maximum temperature at which monocrystalline PV module efficiency shown
161
in Table 1. The relative efficiency is calculated by comparing the reference temperature of 25ºC with
162
the other temperatures. It shows the temperature effect on efficiency of the PV panel.
163
Table 1. Nominal parameters of the implemented PV system (relative efficiency calculations using 25°
164
C and 1000 W/m2 as a reference point).
165
166
167
168
169
170
2.1. Weather temperatures across Pakistan
171
Temperature is one of the major property which conclude the climate of any area. Any change
172
in temperature results in the change of climate of the region affecting the power generation from the
173
PV system [39]. Most of the areas in Pakistan experienced higher weather temperatures influencing
174
higher surface temperatures elevating above 45 °C during summer months. During winter months
175
the temperature goes to −15°C in the northern area [40]. Fig. 3(a) shows the temperature across
176
several areas of Sindh (Southern Pakistan) where Thar and Larkana are suffering through the highest
177
temperature during the summer months. These areas are also in the high temperature ranges during
178
winter months. Fig. 3(b) illustrates the surface temperature in Gilgit Baltistan and Azad Kashmir
179
(North East Pakistan) where the winter temperature goes to very low −15°C and the summer
180
temperature remains between 30°C and 40 °C. The temperature in the area of Khyberpakhtoonkhaw
181
(North West Pakistan), as shown in Fig. 3(c), varies across several areas. Fig. 3(d) demonstrates the
182
temperature in the province of Baluchistan (West Pakistan) in which during winter months some
183
areas are predicted to be at lower temperature of – 15°C. Temperature values in Punjab (East
184
Pakistan) are shown in Fig. 3(e) where the summer temperature remains between 40 °C and 50 °C.
185
The average temperatures in several areas of Pakistan are listed in Table 2 distributed across summer,
186
spring and winter months. As the performance of the PV module is linked with temperature, hence
187
the average temperature influence on PV panels in different areas of Pakistan need to analysed [41].
188
189
Parameters Values
Nominal Peak Power Output 295 W Maximum power point voltage 31.5 VDC Maximum output current (A) 5.71 A
Open circuit voltage 40.0 VDC
Short circuit current
Maximum power point current
10.10 A 9.45 A
190
191
192
193
194
195
196
197
198
(a) (b)
199
200
201
202
203
204
205
206
207
208
209
(c) (d)
210
211
212
213
214
215
216
217
218
219
(e)
220
Figure 3. Peak summer and winter temperature measurements of (a) Southern, (b) North East, (c)
221
North West, (d) West, & (e) Eastern regions of Pakistan.
222
Table 2. Average Ambient temperatures in most of the areas of Pakistan [41]
223
224
Parameters North average ambient temperature
South average ambient temperature
East average ambient temperature
West average ambient temperature
Summer 45 55 50 49
3. Results and discussion
225
The parametric data plotted to determine the correlation between power (W), current (I) and
226
voltage (V) with cumulative extreme temperatures range of −40°C and 90°C. Higher temperatures
227
are due to the overheating of the PV panel. Fig. 4 (a) illustrates the voltage reduction by the increase
228
in surface temperatures. It shows the output voltage from the PV system in the range of 1000W/m2.
229
The desired voltage is 31.5 VDC and the achieved voltage is reduced to 25.2VDC when increasing the
230
temperature but at the range between 0°C and 50°C, voltage was predicted to be very close to the
231
nominal voltage. As the weather temperatures are dynamic, it was necessary to predict the PV system
232
at the lower-temperature areas or by using cooling techniques which then increases the energy cost.
233
However, it will increase the output efficiency of the power generation when operating the PV system
234
under nominal weather conditions. Fig. 4(b) shows an influence of increasing the surface temperature
235
on the output power of the modelled PV system. For every degree rise in temperature above 25˚C, a
236
decrease in the efficiency of the PV panel 0.25% is predicted for amorphous cells and 0.4-0.5% for
237
crystalline cells. The output energy generated is reduced due to the increase of surface temperature
238
effects on the PV panels. Fig.4 (c) shows the temperatures effects on the output current from the PV
239
system, illustrating the output current for several temperature ranges.
240
(a) (b) (c)
241
Figure 4. (a) Illustration of the temperature effects on the voltage. (b) Temperature vs output electrical
242
power from the modelled PV system. (c) Output current variations at different temperature.
243
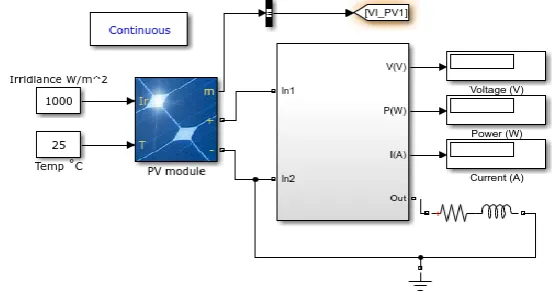
The simulation is carried out validating the temperature effects on the PV system where the
244
voltage (V), current (A) and Power (W) are analysed and the simulation of the system is shown in
245
Fig. 5.
246
247
Figure 5. The model of the simulated monocrystalline PV module tested at dynamic surface
248
temperatures.
3.1. PV Panel Performance in East Pakistan
250
Investigations are performed to investigate the conversion of the solar radiations into electrical
251
energy and to achieve the desired output power at different temperatures, PV orientation and
252
irradiation levels. In order to investigate the power flow from the PV system, current-voltage linkage
253
is analysed. PV modules can be designed in parallel and series to achieve the required output power
254
[39]. The current-voltage and efficiency are investigated in Eastern Pakistan to examine the
255
temperature power flow, a similar approach is used in [27]. In this study, degree day (24 hours)
256
temperature analysis is carried out for peak summer and winter months. The performance of PV
257
array is changing according to the forecast horizon. The day-light hours in summer months are more
258
considerable for the PV system due to severe changes in temperature, air speed and humidity.
259
Therefore the different weather forecast focused to predict the power generation efficiency from the
260
modelled PV system. This analysis can be used for energy management of integrated buildings across
261
Pakistan. The installations cost of the PV system [11] can be minimised with the help of temperature
262
analysis with accuracy. Investigations are carried out in Eastern Pakistan to examine power
263
generation efficiency from PV system. The output power, short circuit current and voltage are
264
recorded against temperatures. It is observed during the cold season, the energy efficiency of the PV
265
system modelled has remained closer to the achievable nominal values. By increasing surface
266
temperatures, a reduction in voltage and current are observed causing a decrease in maximum output
267
power as detailed in Table 3.
268
Table 3. The output power losses compared to the nominal power output from the modelled PV
269
system in the Eastern region of Pakistan.
270
Days Average Power loss (W)
11 January 28
30 June 56
271
Fig.6 (a) shows the electrical output parameters of the PV panels for a peak cold day in the month
272
of January. The results are performed in the eastern Pakistan where the capital of eastern Pakistan
273
‘Lahore’ is taken for investigations. The recorded data voltage (V), power (W) and Current (I) are
274
used to plot and investigate the variations in these parameters. It is noticed that the Power output is
275
decreasing with the increase of temperature. The voltage is also reducing by increasing in
276
temperature. Output current ISc affected through marginal changes. The power generation
277
efficiency during the peak summer day in the month of June is lower than the peak cold day. Higher
278
temperatures are recorded during summer months which are decreasing the energy efficiency of the
279
PV panels. The Fig.6 (b) shows the temperature on the power generation efficiency of the PV system
280
simulated during the summer months for the eastern region of Pakistan.
282
(a)
283
284
(b)
285
Figure 6. Temperature effects on the performance of simulated PV panel in the eastern city of Lahore
286
(a) for a peak winter day and (b) peak summer day.
287
3.2. PV Panel Performance in West Pakistan
288
The performance of the PV system with real time peak day temperatures were analysed for
289
winter and summer months in the Western region of Pakistan, a capital city Quetta is chosen for
290
investigating the PV system performance, current/voltage and efficiency against the surface
291
temperature of the PV panel as shown in Fig. 7. It shows PV panel output performance is closer to
292
the nominal values with an achievable maximum voltage of 29.50 VDC, short circuit current of 8.1A.
293
Here the short circuit voltage and current are considered to examine the voltage/power drops at
294
different temperatures as detailed in Table 4. Average power losses 108 W were recorded for the
295
coldest day (11th Jan) and 136 W for the hottest day (30th Jun).
296
Table 4. The output energy losses from the modelled PV system in western region of Pakistan.
297
298
Days Average power losses (W)
11 January 24
299
(a)
300
301
(b)
302
Figure 7. Temperature influences on the reduction of the performance of simulated PV system in
303
Quetta, West of Pakistan (a) for a peak summer day (b) Peak winter day.
304
3.3. PV panel performance in South Pakistan
305
An off-grid PV system in the southern area of Pakistan show a reduction output power, detailed
306
in Table 5. During the investigations, the data has been collected for the 24 hours, to investigate the
307
weather effects on the PV system to compare the efficiency of the system during winter and summer
308
months. The maximum temperature observed in the southern region (Thar) during the winter season
309
is 29°C and the temperature remains between (30-55) °C during summer months. The results showed
310
that this area required cooling systems of PV panels in both summer and winter seasons and the PV
311
array performance could be severely reduced because of the temperature remains higher during both
312
seasons. The voltage is dropped to 29.31 VDC compared to the nominal voltage of 31.5 VDC. The
313
average power losses, compared to the nominal power output, was noticed 116 W and 153 W for the
314
peak cold day and peak hot day, respectively, between 5am and 9pm. Fig.8. shows the power flow
315
analysis on the Thar, Southern region of Pakistan.
Table 5. The output Power losses compared to the nominal power output from the modelled PV
318
system in the Southern region of Pakistan.
319
320
(a)
321
322
(b)
323
Figure 8. Temperature influences on the reduction of the performance of simulated PV system in Thar,
324
South of Pakistan (a) for a peak summer day (b) Peak winter day.
325
3.4. PV panel performance in North Pakistan
326
PV panel works efficient at a certain temperature and the best temperature for the PV panel is
327
25°C, average power losses are detailed in Table 6. There are needs to design new ways to improve
328
the efficiency of the PV system during the non-optimal temperatures such as cooling techniques. In
329
this section, investigations are performed to examine the solar power generation at North Pakistan
330
Gilgit area. This is the mountainous area where the temperature remains between (−5 to 33)°C
331
throughout the year. This area is more suitable to install the PV modules because of efficient
332
temperature. Fig. 9 illustrates the temperature effects on the power generation at Gilgit, North
333
Pakistan. The PV power generating efficiency and voltage are improved as being closer to the
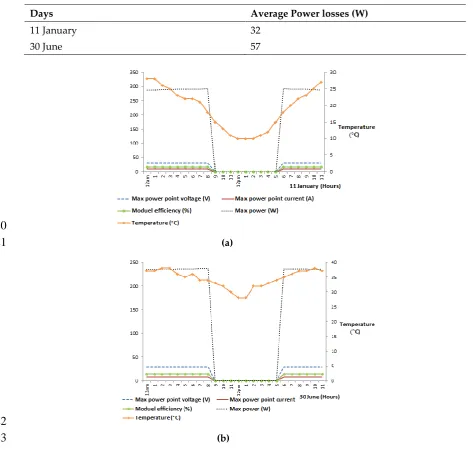
334
Days Average Power losses (W)
11 January 32
nominal values. This is the best area that shows the improved results for the PV panel throughout a
335
year.
336
Table 6. The output energy losses from the modelled PV system in the northern region of Pakistan
337
Days Average energy losses (W)
11 January 17
30 June 48
338
(a)
339
340
(b)
341
Figure 9. (a) Power generation from the PV system in Gilgit, North Pakistan, during winter season
342
shows PV system generates the power/voltage efficiently and better than the rest of the regions of
343
Pakistan. (b) Power analysis on the hottest day of 30 June.
344
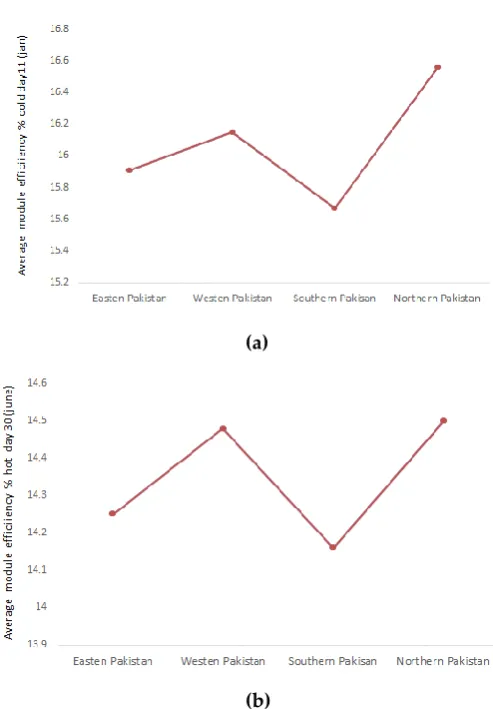
3.5. Comparative analysis of PV panel for the different regions of Pakistan
345
The northern areas of Pakistan, as shown in Fig. 10, have the lower power reduction at all
346
weather conditions. In other parts, during the summer losses are increasing with a temperature rise
347
that areas are not perfect for installations of PV system. The effect can be minimized by implementing
348
cooling techniques that reduce the temperature effects during summer months. During this day, all
349
of the areas are showing better performance for the power generation from the PV panel.
351
(a)
352
353
(b)
354
Figure 10. Comparative energy efficiency analysis on the (a) peak day (11th January) of the winter
355
months (b) peak day of the summer months (30th June)
356
4. Cooling strategies for the PV panel overheating
357
Higher temperature reduces the efficiency of the PV panel to generate nominal electrical energy.
358
Hence it is necessary to apply the cooling techniques to maximise the energy generation from the PV
359
system. To implement the cooling techniques there is separate system required to reduce the heat
360
effects on the PV system. There are two types of cooling techniques can be used such as passive
361
cooling and active cooling. The active cooling technique is water cooling and the passive system uses
362
conduction system to remove the heat from the PV system.
363
4.1. Active cooling
364
This method is very efficient for the PV panel cooling such as water cooling methods or air
365
cooling. It is considered of using the electrical energy continuously because a water pump or a fan is
366
required for implementing water circulation. This improves the energy generation capacity of the PV
367
system but the energy consumption by fan/pump needs to be considered. This method can be
368
efficiently applied for the concentrated solar cells that use less cooling fluid and a reduced amount
369
of energy is required to run the system. Two polycrystalline cells are compared to determine the
370
energy extraction by applying these methods. An aluminum casing is used on the back side of the
371
cooling cell to perform as a flow canal. Water cooling method performs batter then the other methods.
372
This technique can be applied at both sides of the PV system and also assist in cleansing of the PV
panel. By applying water the temperature was limited to 30 ºC in the summer seasons that has
374
increased the energy output to 20% that means the overall efficiency is improved by 9% and a
375
temperature is decreased by 12ºC.While by implementing the fan system, an improved efficiency of
376
13.5% is noticed and temperature of the PV panel is reduced by 15ºC.
377
4.2. Passive cooling
378
A Passive cooling is categorised into three types; conductive cooling, water and air passive
379
cooling. The transfer of heat from the PV panel is conductive in nature. Two PV polycrystalline cells
380
are tested in different conditions. One PV cells consists of aluminium sheet with thermal grease used
381
as a heat sink and the other without any sheets. Irradiation is changed from 1000 W/m2. An improved
382
efficiency is achieved by the usage of heat sink by passive cooling methods. It means that the passive
383
cooling has a major impact on the energy extraction from the PV system. It is noticed that 0.085
length-384
depth ratio heats up the PV panel by 6ºC by comparing it on a regular environment. The
385
implementation of passive cooling technique shows the reverse effects on the PV panel heating. Phase
386
change material is a special type for the conductive cooling. It maintains the required temperature
387
for the PV panel to increase its efficiency. In this process heat is removed conductively and no
388
additional work is needed to dissipate the heat. By selecting the correct material for the conduction
389
process, a reference temperature for the PV panel can be obtained. The efficiency is improved by 10%
390
compared to the actual temperature applied at the PV panel without any conduction. The decrease
391
in temperature is observed from 55 ºC to 35 ºC.
392
Another method is a heat pipe cooling method that is applied by the combination of convection
393
cooling system along with phase change cooling. It removes the heat by going through evaporation
394
and expansion on one side cooling system and release the heat by condensation on the other side of
395
the cooling system. It completes the phase by continuous movement of the liquid by capillary pipes
396
and evaporates. The stable output energy is noticed by using the cooling of heat pipes with water.
397
The energy efficiency is improved by 8.4%. Another cooling technique for reducing the temperature
398
of PV panel is the thermoelectric cooling method that is used to transfer heat in the specific direction.
399
It produces cooling on one side of the junction and heating effects on the other side. The intensity of
400
the heating and cooling material depends on the nominal output power. The higher output power
401
creates more heat and vice versa. This method is useful for specific PV cells where these cells required
402
maintaining cooling.
403
5. Conclusions
404
Photo-voltaic (PV) system is a reliable technology and is commercially available across Pakistan
405
with collaboration of China for a long term growth with high potential. The conditions for
406
installations of PV systems with a drive towards smart cities in Pakistan due to higher irradiance and
407
suitable temperatures across the country. The main advantage of installing the PV system is to
408
reduce load shedding in the residential sectors and to minimise overloading the National grid. This
409
will reduce the gap between the energy supplies and consumed and will leave positive impact on the
410
country economy. However, most of the urban areas in Pakistan stay hot and humid in the entire
411
year. Consistent solar irradiation at higher temperatures is one of the major factors that affect the
412
power generation performance of the monocrystalline PV modules. Since all the locations in Pakistan
413
have different temperatures, so before installing the PV system temperature analysis needs to be
414
carried out. The conclusive remarks from this study are:
A simulation is carried out to examine the thermal effects on the monocrystalline PV system. As
416
part of the investigations; degree day (24 hours) analysis were performed for the four provinces of
417
Pakistan where the worst cold and hot day’s temperatures are taken for investigations.
418
A decline in power generating efficiency by monocrystalline PV panels due to the rise in surface
419
temperature was investigated. It is found that during summer months, the southern and eastern
420
regions of Pakistan, voltage is dropped to 25.20 VDC and the efficiency reduced to 14.16%.
421
It is analysed that the areas in the North region of Pakistan such as Gilgit have an achievable
422
better performance where the voltage/power generation efficiencies of the PV panel are closer to the
423
nominal values than the other regions throughout the year and is a suitable region for the installations
424
of monocrystalline PV modules. This area is found efficient because of suitable temperature ranges
425
between 0-30°C throughout the year.
426
During the summer months, the rest of Pakistan’s temperature goes very high that decreases the
427
power generation from the monocrystalline PV modules. But during the winters, the achievable
428
efficiencies are considerably better throughout Pakistan.
429
430
Author Contributions: conceptualization, S.M and A.K; methodology, A.K; software, A.K.; validation, A.K and
431
S.M; formal analysis, S.M and A.K.; investigation, A.K.; resources, S.M and A.K; writing—original draft
432
preparation, A.K., S.M.; writing—review and editing, A.K., S.M; supervision, S. M.
433
Funding: This research received no external funding and The APC was funded by London South Bank
434
University.
435
Acknowledgment: Authors would like to thank the research facilities support provided by the TWI Centre for
436
Automation of NDT, Advanced Materials Research Group and Research Enterprise & Innovation Centre at
437
London South Bank University. This research is self-funded and did not receive any specific grant from funding
438
agencies in the public, commercial, or not-for-profit sectors.
439
Conflicts of Interest: The authors declare no conflict of interest.
440
441
Nomenclature
𝑆 Actual irradiance [W/m2]
𝑅𝑝 Solar panel internal resistance [Ω]
𝐼𝑠𝑐𝑛 Solar current generation [A]
T Time [s]
∆𝑇 Change in temperature difference [℃]
𝑆𝑛 Nominal irradiance [W/m2]
𝐼𝑝ℎ Photovoltaic current [A]
𝐾1 Temperature coefficient [˚C]
𝐼𝑜
Ion
Saturation current dependent on temperature
Nominal saturation current [A]
[A]
T Temperature [˚C]
𝑉𝑂𝑆
Pm
ISC
ɳc
ɳTref
Tref
Open circuit voltage
Maximum power
Short circuit current
correlation efficiency
panel electrical efficiency
Reference temperature
[V]
[W]
[A]
[%]
[%]
βref
To
Im
Vm
Temperature coefficient
Temperature increment
Maximum current
Maximum voltage
[℃]
[℃]
[A]
[V]
Abbreviations
MWh Electricity generated in Mega-Watt Hour
VDC DC Voltage
AK Azad Kashmir
KP
PV
Khyberpakhtoonkhaw
Photo-voltaic
442
References
443
1.
Parida,B.; Iniyan,S.; Goic,R. A review of solar photovoltaic technologies. Renew Sustain Energy Review, 2011,444
15, pp. 1625–36, DOI: doi.org/10.1016/j.rser.2010.11.032
445
2.
Bounechba,H.; Bouzid,A.; Snani,H.; Lashab,A. Real time simulation of MPPT algorithms for PV energy446
system, International Journal of Electrical Power & Energy Systems, 2016, 83, pp.67-78, DOI:
447
doi.org/10.1016/j.ijepes.2016.03.041.
448
3.
Javid, M.; Qayyum, A. Electricity consumption-GDP nexus in Pakistan: A structural time series analysis,449
Energy Journal, 2014, 64, pp. 811-817, DOI: doi.org/10.1016/j.energy.2013.10.051
450
4.
Ahmad, A.; Saqib, A. M.; Kashif, S.; Yaqoob, J.; Hameed, A.; Khan, U.M. Impact of wide-spread use of451
uninterruptible power supplies on Pakistan's power system. Energy Policy, 2016, 98, pp.629-636, DOI:
452
doi.org/10.1016/j.enpol.2016.09.039.
453
5.
Raza, A.S.; Shahbaz,M.; Nguyen, C.D. Energy conservation policies, growth and trade performance:454
Evidence of feedback hypothesis in Pakistan, Energy Policy, 2015, 80, pp. 1-10, DOI:
455
doi.org/10.1016/j.enpol.2015.01.011.
456
6.
Pickard, W. Smart Grids Versus the Achilles ‘heel of Renewable Energy: Can the Needed Storage457
Infrastructure Be Constructed Before the Fossil Fuel Runs Out. Proceedings of the IEEE, 2014, 102(7)7, pp.
458
1094-1105, DOI: 10.1109/JPROC.2014.2316359.
459
7.
Farrokhabadi, M.; Solanki, B.V; Canizares, C.A. Energy Storage in Microgrids: Compensating for460
Generation and Demand Fluctuations While Providing Ancillary Services, IEEE Power and Energy Magazine,
461
2015, 15(5), pp.81-91, DOI:10.1109/MPE.2017.2708863.
462
8.
Das, I.; Bhattacharya, K.; and Cañizares, C. Optimal Incentive Design for Targeted Penetration of463
Renewable Energy Sources. IEEE Transactions on Sustainable Energy, 2017, 5(4), pp.1213-1225. DOI:
464
10.1109/TSTE.2014.2339172.
465
9.
Sampaio, P.; Orestes, M.; González, A. Photovoltaic solar energy: Conceptual framework, Renewable and466
Sustainable Energy Reviews, 2017, 74, 590-60, DOI: doi.org/10.1016/j.rser.2017.02.081.
467
10.
Umrani. Z. Solar Energy: Challenges and opportunities in Pakistan. International Conference on Innovations468
in Electrical Engineering and Computational Technologies (ICIEECT), 2017, pp.1-1, DOI:
469
10.1109/ICIEECT.2017.7916603.
470
11.
Wakeel, M.; Chen, B.; Jahangir, S. Overview of Energy Portfolio in Pakistan. Energy Procedia, 2016, 88,71-471
75, DOI: doi: 10.1016/j.egypro.2016.06.024
12.
Rehman, W.; Sajjad, I.; Malik, T.; L. Martirano.; Manganelli, M. Economic analysis of net metering473
regulations for residential consumers in Pakistan, IEEE International Conference on Environment and Electrical
474
Engineering and 2017 IEEE Industrial and Commercial Power Systems Europe (EEEIC / I&CPS Europe), 2017,
475
pp.1-6, DOI:10.1109/EEEIC.2017.7977733.
476
13.
Qureshi, T.; KafaitUllah.; Arentsen,J. Factors responsible for solar PV adoption at household level: A case477
of Lahore, Pakistan. Renewable and Sustainable Energy Reviews, 2017, 78, pp.754-763, DOI: .
478
doi.org/10.1016/j.rser.2017.04.020.
479
14.
Khan, A.; Memon, S.; Sattar, T. Analysing integrated renewable energy and smart-grid systems to improve480
voltage quality and harmonic distortion losses at electric-vehicle charging stations. IEEE Access, 2018 6,
481
pp.26404-26415. DOI: 10.1109/ACCESS.2018.2830187.
482
15.
Hussain, A.; Rahman, M.; Memon, J. Forecasting electricity consumption in Pakistan: the way forward,483
Energy Policy, 2016, 90, 73-80, DOI: doi.org/10.1016/j.enpol.2015.11.028.
484
16.
Abdullah.; Zhou, D.; Shah, T.; Jebran, K.; Ali, S.; Ali, A. Acceptance and willingness to pay for solar home485
system: Survey evidence from northern area of Pakistan, Energy reports, 2017, 3, pp.54-60, DOI:
486
doi.org/10.1016/j.egyr.2017.03.002.
487
17.
Adnan, S.; Khan, H.; Haider, S.; Mahmood, R. Solar energy potential in Pakistan, Journal of Renewable and488
Sustainable Energy, 2012, 4, pp. 1–7, DOI: doi.org/10.1063/1.4712051.
489
18.
Farooqui, S. Prospects of renewables penetration in the energy mix of Pakistan. Renewable and Sustainable490
Energy Reviews, 2014, 29, pp 693-700, DOI: doi.org/10.1016/j.rser.2013.08.083.
491
19.
Amer, M.; Tugrul, U. Selection of renewable energy technologies for a developing county, Energy for492
Sustainable Development, 2011, pp.420-435, DOI: doi.org/10.1016/j.esd.2011.09.001.
493
20.
Ahmed, A.; Ahmed, F.; Akhtar, W. Estimation of global and diffuse solar radiation for Hyderabad, Sindh,494
Pakistan. Journal of Basic and Applied Sciences, 2009, 5, pp.73–79. ISSN: 1814-8085.
495
21.
Ahmed, A.; Ahmed, F.; Akhtar, W. Distribution of total and diffuse solar radiation at Lahore, Pakistan,496
Journal of Scientific Research, 2010, pp.37–43, ISSN 0555-7674.
497
22.
Mirza, K.; Ahmed, N,; Majeed, T.; Harijan, K. Wind energy development in Pakistan. Renewable and498
Sustainable Energy Reviews, 2007, pp. 2179–2190, DOI: doi.org/10.1016/j.rser.2006.03.003.
499
23.
Hara, S.; Kasu, M.; and Matsui, N. Estimation Method of Solar Cell Temperature Using Meteorological500
Data in Mega Solar Power Plant, IEEE Journal of Photovoltaics, 2016, 6(5), pp.1255-1260, DOI:
501
10.1109/JPHOTOV.2016.2589363.
502
24.
Ilahi, T.; Abid, M. Design and analysis of thermoelectric material based roof top energy harvesting system503
for Pakistan, Power Generation System and Renewable Energy Technologies (PGSRET), 2015, pp.1-3. DOI:
504
10.1109/PGSRET.2015.7312207.
505
25.
Kaushik, S.C.; Ranjan, K. R.; Panwar, N.L. Optimum exergy efficiency of single-effect ideal passive solar506
stills, Energy efficiency, 2013, 6(3), pp.595–606, DOI: doi.org/ 10.1007/s12053-013-9194-x.
507
26.
H, Bounechba.; Bouzid, A.; Snani, H.; Lashab, A. Real time simulation of MPPT algorithms for PV energy508
system, International Journal of Electrical Power & Energy Systems, 2016, pp.67-78, DOI:
509
doi.org/10.1016/j.ijepes.2016.03.041.
510
27.
Khalil, H.; Zaidi, S. Energy crisis and potential of solar energy in Pakistan, Renewable and Sustainable Energy511
Reviews, 2014, 31, pp. 194–201, DOI: doi.org/10.1016/j.rser.2013.11.023.
512
28.
Shaker, H.; Zareipour, H,; Wood, D. Estimating Power Generation of Invisible Solar Sites Using Publicly513
Available Data, IEEE Transactions on Smart Grid, 2016, 7(5), pp.2456-2465, DOI:
514
doi.org/10.1109/TSG.2016.2533164.
29.
Vadiee, A.; Yaghoubi, M.; Martin, V,; Bazargan-Lar, Y. Energy analysis of solar blind system concept using516
energy system modelling. Solar Energy, 2016, 139, pp.297-308, DOI: doi.org/10.1016/j.solener.2016.09.039.
517
30.
Villalba, A.; Correa, E.; Pattini, A. Hot-cool box calorimetric determination of the solar heat gain coefficient518
and the U-value of internal shading devices, Energy efficiency, 2017, 10(6), pp. 1553–1571, DOI:
519
10.1007/s12053-017-9544-1.
520
31.
Kılkış, Ş. (2017). A Nearly Net-Zero Exergy District as a Model for Smarter Energy Systems in the Context521
of Urban Metabolism, J. sustain. dev. energy water environ. Syst, 2017, 5(1), pp.101-126, DOI: doi.org/d5.0136.
522
32.
He, G.; Chen, Q.; Kang, C.; and Xia, Q. Optimal Offering Strategy for Concentrating Solar Power Plants in523
Joint Energy, Reserve and Regulation Markets, IEEE Transactions on Sustainable Energy, 2016, 7(3),
pp.1245-524
1254, DOI:10.1109/TSTE.2016.2533637.
525
33.
Sera, R.; Rodriguez, P. PV panel model based on datasheet values, Proc. IEEE Int. Symp. Ind. Electron. (ISIE),526
2007, pp.2392–2396. DOI:10.1109/ISIE.2007.4374981.
527
34.
Soto, W.; Klein, S.A.; Beckman, W.A. Improvement and validation of a model for photovoltaic array528
performance, Solar Energy, 2006, pp. 80, 78–88, DOI: doi.org/10.1016/j.solener.2005.06.010.
529
35.
Swaraj, K.; Mohapatra, A. Combining PV MPPT algorithm based on temperature measurement with a PV530
cooling system. International conference on Signal Processing, Communication, Power and Embedded System
531
(IEEE), 2016, pp.482 – 489, DOI: 10.1109/SCOPES.2016.7955876
532
36.
Dubey, S.; Sarvaiya, J.; Seshadri, B. Temperature Dependent Photovoltaic (PV) Efficiency and Its Effect on533
PV Production in the World A Review, Energy Procedia, 2012, 33, pp. 311–321, DOI:
534
doi.org/10.1016/j.egypro.2013.05.072.
535
37.
Zondag, H.A. Flat-plate PV-Thermal collectors and systems A review. Renewable and Sustainable Energy536
Reviews, 2008, 12(4), pp.891-959, DOI: doi.org/10.1016/j.rser.2005.12.012.
537
38.
Zandeckis, A.; Kirsanovs, V.; Dzikēvičs, M. Performance simulation of a solar- and pellet-based thermal538
system with low temperature heating solutions, Energy Efficiency, 2017, 10(3), pp. 729-74, DOI:
539
doi.org/10.1007/s12053-016-9482-3.
540
39.
Khan, A.; Memon, S.; Sattar, T. Integration and management of solar energy for electric vehicle charging541
station. Proceedings of ISES solar world congress, 2017, Abu Dhabi, UAE, ISBN 978-3-981 465 9-7-6.
542
DOI:10.18086/swc.2017.16.03
543
40.
Vivar, M.; Fuentes, M.; Castro, J.; Pachec, G. Effect of common rooftop materials as support base for solar544
disinfection (SODIS) in rural areas under temperate climates, Solar Energy, 2015, 115, pp. 204-216, DOI:
545
doi.org/10.1016/j.solener.2015.02.040.
546
41.
Kayo, G.; Suzuki, N. On-site Energy Management by Integrating Campus Buildings and Optimizing Local547
Energy Systems ‒ Case Study of the Campus in Finland, J. sustain. dev. energy water environ. Syst, 2016, 4(4),
548
pp.347-359, DOI: doi.org/10.13044/j.sdewes.2016.04.0027.
![Figure 1. Pakistan annual direct solar radiations [23]](https://thumb-us.123doks.com/thumbv2/123dok_us/7956512.1320122/2.595.57.473.358.714/figure-pakistan-annual-direct-solar-radiations.webp)
![Table 2. Average Ambient temperatures in most of the areas of Pakistan [41]](https://thumb-us.123doks.com/thumbv2/123dok_us/7956512.1320122/6.595.46.490.68.585/table-average-ambient-temperatures-areas-pakistan.webp)