ISSN(Online): 2319-8753 ISSN (Print): 2347-6710
I
nternational
J
ournal of
I
nnovative
R
esearch in
S
cience,
E
ngineering and
T
echnology
(A High Impact Factor, Monthly, Peer Reviewed Journal) Visit: www.ijirset.com
Vol. 8, Issue 8, August 2019
Lung Pattern Classification for Interstitial
Lung Diseases Using an Artificial Neural
Network
Rishali, Manish Choubisa
Research Scholar (CS), AIET, Jaipur, Rajasthan, India
Associate Professor, AIET,Jaipur, Rajasthan, India
ABSTRACT: Lung is the organ that allows us to breathe and lung disease are the disorders that affect the lungs. This paper presents a computer aided classification Method in Computer Tomography (CT) Images of lungs developed using ANN-BPN. The purpose of the work is to detect and classify the lung diseases by effective feature extraction through Dual-Tree Complex Wavelet Transform (DTCWT) and Gray Level Co-occurrence Matrix (GLCM) Features. The entire lung is segmented from the CT Images and the parameters are calculated from the segmented image. The parameters are calculated using GLCM. We Propose and evaluate the Artificial Neural Network -Back Propagation method designed for classification of Interstitial Lung Disease (ILD) patterns. We collect different types of CT images of lung and train artificial neural network. The parameters give the maximum classification Accuracy. After the result we propose the Fuzzy clustering to segment the lesion part from abnormal lung.
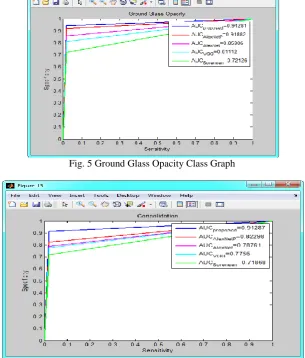
This data imbalance effect can be ameliorated by using data augmentation to generate more training images of rare or abnormal data, though there is risk of over fitting. Aside from data-level strategies, algorithmic modification strategies and cost sensitive learning have also been Analysis accuracy for different classes like AUC AUCalexnetp ,AUCalexnet ,AUCsoresen, AUCVGG the potential of CNNs in analyzing lung patterns. Finally classify the performance and trained and evaluated the CNN by MATLAB simulation and simulation result carried out 91% accuracy.
I. INTRODUCTION
ISSN(Online): 2319-8753 ISSN (Print): 2347-6710
I
nternational
J
ournal of
I
nnovative
R
esearch in
S
cience,
E
ngineering and
T
echnology
(A High Impact Factor, Monthly, Peer Reviewed Journal) Visit: www.ijirset.com
Vol. 8, Issue 8, August 2019
II. BLOCK DIAGRAM
Figure 1: Block diagram of lung pattern classification of ILD
A. Threshold Segmentation
Lung parenchyma mask
Image segmentation is a fundamental step in computerized image analysis and it deals with separating classes in an image into continuous and separate regions. For example, a CT slice from a thoracic scan may contain chest wall, heart segments in addition to lung tissues. The goal of segmentation in this case is to isolate the lung tissue
Figure 2: Illustration of the segmentation process. Left: a CT slice from a thoracic scan. Right: segmentation output, showing the isolated lung tissue.
ISSN(Online): 2319-8753 ISSN (Print): 2347-6710
I
nternational
J
ournal of
I
nnovative
R
esearch in
S
cience,
E
ngineering and
T
echnology
(A High Impact Factor, Monthly, Peer Reviewed Journal) Visit: www.ijirset.com
Vol. 8, Issue 8, August 2019
B. DTCWT
For many applications it is important that the transform be perfectly invertible. Some authors, including Lawton [Law93], have experimented with complex factorization of the standard Daubechies polynomials selectivity properties. DTCWT comes with a different approach in order to overcome this and obtained perfect reconstruction (PR) complex filters, but these do not give filters with good frequency drawback.
a) One-dimensional DTCWT
Kingsbury first introduced the DTCWT which relies on the observation that approximate shift invariance can be achieved with a real DWT by doubling the sampling rate at every level of the tree. For this to figure, the samples should be equally spaced. The sampling rates can be doubled by eliminating the down-sampling by 2 after the level 1 filter. This is equivalent to having two parallel fully-decimated trees a and b, like in fig. 3.4, provided that the delays of H0b and H1b are one sample offset fromH0a and H1a. Kingsbury found that, to induce uniform intervals between samples from the two trees below level one, the filters in one tree must provide delays that are half a sample different (at each filter input rate) from those within the alterative tree. This statement is additionally supported by Selesnick who, in [Sel01], gives an alternative derivation and explanation of the same result. The implementation of such a transform is completed using two mother wavelets, one for every tree, and one amongst them being (approximately) the Hilbert transform of the other. On one hand, the dual-tree DWT is viewed as an over complete wavelet transform with a redundancy issue of two. On the other hand, the dual-tree DWT is also a complex DWT, where the first and second DWTs represent the important and unreal parts of one complicated DWT. The first implementation projected had the constraint of linear phase, and to accomplish this, the implementation required odd-length filters in one tree and even-length filters within the other. Bigger symmetry between the two trees happens if every tree uses odd and even filters alternately from level to level, but this is not essential. In another implementation proposed in [Kin01], the condition of linear phase is dropped, resulting the so-called Q-shift dual tree. In this case all the filters beyond level 1 are even length and are designed to have a group delay of approximately 1
b) Shift Invariance
In order to examine the shift invariance properties of a transform, Kingsbury [Kin01] proposes a method based on the retention of only one type (details or approximations), from just one level of the decomposition tree. For example one may favor to retain only the level-3 detail coefficients and set all the others to zero. If the signal y reconstructed from simply these coefficients, is freed from aliasing then it is aforesaid that the transform is shift invariant at that level. The degree of shift invariance of two implementation schemes (one for the DTCWT and the other for the classical DWT) is presented in fig.4.
c) Two-dimensional DTCWT
ISSN(Online): 2319-8753 ISSN (Print): 2347-6710
I
nternational
J
ournal of
I
nnovative
R
esearch in
S
cience,
E
ngineering and
T
echnology
(A High Impact Factor, Monthly, Peer Reviewed Journal) Visit: www.ijirset.com
Vol. 8, Issue 8, August 2019
Figure 3: one dimensional DTCWT
III. RESULT
Figure 4: Output of the block diagram
ISSN(Online): 2319-8753 ISSN (Print): 2347-6710
I
nternational
J
ournal of
I
nnovative
R
esearch in
S
cience,
E
ngineering and
T
echnology
(A High Impact Factor, Monthly, Peer Reviewed Journal) Visit: www.ijirset.com
Vol. 8, Issue 8, August 2019
Fig. 5 Ground Glass Opacity Class Graph
Fig. 6 Consolaidation
In this we have to compare the input CT image with the database image. This can be done by validation process Comparison is done by the parameters like entropy, correlation function, mean and so on. If result is normal, then the process will be stopped. If result is abnormal, then we have to find where the disease is present exactly. The disease will be identified with the help of watershed segmentation. The affected part will be in the color. The output image will be clear and gives the detail about the lesion part.
IV. CONCLUSION
ISSN(Online): 2319-8753 ISSN (Print): 2347-6710
I
nternational
J
ournal of
I
nnovative
R
esearch in
S
cience,
E
ngineering and
T
echnology
(A High Impact Factor, Monthly, Peer Reviewed Journal) Visit: www.ijirset.com
Vol. 8, Issue 8, August 2019
This data imbalance effect can be ameliorated by using data augmentation to generate more training images of rare or abnormal data, though there is risk of over fitting. Aside from data-level strategies, algorithmic modification strategies and cost sensitive learning have also been Analysis
REFERENCES
[1] SOCIETY, BT. "The diagnosis, assessment and treatment of diffuse parenchymal lung disease in adults." Thorax 54, no. Suppl 1 (1999): [2] Demedts, M., and U. Costabel. "ATS/ERS international multidisciplinary consensus classification of the idiopathic interstitial pneumonias." European Respiratory Journal 19, no. 5 (2002): 794-796.
[3] I. Sluimer, A. Schilham, M. Prokop, and B. Van Ginneken, “Computer analysis of computed tomography scans of the lung: A survey,” IEEE
Trans. Med. Imaging, vol. 25, no. 4, pp. 385–405, 2006.
[4] K. R. Heitmann, H. Kauczor, P. Mildenberger, T. Uthmann, J. Perl, and M.Thelen,“Automatic detection of ground glass opacitieson lung HRCT
using multiple neural networks.,” Eur. Radiol., vol. 7, no. 9, pp. 1463–
[5] Delorme, Stefan, Mark-Aleksi Keller-Reichenbecher, pneumonia: quantitative assessment of high-resolution Investigative radiology 32, no. 9 (1997):566-574.Ivan Zuna, Wolfgang Schlegel, and Gerhard Van Kaick. "Usual interstitial computed tomographyfindingsbycomputer-assistedtexture-basedimageanalysis."
[6] R. Uppaluri, E. a Hoffman, M. Sonka, P. G. Hartley, G. W. Hunninghake, and G. McLennan, “Computer recognition of regional lung disease patterns.,” Am. J. Respir. Crit. Care Med., 160 (2) , pp. 648–654, 1999.
[7] C. Sluimer, P. F. van Waes, M. a Viergever, and B. van Ginneken, “Computer-aided diagnosis in high resolution CT of the lungs.,” Med. Phys., vol. 30, no. 12, pp. 3081–3090, 2003.
[8] Y. Song, W. Cai, Y. Zhou, and D. D. Feng, “Feature-based image patch approximationforlungtissueclassification,”IEEETrans.Med.Imaging, vol. 32, no. 4, pp. 797–808,2013.
[9] M. Anthimopoulos, S. Christodoulidis, a Christe, and S. Mougiakakou, “Classification of interstitial lung disease patterns using local DCT features and random forest,” 2014 36th Annu. Int. Conf. IEEE Eng. Med. Biol. Soc., pp. 6040–6043, 2014.
[10] Y. Uchiyama, S. Katsuragawa, H. Abe, J. Shiraishi, F. Li, Q. Li, C.-T. Zhang, K. Suzuki, and K. Doi, “Quantitative computerized analysis of diffuse lung disease in high-resolution computed tomography,” Med. Phys., vol. 30, no. 9, pp. 2440–2454, 2003.
[11] K. T. Vo and A. Sowmya, “Multiple kernel learning for classification of diffuse lung disease using HRCT lung images.,” Conf. Proc. IEEE Eng. Med. Biol. Soc., vol. 2010, pp. 3085–3088, 2010.
[12]A.Depeursinge,D.VanDeVille,A.Platon,A.Geissbuhler,P.A.Poletti, and H. Muller, “Near-affine-invariant texture learning for lung tissue analysis using isotropic wavelet frames,” IEEE Trans. Inf. Technol. Biomed., vol. 16, no. 4, pp. 665–675,2012