Lifetime measurements in mass regions A=100 and A=130 as a test
for chirality in nuclear systems
D. Tonev1,a, M. S. Yavahchova1, G. de Angelis2, S. Brant3, S. Frauendorf4,5, P. Petkov1, A. Dewald6, Q. Zhong7, D. Curien8, N. Goutev1, R.K. Bhowmik9, R.P. Singh9, S. Muralithar9, N. Madhavan9, R. Kumar9, M. Kumar Raju10, J. Kaur11, G. Mahanto9, A. Singh11, N. Kaur11, R. Garg12, A. Sukla13, E. Geleva1, and Ts. K. Marinov1
1Institute for Nuclear Research and Nuclear Energy, BAS, Sofia, Bulgaria 2INFN, Laboratori Nazionali di Legnaro, Legnaro, Italy
3Department of Physics, Faculty of Science, Zagreb University, Zagreb, Croatia 4Department of Physics, University of Notre Dame, Notre Dame, Indiana 46556, USA 5Institute for Radiation Physics, Research center Rossendorf, D-01314 Dresden, Germany 6Institut für Kernphysik der Universität zu Köln, Köln, Germany
7Department of Nuclear Physics, China Institute of Atomic Energy, Beijing, People’s Republic of China 8Institut de Recherches Subatomiques, Strasbourg, France
9Inter-University Accelerator Center, New Delhi, India
10Nuclear Physics Department, Andhra University, Visakhapatnam, India 11Department of Physics, Punjab University, Chandigarh, India
12Department of Physics and Astrophysics, Delhi University, New Delhi, India 13Department of Physics, Banaras Hindu University, Varanasi, India
Abstract.Two odd-odd nuclei from theA ∼100 andA∼130 regions, namely102Rh and134Pr have been
studied in search for chiral doublet bands via94Zr(11B,3n)102Rh and119Sn(19F,4n)134Pr reactions, respectively.
Two nearly degenerate bands built on theπg9/2⊗νh11/2 configuration have been identified in102Rh and on
theπg11/2⊗νh11/2 configuration for134Pr. Lifetimes of excited nuclear states were measured using
Doppler-shift attenuation method and recoil distance Doppler-Doppler-shift method. The deexciting gamma rays were registered
by the Indian National Gamma Array for102Rh and using the EUROBALL IV detector array with an inner
Bismuth Germanate (BGO) ball for134Pr, respectively. Polarization and angular correlation measurements have
been performed to establish the spin and parity assignments for these bands. The derived reduced transition
probabilities are compared to the predicitons of the two quasiparticles+triaxial rotor and interacting boson
fermion-fermion models.
1 Introduction
Chirality is a phenomenon which is often found in nature. Examples of systems demonstrating chirality are present in chemistry, biology, high energy physics, etc. Chiral-ity has recently been proposed as a novel feature of ro-tating nuclei [1–3]. A spontaneous breaking of the chiral symmetry can take place for configurations where the an-gular momenta of the valence protons, valence neutrons, and the core are mutually perpendicular [1]. This can oc-cur, for example, when the proton and neutron Fermi lev-els are located in the lower part of valence proton
high-j (particle-like) and in the upper part of valence neutron
high-j(hole-like) subshells and the core is triaxial. Under
such conditions, the angular momenta of the valence par-ticles are aligned along the short and long axes of the tri-axial core, while the angular momentum of the rotational core is aligned along the intermediate axis. The projec-tions of the angular momentum vector on the three
prin-ae-mail: [email protected]
cipal axes can form either a left- or a right- handed sys-tem and therefore the syssys-tem expresses chirality. Since the chiral symmetry is dichotomic, its spontaneous breaking by the axial angular momentum vector leads to a pair of
degenerateΔI =1 rotational bands, called chiral doublet
bands. Pairs of bands, presumably due to the breaking of the chiral symmetry in triaxial nuclei, have been found in
the mass regionsA∼130 [4–9],A∼105 [10–15] andA∼195
[16–18], andA∼80 [19]. There is also a significant
inter-est from theoretical point of view to invinter-estigate the chi-ral phenomenon [2, 20–24]. However, only in few cases
(126Cs [25],128Cs [8] and198Tl [17]) the systematic
prop-erties [26] of the chiral bands, which originate from the underlying symmetry, were confirmed including the
tran-sition from chiral vibrations to static chirality in (135Nd)
[9]. Thus, the yrast and side bands should be nearly degen-erate. Characteristic selection rules for electromagnetic transitions, as discussed, e.g., in [27–29], provide a finger-print of the ideal static chirality. In the region where the
chiral symmetry sets up theB(E2) values of the
magnetic transitions de-exciting analog states of the chi-ral twin bands should be almost equal. Correspondingly,
theB(M1) values should exhibit odd-even staggering. The
B(M1) values for ΔI =1 transitions connecting the side
to the yrast band should have odd-even staggering which
is out of phase with respect to theB(M1) staggering for
transitions de-exciting states in the yrast band. The main goal of the present work was to check for the existence of
chirality in the mass regions A∼100 and A∼130.
2 Experiments
2.1 102Rh
Excited states in102Rh were populated using the reaction
94Zr(11B,3n)102Rh at a beam energy of 36 MeV. The beam
was delivered by the 15-UD Pelletron accelerator at the Inter University Accelerator Center (IUAC) in New Delhi
[30, 31]. The target consisted of 0.9 mg/cm2 94Zr, enriched
to 96.5%, evaporated onto a 8 mg/cm2gold backing. The
recoils were leaving the target with a mean velocityvof
about 0.9 % of the velocity of light, c. The target and
backing were chosen to ensure lifetime determination in the sub-picosecond region using the Doppler-Shift Atten-uation Method (DSAM).
The de-exciting gamma-rays were registered by the In-dian National Gamma Array (INGA), whose 15 Clover
detectors are accommodated in a 4πgeometry [32]. For
the purposes of the DSAM analysis the detectors of INGA were grouped into rings with approximately the same po-sition with respect to the beam axis. The rings where ap-preciable Doppler-shifts are observed are these at angles of 32, 57, 123 and 148 degrees. Gain matching and ef-ficiency calibration of the Ge detectors were performed
using 152Eu and133Ba radioactive sources before sorting
the data in matrices and cubes. The events were unfolded
and sorted intoγ-γcoincidence matrices. For the lifetime
analysis, matrices were constructed where one of theγ
-rays was detected at an angle with a significant Doppler-shift whereas on the other axis detection by all detectors of INGA was allowed. To measure intensities, a matrix was
constructed where theγ-rays were detected on both axes
by all detectors of INGA.
2.2 134Pr
Excited states in 134Pr were populated using the
reac-tion 119Sn(19F,4n)134Pr. The beam was delivered by the
Vivitron accelerator at IReS in Strasbourg. Lifetimes of the states were measured using both the recoil distance Doppler-shift (RDDS) and the Doppler-shift attenuation (DSAM) methods. For the RDDS measurement, a beam with an energy of 87 MeV was used. The target consisted
of 0.5 mg/cm2 119Sn foil facing the beam. The recoils,
leaving the target with a velocity of 0.98 (2) % of the
ve-locity of light, were stopped in a 6.0 mg/cm2 gold foil.
For the DSAM measurement, a beam energy of 83 MeV
was used. The target consisted of 0.7 mg/cm2 119Sn,
evap-orated onto a 9.5 mg/cm2 181Ta backing used to stop the
recoils. The deexcitingγrays were detected using the
EU-ROBALL IV detector array composed of 26 clover and 15 cluster Ge detectors and an inner BGO ball [33]. The clus-ter and clover detectors of EUROBALL were grouped into rings corresponding to aproximately the same polar an-gle with respect to the beam axis. For the present RDDS and DSAM measurements, the rings of main interest are those where appreciable Doppler shifts can be observed. These are the rings 5, 6, 7, 8, 9, and 10 at angles of 122.6, 130.4, 137.6, 147.5, 156.1, and 163.5 degrees,
respec-tively. Events were collected when at least threeγ rays
in the Ge cluster or clover segments and three segments of the inner ball fired in coincidence. Gain matching and
efficiency calibration of the Ge detectors were performed
using 152Eu, 133Ba and56Co radioactive sources. In the
RDDS case data were taken at 20 target-to-stopper
dis-tances ranging from electrical contact to 2500μm.
3 Data analysis and results
3.1 102Rh
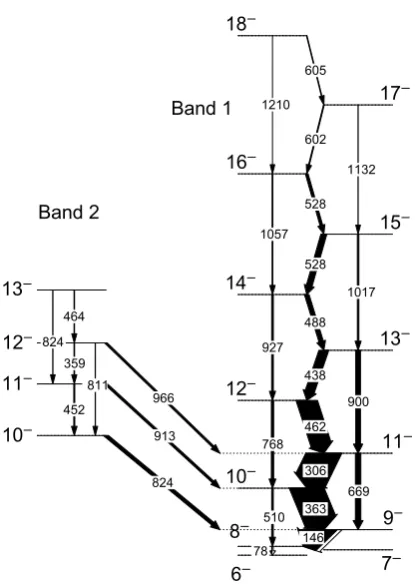
In order to investigate the level scheme reported in Fig. 1 and electromagnetic properties of the transitions of
inter-est in102Rh we have performed four types of data
analy-ses. The ordering of the transitions in the level scheme was
determined according toγ-ray relative intensities,γ-γ
co-incidence relationships, andγ-ray energy sums. The
elec-tric or magnetic character and multipolarity of the transi-tions were deduced by linear polarization and angular cor-relations measurements, respectively. The lifetimes were derived by using the DSAM. Such complex approach is employed for the first time in the case of the investiga-tion of chirality in nuclei. The angular correlainvestiga-tion funcinvestiga-tion for two successive transitions from oriented states depends on the spins of initial, intermediate and final levels, and on the multipole mixing ratios [34]. In the present work, the angular correlation analysis was carried out with the computer code CORLEONE [35]. The best fit confirms
the spin hypothesis 11→10→9. In the present
experi-ment, we used the four Clover detectors from the ring at 90 degrees with respect to the beam axis as one compos-ite Compton polarimeter. The coincidence signals from the respective arms of the polarimeter, perpendicular and parallel to the reaction plane, were summed-up to improve
the statistics. The difference spectrum in Fig. 2 reflects the
linear polarization of the transitions observed. The nega-tive lines correspond to transitions of predominantly mag-netic character while the positive lines correspond to tran-sitions of predominantly electric character. The electro-magnetic character of all previously known transitions was confirmed. As clearly seen, the transitions of 824 and 966 keV linking the two bands have predominantly magnetic
character (M1) which leads to the assignment of negative
parity to Band 2. In this way, the level scheme shown in Fig. 1 was derived. The Doppler-shift attenuation method was utilized to determine the lifetimes of excited states in
102Rh. The analysis was carried out within the framework
of the Differential decay method (DDCM) [36] according
605
602
1132
528
1017 528
488 1057
927
900
768 438
462
306
363
146 669
510 452
811 966
913
824 359
464
824
1210
78 18
16
14
12
10
8
17
15
13
11
9
7 6
10 11 12 13
Band 2
Band 1
Figure 1. Partial level scheme of 102Rh. Two negative-parity
bands, candidates for chiral partner bands, are indicated as Band 1 and Band 2.
Table 1.Derived lifetimes in Band 1 and Band 2 of102Rh.
Band 1
Eex1[keV] State [Iπ] τ[fs]
1576 (11)−1 458(44)
2038 (12)−1 227(58)
2477 (13)−1 320(71)
2965 (14)−1 170(25)
3494 (15)−1 117(39)
4022 (16)−1 68(14)
Band 2
Eex2[keV] State [Iπ] τ[fs]
1731 (10)−2 163(52)
2183 (11)−2 156(60)
2542 (12)−2
Monte-Carlo simulation of the slowing down process, de-termination of stopping powers, and fitting of line shapes can be found. For each level, lifetimes were derived in-dependently at the four rings with appreciable Doppler-shifts. Their final values, obtained by averaging while pay-ing attention to systematic errors are presented in Table 1. Thus, we have succeeded to extend the known level
scheme [38] by a newΔI =1 band with a negative
par-ity and to determine 8 new lifetimes. The present results come to supercede the preliminary level-scheme published in [39]. More detailed information can be found in [40]. A comparison between theoretically calculated and
exper-imentaly derivedB(M1) and B(E2) values for the case of
102Rh are shown in Fig. 3 and discussed later.
-50 0 50 100 150
Intensity
(arbitr
ar
y
u
nits)
600 700 800 900 1000
Gamma-ray energy (keV)
631.3
653.0
669.2
705.7
727.1
736.6
758.9
766.9
783.0
830.7
864.5
886.2
900.3
909.1
991.7
824.3 913.5 966.4
Figure 2.The difference of the coincidence spectra registered by the perpendicular and parallel arms of the composite Compton polarimeter indicates predominantly magnetic or electric char-acter of the transitions. It is clearly seen that transitions with energies 824.3, 913.5, and 966.4 keV have magnetic character.
0.0 0.05 0.10 0.15 0.20 0.25 0.30 0.35 0.40 0.45 0.50
B(E2)
(e
2 b 2 )
6 8 10 12 14 16 18 20 Band 1
Experiment
0.0 0.05 0.1 0.15 0.2 0.25 0.3 0.35 0.4
B(E2)
(e
2b 2)
6 8 10 12 14 16 18 20
Spin I [h]
Band 1 Band 2
TQPTR
0.0 0.5 1.0 1.5 2.0 2.5 3.0 3.5 4.0 4.5 5.0
B(M1,
I
I-1)
(nm
2)
6 8 10 12 14 16 18 20 Band 1
Band 2
Experiment
0.0 0.5 1.0 1.5 2.0 2.5 3.0 3.5 4.0
B(M1,
I
I-1)
(nm
2)
6 8 10 12 14 16 18 20
Spin I [h]
Band 1 Band 2
TQPTR
Figure 3. (Color online) Experimentally derived and
theoret-ically calculatedB(E2) and B(M1) transition strengths in
chi-ral candidate bands of102Rh. In the upper panels experimental
B(E2) and B(M1) values for transitions in Band 1 and Band 2
are presented. In the second row, the results of TQPTR calcula-tions are displayed.
3.2 134Pr
In Fig. 4, the two bands, candidates for chiral partner bands are displayed. For the analysis of the RDDS data,
has been employed the standard version of the differential
decay-curve method (DDCM) [41], with gates set on both shifted (S) and unshifted (U) components of a transition depopulating levels below the level of interest. For each
flight timet, a lifetime valueτfor the level of interest is
6 7 8 9 10 11 12 13 14 15 16 17 18 19 20 21 22 8 9 10 11 12 13 14 15 16 17 18 19 20 21 22 23 24 306 39 94 171 287 306 416 395 495 481 546 521 539 499 440 473 458 593 722 811 890 976 1027 1067 1060 1038 939 913 390 167 204 167 283 324 369 400 472 467 590 475 696 1192 1191 1212 1171 1065 1057 939 872 769 706 661 257 518 722 624 628457 170 795 620 907 638 944 559 533 928 933 438 910 1110 989 443 337
Band 1
Band 2
Figure 4. Partial level scheme of 134Pr. Two nearly
degener-ate positive-parity bands, candiddegener-ates for chiral partner bands, are indicated as Band1 and Band 2.
of a transition depopulating the investigated level and of the directly feeding transitions. A lifetime value is derived
at each distance and the final result forτis determined as
an average of such values within the sensitivity region of the data. More details about the DDCM applied to RDDS measurements can be found in Refs. [36, 41]. For the anal-ysis of the DSAM data, we performed a Monte Carlo sim-ulation of the slowing-down histories of the recoils using a modified [34, 42] version of the program DESASTOP [43]. The analysis of the line shapes was carried out ac-cording to the DDCM for treating DSAM data [36, 37]. The results are shown in the Table 2. The clover rings of
Euroball form a highly efficient Compton polarimeter. On
the basis of directional correlation ofγradiation from
ori-ented states [44] and linear polarization analysis, an M1
character with negligibleE2 component was assigned to
theΔI = 1 intraband transitions. TheΔI = 2 intraband
transitions show an E2 character. The interband
transi-tions withΔI =2 have anE2 character and the interband
transitions withΔI=1 show a mixedM1+E2 character.
More detailed information can be found in [45, 46].
4 Discussion
4.1 102Rh
To study the bands build on πg9/2 ⊗νh11/2
configura-tion, we have performed two quasiparticles+triaxial
ro-tor (TQPTR) calculations in the framework of the model presented in Ref. [47]. The Hamiltonian of this model in-cludes the rotational energy of the core, the quasiparticle
8 10 12 14 16 18 20 22 0.0 0.05 0.10 0.15 0.20 0.25 0.30 0.35 0.40 B(E2) (e 2 b 2 ) Band 1 Band 2 Experiment
8 10 12 14 16 18 20 22 0.0 0.1 0.2 0.3 0.4 0.5 0.6 B(E2) (e 2b 2) Band 1 Band 2 TQPTR
8 10 12 14 16 18 20 22 Spin I [h] 0.0 0.05 0.10 0.15 0.20 0.25 0.30 0.35 0.40 B(E2) (e 2 b 2 ) Band 1 Band 2 IBFFM
8 10 12 14 16 18 20 22 0.0 0.5 1.0 1.5 2.0 2.5 B(M1, I I-1) (nm
2) Band 1
Band 2
Experiment
8 10 12 14 16 18 20 22 0.0 0.5 1.0 1.5 2.0 2.5 B(M1, I I-1) (nm 2) Band 1 Band 2 TQPTR
8 10 12 14 16 18 20 22 Spin I [h] 0.0 0.5 1.0 1.5 2.0 2.5 B(M1, I I-1) (nm
2) Band 1
Band 2
IBFFM
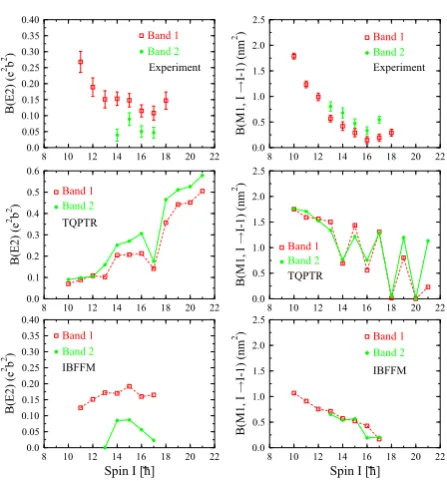
Figure 5.(Color online) Experimentally determined and
theoret-ically calculatedB(E2) andB(M1) transition strenghts in chiral
candidate bands of134Pr. In the upper panels experimentalB(E2)
andB(M1) values for transitions in Band 1 and Band 2 are
pre-sented. In the second row, the results of TQPTR calculations are displayed. In the panel of the bottom the predictions of the IBFFM are presented.
energies of the odd proton (π) and neutron (ν), and a
resid-ual proton-neutron interactionVπν. The core is treated as
a rigid body with a fixed overall quadrupole deformation
and a triaxiality parameter γ. More details about the
single-particle states involved and the Nilsson parameters
used can be found in Ref. [48]. The parameters andγ
were varied until reasonable fit of the energies and transi-tion probabilities in the lowest two negative-parity bands
was obtained for the values of=0.25 andγ=20◦. In the
TQPTR calculation, both yrast and yrare negative - par-ity bands are based on the 11th proton orbital with posi-tive parity and on the 14th neutron orbital with negaposi-tive
parity. They originate from theπg9/2andνh11/2subshells
and are associated at γ=0◦ with the Nilsson
configura-tions 7/2+[413] and 1/2−[550], respectively. The
calcu-lated transition strengths are compared to the experiment
in Fig. 3. The theoreticalB(E2)’s reproduce quite well the
absolute values and the increasing trend of the
experimen-tal data after spin I=14. At lower spins, the
descrip-tion is worse since the rigid rotor approach cannot explain the small drop of the experimental values between spins 9
and 13. The comparison between the experimental and
calculatedB(M1) transition strengths leads to the
conclu-sion that the TQPTR calculations reproduce roughly the data in Band 1, but overestimate the transition strengths in
Band 2 (at spins 10,11). The differences in the absolute
B(M1) transition strengths in Band 1 and Band 2, together
stagger-ing of the two data sets, indicate that the expectations for
the observation of a static chirality in 102Rh are not
re-alized. Also, the TQPTR calculations reveal that the
opti-mum value of the triaxiality parameterγ=20◦differs from
the value of 30◦characterizing the static chiral case. The
difference in the core contribution to the yrast and yrare
negative-parity bands mentioned above point that dynamic
effects as coupling of the quasiparticles to fluctuations of
the shape of the core may lead to differences in the
prop-erties of these two bands.
4.2 134Pr
The energies and electromagnetic transition probabilities
of the chiral candidate bands in134Pr are calculated both
in the framework of the two-quasiparticle triaxial rotor model (TQPTR) as described in Refs. [1, 47] and of the IBFFM [49, 50]. IBFFM model is based on the interacting boson model (IBM-1) [51, 52] for even-even nuclei and the interacting boson-fermion model (IBFM-1) [53, 54]
for odd-A nuclei. A detailed procedure of this
calcula-tion and the parameter choice can be found in [55]. Re-duced transition probabilities obtained from the present experiment are shown in Fig. 5, where in the upper
pan-els experimental B(E2) and B(M1) values for transitions
in Band 1 and Band 2 are presented. In the second row the results of TQPTR calculations are displayed. In the bottom the predictions of the IBFFM model are presented. For the TQPTR, the ratio between the moments of iner-tia have been calulated by cracking about the three princi-ple axes using the parameters reported in Ref. [2]. In the IBFFM calculation, the proton and neutron are coupled to the triaxial core as described in Ref. [55]. Both descrip-tions include the coupling between the odd particles and the even-even core in a similar way, taking into account
the partial filling of the h11/2 shells. The orientation in
space is the only core degree of freedom in the TQPTR model. In IBFFM the deformation of the core is taking into account as an additional degree of freedom. The re-sults of both calculations are shown in Fig. 5. The com-parison with the experimental data show a clear disagree-ment with TQPTR results and much better matching with the IBFFM calculation. As already pointed out in preced-ing publication [45], measured electromagnetic transition probabilities deviate substantially from the TQPTR
calcu-lations. The calculatedB(M1) values show a pronounced
staggering behaviour, the reason of which was discussed for a special case in Ref. [27]. In the case of IBFFM, the
calculated in-bandB(E2) values for Band 1 (Fig. 5) are in
good agreement with the measured values [45]. For Band
2 experimental and IBFFM inband B(E2) values for I =
14 - 17are in almost perfect agreement. As seen in the
figure, the calculated and experimentalB(M1) values are
nearly the same in both bands [45]. Such results indicate that shape fluctuations are an essential ingredient for the proper description of the structure of the two bands. The TQPTR calculation shows a transition from dynamic to static chirality with increasing spin. In the IBFFM model,
the fluctuations of the triaxiality parameter γ around its
Table 2.Derived lifetimes in Band 1 and Band 2 of134Pr. The
experimental technique is also indicated.
Band 1 Band 2
State [Iπ] τ[ps] State [Iπ] τ[ps]
(10)+1 4.93(15) RDDS (13)+2 1.443(50)
(11)+1 1.614(326) RDDS (14)+2 1.280(50)
(12)+1 1.425(130) RDDS
(13)+1 0.904(50) RDDS
(14)+1a 0.882(147) DSAM (15)+2a 0.887(47)
(15)+1 0.608(68) DSAM (16)+2 0.824(52)
(16)+1 0.562(47) DSAM (17)+2 0.353(49)
(17)+1 0.422(30) DSAM
(18)+1 0.249(10) DSAM
γ
mean value of 30◦ admix near-axial shapes, which are
achiral. This additional left-right coupling strongly
in-creases the difference between the intrabandB(E2) values.
A pronounced staggering of the B(M1) values appears in
the TQPTR model while in the IBFFM calculations it is absent in the data.
5 Conclusions
Lifetimes in102Rh were measured by means of the
Dop-pler-shift attenuation method and in134Pr were measured
by means of DSAM and RDDS methods. In both experi-ments the branching ratios and electric or magnetic char-acter of the transitions were also investigated. For the in-terpretation of our results we applied two theoretical mod-els, TQPTR and IBFFM. In the case of the TQPTR the core is a rigid triaxial rotor, the deformation of which and its moments of inertia were calculated by means of the TAC mean field theory. The TQPTR takes into account only the orientation of the angular momenta of the
parti-cle, of the hole, and of the core. For the134Pr nuclei the
TQPRT model describes very well the energies of the two
bands. The calculations give strongB(M1) values (and
un-stretched B(E2) values) that alternate with spin between
in-band and interband transitions, whereas the experimen-tal inband values are large and the interband values are small.
In the case of102Rh the comparison between the
ex-perimental and calculatedB(M1) transition strengths leads
to the conclusion that the TQPTR calculations reproduce roughly the data in Band 1 and are consistent with the
tran-sition strengths in Band 2 at spin 11. The absence of an
appreciable staggering of the data in Band 1 indicates that the expectation for the observation of a static chirality are not realized. Also, the TQPTR calculations reveal that the
optimum value of the triaxiality parameter γ =20◦
dif-fers from the value of 30◦ characterizing the static chiral
case. In the case of134Pr we performed IBFFM
calcula-tions, where the IBFFM core has the deformation parame-ters as additional degrees of freedom, which are described
by the IBM. The γ- decay properties of the levels,
cal-culated in this framework, are in excellent agreement with experimental data. Our lifetime measurements and the the-oretical analysis do not support static chirality in both
mainly a dynamical character. Thereby the coupling due to shape fluctuations may play a central role.
Acknowledgements
This research has been supported by Bulgarian Science Fund
un-der Contract No. DFNI-E 01/2 and by a NUPNET-NEDENSAA
project funded by the Bulgariana Ministry of Education and Sci-ence. INGA was funded by the Department of Science and
Technology, Government of India(Grant No. IR/S2/PF-03/
2003-I) and the University Grants Commission.
References
[1] S. Frauendorf and J. Meng, Nucl. Phys.A 617, 131
(1997)
[2] V.I. Dimitrov, S. Frauendorf, and F. Dönau, Phys.
Rev. Lett.84, 5732 (2000)
[3] K. Starosta, T. Koike, C. J. Chiara, Nucl. Phys. A
682, 375c (2001)
[4] K. Starostaet al., Phys. Rev. Lett.86, 971 (2001)
[5] S. Zhuet al., Phys. Rev. Lett.91, 132501 (2003)
[6] G. Rainovskiet al., Phys. Rev. C68, 024318 (2003)
[7] A.A. Hechtet al., Phys. Rev. C68, 054310 (2003)
[8] E. Grodneret al., Phys. Rev. Lett.97, 172501 (2006)
[9] S. Mukhopadhyayet al., Phys. Rev. Lett.99, 172501
(2007)
[10] C. Vamanet al., Phys. Rev. Lett.92, 032501 (2004)
[11] P. Joshiet al., Phys. Lett. B595, 135 (2004)
[12] J. Timáret al., Phys. Lett. B598, 178 (2004)
[13] J. Timáret al., Phys. Rev. C73, 011301 (2006)
[14] T. Suzukiet al., Phys. Rev. C78, 031302 (2008)
[15] E.O. Lieder et al., Phys. Rev. Lett. 112, 202502
(2014)
[16] E.A. Lawrieet al., Phys. Rev. C78, 021305 (2008)
[17] E.A. Lawrieet al., Eur. Phys. J. A45, 39 (2010)
[18] P.L. Masitenget al., Eur. Phys. J. A50, 119 (2014)
[19] S.Y. Wanget al., Phys. Lett. B703, 40 (2011)
[20] J. Peng, J. Meng, and S.Q. Zhang, Phys. Rev. C68,
044324 (2003)
[21] P. Olbratowski et al., Phys. Rev. Lett.93, 052501
(2004)
[22] J. Menget al., Phys. Rev. C73, 037303 (2006)
[23] H.G. Ganevet al., Phys. Rev. C79, 044322 (2009)
[24] H.G. Ganev and S. Brant, Phys. Rev. C82, 034328
(2010)
[25] E. Grodneret al., Phys. Lett. B703, 46 (2011)
[26] S. Brantet al., Phys. Rev. C78, 034301 (2008)
[27] T. Koike, K. Starosta, and I. Hamamoto, Phys. Rev.
Lett.93, 172502 (2004)
[28] S.Y. Wanget al., Chinese Phys. Lett.24, 664 (2007)
[29] J. Meng and S.Q. Zhang, J. Phys. G: Nucl. Part. Phys.
37, 064025 (2010)
[30] G.K. Mehta and A.P. Patro, Nucl. Instrum. Methods
Phys. Res., Sect. A268, 334 (1988)
[31] D. Kanjilalet al., Nucl. Instrum. Methods Phys. Res.,
Sect. A328, 97 (1993)
[32] S. Muralithar et al., Nucl. Instrum. Methods Phys.
Res., Sect. A622, 281 (2010)
[33] J. Simpson, Z. Phys. A358, 139 (1997)
[34] K.S. Kraneet al., Nucl. Data Tables11, 351 (1973)
[35] I. Wiedenhöveret al., Phys. Rev. C58, 721 (1998)
[36] G. Böhmet al., Nucl. Instr. Meth. Phys. Res., Sect.
A329, 248 (1993)
[37] P. Petkovet al., Nucl. Phys. A640, 293 (1998)
[38] J. Gizonet al., Nucl. Phys. A658, 97 (1999)
[39] S.C. Pancholi,Exotic Nuclear Excitations(Springer,
New York, 2011)
[40] D. Tonevet al., Phys. Rev. Lett.112, 052501 (2014)
[41] A. Dewaldet al., Z. Phys. A334, 163 (1989)
[42] P. Petkovet al., Nucl. Instrum. Methods Phys. Res.,
Sect. A431, 208 (1999)
[43] G. Winter, Nucl. Instrum. Methods214, 537 (1983)
[44] C.M. Petracheet al., Nucl. Phys. A597, 106 (1996)
[45] D. Tonevet al., Phys. Rev. Lett.96, 052501 (2006)
[46] D. Tonevet al., Phys. Rev. C76, 044313 (2007)
[47] I. Ragnarsson and P. Semmes, Hyperfine Interact.43,
425 (1988)
[48] M.-G. Porquetet al., Eur. Phys. J. A15, 463 (2002)
[49] V. Paar, in Capture Gamma-rays Spectroscopy and
Related Topics-1984, ed. S. Raman, AIP Conf. Proc. No. 125 (AIP, New York, 1985), p.70; S. Brant, V.
Paar, and D. Vretenar, Z. Phys. A319, 355 (1984);
V. Paar, D.K. Sunko, and D. Vretenar, Z. Phys. A
327, 291 (1987)
[50] S. Brant and V. Paar, Z. Phys. A329, 151 (1988)
[51] F. Iachello and A. Arima, The Interacting Boson
Model (Cambridge University Press, Cambridge, 1987)
[52] A. Arima and F. Iachello, Phys. Rev. Lett. 35, 157
(1975); Ann. Phys. (NY)99, 233 (1976); 111, 201
(1978);123, 468 (1979)
[53] F. Iachello and O. Scholten, Phys. Rev. Lett.43, 679
(1979)
[54] F. Iachello and P. Van Isacker,The Interacting
Boson-Fermion Model(Cambridge University Press, Cam-bridge, 1991)