University of South Carolina
Scholar Commons
Theses and Dissertations
8-9-2014
An Investigation of Mitochondrial Bioenergetics
and the Turnover of Succinated Proteins in the
Adipocyte during Diabetes
Ross Tanis
University of South Carolina - Columbia
Follow this and additional works at:https://scholarcommons.sc.edu/etd Part of theBiology Commons
This Open Access Thesis is brought to you by Scholar Commons. It has been accepted for inclusion in Theses and Dissertations by an authorized administrator of Scholar Commons. For more information, please contactdillarda@mailbox.sc.edu.
Recommended Citation
Tanis, R.(2014).An Investigation of Mitochondrial Bioenergetics and the Turnover of Succinated Proteins in the Adipocyte during Diabetes.
An Investigation of Mitochondrial Bioenergetics and the Turnover of Succinated Proteins in the Adipocyte during Diabetes
By Ross Tanis Bachelor of Science Michigan State University 2009
Submitted in Partial Fulfillment of the Requirements For the Degree of Master of Science in
Biomedical Sciences School of Medicine University of South Carolina
2014 Accepted by:
Norma Frizzell, Director of Thesis Edie Goldsmith, Reader
L. Britt Wilson, Reader
ii
iii Dedication
I would like to dedicate this thesis to my parent’s Robert and Marie Tanis as well as my brother James Tanis. With their support I have always been given the opportunity to pursue my dreams and goals. My mentor Dr. Norma Frizzell has made all of this possible
iv
Acknowledgements
I would like to thank my mentor, Dr. Norma Frizzell, first and foremost for making this opportunity possible and allowing me to pursue my Master’s Degree in her laboratory. I would like to give a special thanks to Dr. Gerardo Piroli for his expertise and advice
v Abstract
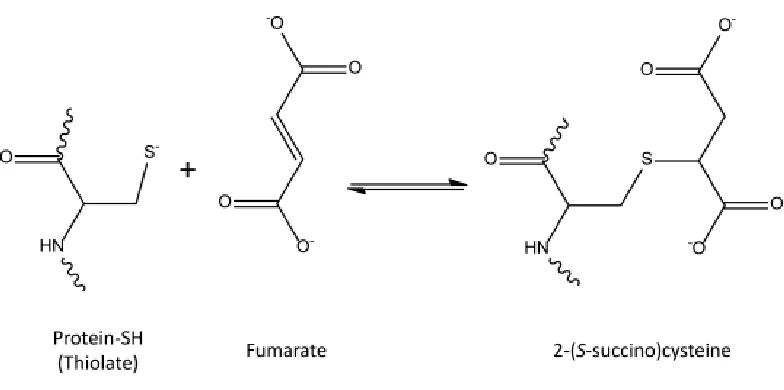
We previously identified the chemical modification S-(2-succino)cysteine (2SC), which is formed when the Krebs cycle metabolite fumarate reacts with protein cysteine residues, also termed protein succination. Protein succination is increased in the
adipose tissue of ob/ob and db/db mice in vivo and in 3T3-L1 adipocytes grown in high glucose in vitro. The increase in 2SC in the 3T3-L1 adipocyte occurs as a direct result of glucotoxicity and increased mitochondrial stress. We have shown that uncoupling agents, which lower mitochondrial stress, prevent the increase in succinated proteins.
In this study we examined the relationship between increased succination and mitochondrial bioenergetics in adipocytes matured in 30 mM (high) vs. 5 mM (normal) glucose. In addition we examined if sodium phenylbutyrate (PBA), which lowers protein succination, might be acting as an uncoupling agent in adipocytes cultured in high glucose. We observed that adipocytes matured in high glucose had a decreased spare respiratory capacity, increased proton leak across the inner membrane and increased non-mitochondrial respiration, consistent with increased mitochondrial stress. We also determined that PBA was not acting as an uncoupling agent but instead appeared to lower the mitochondrial respiratory protein content, thereby reducing respiration and protein succination.
vi
previously been documented in the adipose tissue during diabetes and during adipocyte maturation in high glucose. We assessed the development of ER stress in adipocytes matured in 5 mM vs. 30 mM glucose and observed that although most ER stress markers were unchanged with glucose concentration, the terminal ER stress marker CHOP was consistently elevated in high glucose and this occurred in parallel with increased 2SC.
The use of PBA as a therapeutic agent for the treatment of T2DM is currently being investigated in human subjects as it has been shown to reduce ER stress in the adipose tissue of animal models of T2DM. We examined the effects of PBA administration for 8 weeks in db/db mice. We observed reduced serum glucose and reduced triglyceride (TG) levels after PBA treatment; however, there was no effect of PBA on 2SC or ER stress markers in the adipose tissue of db/db mice. Unexpectedly, PBA treatment increased ER stress and TG deposition in the liver of db/db mice.
Considering that 2SC is an irreversible and stable protein modification we wanted to determine if succinated proteins could be degraded intracellularly. We demonstrated that succinated proteins are degraded by the lysosome and are released from the cell as a free amino acid (2SC) and bound in a peptide.
vii
Table of Contents
Dedication ... iii
Acknowledgements ... iv
Abstract ... v
List of Figures ... ix
List of Abbreviations ... xi
Chapter I: General Introduction ... 1
Chapter II: Adipocyte Mitochondrial Metabolism and Endoplasmic Reticulum Stress.... 13
Chapter III: Is Sodium Phenylbutyrate a Mitochondrial Uncoupler?... 31
Chapter IV: Sodium Phenylbutyrate Treatment in db/db mice ... 44
Chapter V: Turnover of Succinated Proteins ... 60
Chapter VI: Future Directions ... 78
Chapter VII: Methods ... 80
References ... 90
Appendix A: Buffer Preparations ... 97
Appendix B: Lowry Assay ... 98
viii List of Figures
Figure 1.1. ER stress pathway ... 10
Figure 1.2. Formation of 2-(S-succino)cysteine (2SC) ... 11
Figure 1.3. Glucotoxicity Driven Mitochondrial Stress increases Protein Succination .. 12
Figure 2.1 Schematic of bioenergetic profile generated from the Seahorse XF24.. ... 24
Figure 2.2. ER stress leads to apoptosis via upregulation of CHOP ... 25
Figure 2.3 A & B Bioenergetic profile of 3T3-L1 adipocytes matured in 5mM and 30mM glucose. ... 26
Figure 2.4 A. Adipogenesis proceeds via ER stress in normal or high glucose ... 27
Figure 2.4 B-E. Adipogenesis proceeds via ER stress in normal or high glucose ... 28
Figure 2.5. Increased secretion of inflammatory markers in high glucose ... 29
Figure 2.6. Insulin induces the UPR while added glucotoxicity activates the ER stress response ... 30
Figure 3.1. Chemical structure of sodium salicylate (SA) and sodium phenylbutyrate (PBA) ... 39
Figure 3.2. PBA reduces mitochondrial stress and 2SC levels ... 40
Figure 3.3. PBA reduces lipid content in adipocytes over the time course of maturation ... 41
Figure 3.4. PBA reduces mitochondrial respiration in 30mM glucose ... 42
Figure 3.5. PBA reduces ER stress and inhibits adipogenesis ... 43
ix
Figure 4.2. Effects of PBA treatment of food consumption and water intake ... 54
Figure 4.3. Effects of PBA treatment on body composition ... 55
Figure 4.4. PBA Treatment improves insulin sensitivity ... 56
Figure 4.5. PBA reduces serum triglyceride levels but increases liver triglyceride levels ... 57
Figure 4.6. PBA does not reduce ER Stress in epididymal adipose tissue of db/db mice ... 58
Figure 4.7. PBA does not alter the ER stress response but increases the inhibition of ACC ... 59
Figure 5.1. Schematic of protein degradation by the ubiquitin proteasome system .... 71
Figure 5.2. Induction of autophagy and lysosomal degradation ... 72
Figure 5.3. Time course of the turnover of succinated proteins ... 73
Figure 5.4. Turnover of succinated proteins ... 74
Figure 5.5. Modification of serum proteins by succination ... 75
Figure 5.6. GC/MS analysis of 2SC content in cell lysate and maturation medium ... 76
x
List of Abbreviations
ATF ... Activating Transcription Factor Atg ... Autophagy-Related Proteins BAT ... Brown Adipose Tissue
xi
xii
1 Chapter I
General Introduction
1.1. Epidemiology of Type 2 Diabetes Mellitus
Diabetes affects 25.8 million people, or 8.3% of the population, and is the
seventh leading cause of death in the United States. There are 18.8 million diagnosed and 7.0 million undiagnosed people with diabetes. From 2005-2008, it was estimated that 79 million Americans had prediabetes, based on fasting blood glucose (FBG) and hemoglobin A1c levels. Diabetes predominantly affects those aged 20 to 65 and older but had an incidence rate of 0.26%, equivalent to 215,000 people, in 2010 for those under age 20. The estimated cost in 2012 of treating diagnosed cases of diabetes was $245 billion, with direct medical costs accounting for $176 billion. Further complications of the disease such as heart disease, kidney failure, stroke and amputations continue to exacerbate medial costs, accounting for approximately 10% of the costs associated with treating diabetes (1).
2
these vary widely among populations; with African Americans, Alaska Natives, American Indians, Hispanics/Latinos, Native Hawaiians, and Pacific Islander Americans being more
susceptible than non-Hispanic whites (1). Despite evidence of some ethnic and genetic susceptibility, the evidence suggests physical inactivity and increased caloric intake are the greatest risk factors for developing T2DM (2).
1.2. Obesity, Hyperinsulinemia and Insulin Resistance
T2DM is the most prevalent form of diabetes, representing 90-95% of all adult cases of diabetes, and is a result of the body’s insensitivity to insulin concomitant with hyperinsulinemia, hyperglycemia, and dyslipidemia (3). T2DM is commonly preceded by prediabetes, which is characterized by elevated FBG levels ranging between 100-125 mg/dL (5.6-6.9 mM). T2DM is characterized by fasting blood glucose levels above 126 mg/dL (7 mM) and hemoglobin A1c levels above 6.5% on two separate tests (4).
3
subunits in the absence of insulin. Upon binding of insulin, the inhibition is relieved and autophosphorylation activity of the beta subunits permits specific tyrosine residues to become phosphorylated. Insulin receptor substrate (IRS) proteins 1 and 2 have 20 potential phosphorylation sites that can be regulated and serve to propagate the cascade of events induced by insulin and other growth factors. Insulin signaling appears to be primarily mediated through IRS, which generates the second messenger phosphatidylinositol (3,4,5)-triphosphate by activating phosphoinositide 3-kinase leading to dependent kinase-1 (PDK1) and phosphoinositide-dependent kinase-2 /mammalian target of rapamycin complex 2 (mTORC2) activation. PDK1 and mTORC2 can phosphorylate Akt/protein kinase B (PKB) to promote cell growth and survival (7). Akt can also promote enhanced glucose uptake and storage and inhibit gluconeogenesis through suppression of forkhead transcription factor O1, or Foxo1. Alternatively, the activation of mammalian target of rapamycin complex 1 mTORC1 via Akt is responsive to amino acids and promotes protein synthesis, lipogenesis and inhibition of autophagy. Defects in the insulin signaling pathway can result from mutations, loss of function or over/under phosphorylation giving rise to insulin resistance (7).
4
ubiquitination and degradation. Activation of c-Jun N-Terminal kinase (JNK), a mitogen-activated protein kinase (MAPK) primarily mitogen-activated by cytokines, can lead to p-IRS1 Ser307, impairing insulin sensitivity and this can be mediated by both tumor necrosis factor alpha (TNFα) and hyperlipidemia (7, 8, 9, 10). Therefore the combined effects of dysregulated glucose metabolism, dyslipidemia and inflammation, in addition to individual risk, are key factors in determining the progression of the disease (11).
1.3. Symptoms and Treatment of Type 2 Diabetes Mellitus
5
of these tissues have non-insulin dependent glucose uptake and therefore their exposure to chronic hyperglycemia has been proposed to exacerbate cellular mitochondrial dysfunction. This results in increased superoxide production (oxidative stress) and intracellular damage in these tissues (16).
1.4 Adipocyte Metabolism in Type 2 Diabetes Mellitus
In healthy individuals the body responds to the ingestion of a meal by secreting insulin to facilitate glucose uptake into insulin sensitive tissues. In response to nutrient excess the adipose tissue can expand and store the surplus calories in the form of triglycerides (TGs). The storage capacity of the adipose tissue does not exceed its limit in healthy individuals and it contains a pool of preadipocytes that differentiate into adipocytes in response to nutrient excess. In the obese/diabetic individual, the hypertrophied adipocytes have lost their capacity to store excess fuel, resulting in the storage of fat in peripheral tissues such as liver and muscle (17).
6
levels of adiponectin are associated with a decreased risk for T2DM, while decreased levels are observed in patients with T2DM (8).
The energy stored in the form of adipocyte TGs are released as free fatty acids (FFAs) when required as fuel for peripheral tissues. Obesity occurs due to an imbalance in energy expenditure versus energy intake. In the obese state the white adipose tissue (WAT) takes on a markedly different phenotype. Adipose tissue is composed of a network of cells containing adipocytes and the stromal vascular fraction; comprised of macrophages, neutrophils, eosinophils, and endothelial cells (17). In the subcutaneous adipose tissue of humans with T2DM and the visceral adipose tissue of ob/ob and db/db mice, there is increased infiltration and proliferation of macrophages (18, 19). However, the immune response appears to be secondary to adipocyte dysfunction as hypertrophied adipocytes release more FFAs, which in turn leads to the recruitment of the immune cells (20). Increased circulating FFAs can also lead to deposition of FFAs in other organs such as the liver resulting in non-alcoholic fatty liver disease (21).
7
insulin resistance (8, 9, 20). Although adipose tissue is comprised of cell types including adipocytes and macrophages, recent evidence suggests that adipocyte dysfunction is an early player in the cascade of events that contributes to the development of T2DM (17). 1.5 Adipocyte Stress
Considering the burden of adipose tissue mass and the role of the adipocyte in energy metabolism, it is critical that we understand the mechanism of adipocyte dysfunction during the progression of diabetes. Increased metabolic flux in the adipocyte increases cellular oxygen consumption leading to increased production of reactive oxygen species (ROS) in T2DM (22). The production of ROS can lead to peroxidation of lipids forming the α,β-unsaturated aldehydes 4-hydroxy and 4-oxo trans-2,3 nonenal (23). These can react with cysteine, histidine and lysine residues to
irreversibly modify proteins by carbonylation (23). In addition to mitochondrial derived oxidative stress, there is increased evidence of endoplasmic reticulum (ER) stress (ER stress) in the adipocyte in diabetes (24).
8
help chaperone misfolded proteins. Oxidoreductase proteins such as protein disulfide isomerase (PDI) can then interact with the misfolded proteins in order to catalyze disulfide bond formation and correct folding, thereby relieving the pressure on the ER. When there is an accumulation of newly synthesized or misfolded proteins in the ER and chaperone mediated folding cannot keep pace and ER stress develops (25, 26).
There are three established pathways in the ER stress response (see Chapter 2, Introduction for more details). Briefly, in the absence of ER stress, Grp78/BiP is
associated with 3 ER membrane spanning proteins: Inositol-requiring enzyme 1 (IRE1), which splices X-box binding protein 1 (XBP-1), activating transcription factor 6 (ATF6), and the RNA-dependent protein kinase-like ER kinase (PERK). However, during ER stress Grp78/BiP dissociates from these 3 membrane proteins and each of them initiates signal transduction pathways as part of the UPR. The net effect of this signaling is to cause up-regulation of chaperone proteins and transient attenuation of protein translation (Figure 1.1) (26, 27, 28).
1.6 Adipocyte Mitochondrial Stress
9
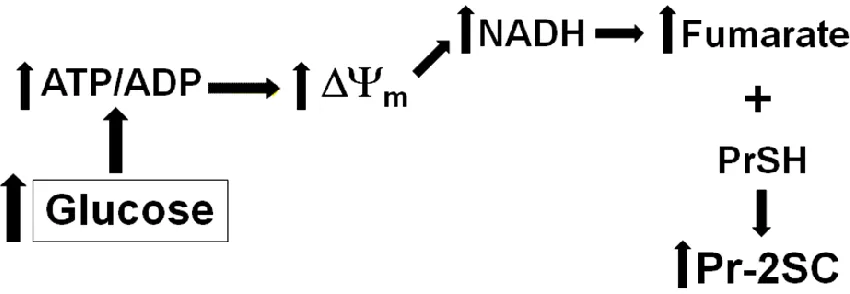
due to mitochondrial stress in adipocytes matured in high glucose as a result of an increase in the ATP/ADP ratio. As a result of respiratory control, the electron transport chain is inhibited, which concomitantly increases the mitochondrial membrane potential (ΔΨm) and the NADH/NAD+ ratio. Consequently the NAD+ dependent enzymes of the Krebs cycle are inhibited resulting in increased fumarate and protein succination (30). The identity of ~40 succinated proteins in adipocytes has been confirmed (34) and further analysis of several of these has demonstrated that succination is associated with impaired structure or function (29, 35). For example, succination of adiponectin on cysteine 39 inhibits its polymerization into the biologically active high molecular weight form and thus it is not secreted but retained in the adipocyte. This provides a unique explanation for the impaired secretion and reduced circulating levels of this hormone in diabetes (29). Additionally we have shown that PDI, an ER chaperone protein, is succinated on an active site cysteine, thereby reducing its activity and potentially exacerbating ER stress in diabetes (unpublished results).
10
11
12
13 Chapter II
Adipocyte Mitochondrial Metabolism and ER Stress
2.1. Introduction
The 3T3-L1 adipocyte model is a widely accepted model for the study of
adipocyte function in obesity and diabetes (36). These studies are frequently conducted in the presence of high glucose concentrations (25-30 mM), as many cell lines are commonly maintained under these conditions. However, recent reports have documented that extracellular glucose concentrations have a significant impact on the measurement of mitochondrial bioenergetics (37), which is of importance for experimental conditions examining mitochondrial function in diabetes. While several studies have examined adipocytes cultured in both 5 mM (normal) and 25-30 mM (high) glucose (38, 39, 40) the majority of published studies appear to be conducted in high glucose medium. The Seahorse Extracellular Flux Analyzer (XF) 24 allows for the measurement of the oxygen consumption rate (OCR) in a respiring cell. In addition, the use of several chemical compounds that interfere with respiratory chain components
allows assessment of several parameters of mitochondrial function. These include basal
respiration, ATP synthesis coupled to oxygen consumption, proton leak (using
14
(using rotenone/antimycin A) (Figure 2.1) (41). We hypothesized that adipocytes matured in 30 mM glucose versus 5 mM glucose would have an increased OCR and produce more ATP coupled to oxygen consumption. In addition, a recent report by Han et al. suggested that the majority of oxygen consumption in the cell was attributable to
NMR (22). We wanted to investigate these claims as we have observed increased mitochondrial stress in the 3T3-L1 adipocyte (30, 31). Our overall aim was to compare the mitochondrial bioenergetic profile of adipocytes matured in 5 mM glucose (normal glucose) versus 30 mM glucose (high glucose).
15
(CHOP). The up-regulation of CHOP leads to the induction of growth arrest and DNA damage-inducible protein (GADD34), causing dephosphorylation eIF2α and restoration of cellular protein synthesis (Figure 1.1) (42). However, prolonged induction of CHOP is also associated with terminal ER stress and the induction of cellular apoptosis Figure 2.2) (27, 42-46).
Several studies have shown that the UPR and ER stress occur during adipogenesis in both high glucose (25 mM or 30 mM) and high insulin (25, 26). However, these conditions are not ‘normal’ and are instead comparable to diabetic conditions. Therefore, we hypothesized that activation of the UPR was only occurring as a result of the diabetic culture conditions and we predicted that cells matured in 5 mM (normal glucose) would not have an up-regulated UPR or ER stress response. To test the relationship between high glucose/insulin and UPR activation we compared adipocytes matured in 5 mM glucose/0.3 nM insulin (normal conditions) versus 30 mM glucose /3 nM insulin (diabetic conditions). We examined markers of adipocyte differentiation to ensure that the 3T3-L1 fibroblasts had undergone a phenotypic change into an adipocyte. We also assessed UPR/ER stress markers throughout the course of adipocyte maturation to compare the effects of the different glucose/insulin conditions.
2.2. Results
16
17
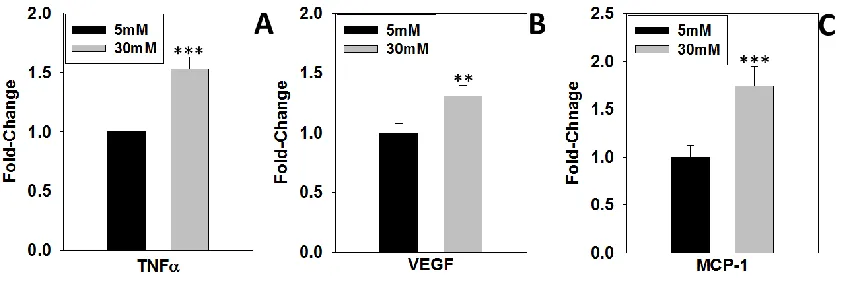
adipocytes matured in 30 mM glucose had decreased total adiponectin levels vs. those cultured in 5 mM glucose towards the end of maturation (M7 and M8) (Figure 2.4A&B, lanes 16-23). Markers of the UPR and ER stress were upregulated in adipocytes as they begin maturation in either normal or high glucose. Grp78 increased throughout maturation in normal and high glucose, with a peak level occurring in 5 mM glucose at M5 (Figure 2.3C). PDI, endoplasmic reticulum oxidoreductin-1-like protein (Ero1-Lα) and p-eIF2α were most pronounced during days M1-5 of maturation in both normal and high glucose and declined thereafter until day M8 (M1-M8, Figure 2.4A, Lanes 4-23). Concomitant with a decrease in p-eIF2α levels there was a pronounced increase in CHOP levels in adipocytes, but notably this was only in the cells matured in 30 mM glucose (Figure 2.4A&E). Consistent with previous results (29, 31), the post-translational modification 2SC increased in adipocytes matured in 30 mM glucose for up to 8 days (M2-M8, lanes 8-23), and interestingly appeared to increase in parallel with CHOP levels (Figure 2.4A). In addition to the observed decrease in adiponectin detected in Figure 2.4, the adipocytes matured in 30 mM glucose secreted increased levels of pro-inflammatory cytokines, including TNFα, VEGF and MCP-1 (Figure 2.5A-C) versus those matured in 5 mM glucose. Taken together, these results confirm that increased protein succination occurs in parallel with increased ER stress (CHOP), decreased adiponectin production and elevated pro-inflammatory cytokine production when adipocytes are matured in high glucose conditions.
18
are cultured in 0.3 nM insulin and our 30 mM glucose adipocytes are cultured in 3 nM insulin, we investigated if the combined increases in 2SC and CHOP that we observed were due to either the glucotoxicity or the high insulin concentration. To do this we examined ER stress and protein succination in the absence/presence of 10 nM insulin with both 5 mM and 30 mM glucose. As observed in Figure 2.6, the addition of insulin leads to increased protein succination in adipocytes matured in 30 mM glucose (lanes 7-12) and has no effect on the levels of protein succination in adipocytes matured in 5 mM glucose (lanes 1-6), therefore it appears that combined glucotoxicity and elevated insulin are required to observe this biomarker of mitochondrial stress. Grp78 levels were measured to assess UPR activation and suggested that insulin leads to the induction of the UPR (lanes 1-3 vs. 4-6 or lanes 7-9 vs. 10-12), independent of glucose concentration. We then measured CHOP levels, and observed a pronounced increase in CHOP in 30 mM glucose with an added response in the presence of insulin. However, CHOP was unchanged in 5 mM glucose with or without insulin (Figure 2.6), indicating that both high insulin and glucotoxicity are necessary for the maximal induction of CHOP.
2.3. Discussion
19
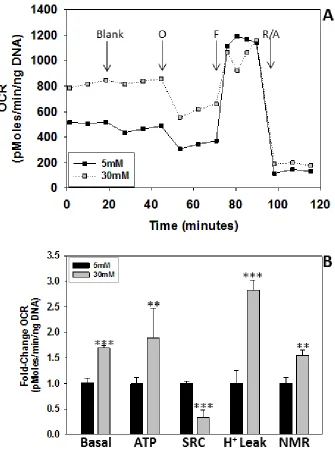
diabetic conditions, respectively. We examined the respiratory profile of adipocytes that had matured in 5 mM or 30 mM glucose for 2 days and observed that the adipocytes matured in 30 mM glucose had a ~1.7-fold increase in the basal respiration rate (Figure 2.3A&B). In contrast, the spare respiratory capacity, a measure of mitochondrial capacity to increase the rate of oxygen consumption, was ~2.4-fold lower in high glucose versus normal glucose. This data indicates that adipocytes matured in high glucose conditions are already respiring close to their maximal capacity and are not optimal for use as ‘healthy’ controls for normal adipocyte function. Recent reports have suggested that 3T3-L1 adipocytes predominantly consume oxygen in non-mitochondrial pathways (22). However, our OCR measurements allowed us to assess both mitochondrial and non-mitochondrial oxygen consumption as they included a final rotenone/antimycin A inhibition of Complex I/III, effectively inhibiting mitochondrial respiration. Our data demonstrate that non-mitochondrial respiration accounts for ~22% of the OCR (Figure 2.3B, NMR). This indicates that while non-mitochondrial respiration is significant, it is not the major source of oxygen consumption in the 3T3-L1 adipocyte model. ATP production coupled to oxygen consumption was increased in high glucose (Figure 2.3B, ATP) confirming our previous observations of an increased ATP/ADP ratio in adipocytes cultured in 30 mM glucose (30).
20
cell lines that are frequently used to study mitochondrial function in high glucose have high glycolytic activity, rather than a dependence on mitochondrial metabolism (37). Additionally, increased proton leak in adipocytes matured in 30 mM glucose suggests there may be inner mitochondrial membrane damage or electron slippage (49). We have demonstrated that there are significant differences in the mitochondrial respiratory profile of adipocytes matured in 5 mM and 30 mM glucose. Adipocytes matured in high glucose are consuming more oxygen and therefore produce more ATP and have increased NMR and proton leak. This suggests that adipocytes matured in 30 mM glucose are not healthy controls as it appears their mitochondria are working closer to their maximal capacity and may have impaired electron transport chain complexes or integrity (49).
21
2.4A&E, M2-M8). Interestingly, as CHOP levels increased in 30 mM glucose this was associated with an increase in protein succination, a biomarker of mitochondrial stress (Figure 2.4A, anti-2SC). The increase in CHOP and succinated proteins corresponded to a decrease in total adiponectin levels at days M7 – M8 in 30 mM vs. 5 mM glucose (Figure 2.4A) and was also associated with an increase in the release of the pro-inflammatory markers TNF-α, MCP-1 and VEGF into the medium (Figure 2.5A-C). Han et al. have also demonstrated that adipocytes matured in 25 mM glucose have increased adipocyte-derived factors such as serum amyloid A and hyaluronan that facilitate monocyte recruitment and adhesion (40). This evidence suggests that glucose has intrinsic effects on the adipocyte that lead to metabolic stress and cellular dysfunction. Taken together, this data confirms that UPR activation is a normal aspect of 3T3-L1 adipogenesis and activation; however the sustained increase in CHOP is associated with mitochondrial stress, protein succination, and adipocyte inflammation and is unique to high glucose culture conditions (glucotoxicity).
22
initiation factors. Interestingly, no apoptotic genes were found to be directly associated with transcriptional activation by CHOP (27). In C57BL/6J mice, CHOP was shown to suppress transcription of metabolic genes in the liver during ER stress (50), providing further evidence that CHOP is more promiscuous than once thought and its role is not limited to apoptotic events. This suggests that CHOP signaling is dependent on the nature of the stress signal and that the presence of CHOP in the cell is not necessarily indicative of an apoptotic response.
To determine whether the glucose or the insulin was the inducer of ER stress, we matured adipocytes in 5 mM or 30 mM with and without 10 nM insulin. We observed that insulin induced the UPR in both 5 mM and 30 mM glucose by upregulating Grp78 protein levels, but only high glucose and high insulin combined led to ER stress and mitochondrial stress as observed by CHOP and succinated protein levels, respectively (Figure 2.6). This confirms our earlier result indicating that adipocytes matured in high glucose are not healthy controls and are already under a state of stress, highlighting the importance of both glucose and insulin conditions for the study of mitochondrial bioenergetics and ER stress in the context of diabetes research.
23
24
25
26
27
28
Figure 2.4 B-C: Adipogenesis proceeds via ER stress in normal or high glucose.
29
30
31 Chapter III
Is sodium phenylbutyrate a mitochondrial uncoupler?
3.1. Introduction
There are two types of adipose tissue found in mammals, white adipose tissue
(WAT) and brown adipose tissue (BAT), both of which are responsive to insulin and can store TGs (53). WAT is the predominant form of AT in humans making up the bulk of fat, while BAT is a specialized tissue that plays a more prominent role in thermogenesis. BAT expresses uncoupling protein-1 (UCP-1) which is located in the mitochondria and can uncouple oxygen consumption from ATP synthesis, thereby dissipating the mitochondrial membrane potential and releasing energy in the form of heat (17). This effect of uncoupling AT has received attention as a possible therapeutic mechanism for weight loss, as it was first documented in the early 1900’s that consumption of 2,4-dinitrophenol (DNP) led to weight loss. However, DNP is also known to be carcinogenic and is no longer clinically recommended for weight loss (54).
32
respiring cell will depolarize the ΔΨm, leading to an increase in the OCR as the protons are carried across the inner membrane without simultaneous production of ATP. We have previously shown that treatment of 3T3-L1 adipocytes with CCCP or salicylic acid (SA) (acting as a mild uncoupler) decreases the ΔΨm (30). Therefore, we were interested in examining other agents that may also be acting as chemical uncouplers as we predicted that they would lead to a decrease in mitochondrial stress and consequently protein succination. We had observed that 3T3-L1 adipocytes treated with 1 mM sodium phenylbutyrate (PBA) for 8 days during maturation had reduced protein succination and a reduced ΔΨm. In other studies, PBA is currently being explored as a possible therapeutic agent for the treatment of ER stress in adipose tissue (55). However, considering that PBA and SA are similar in structure (Figure 3.1) and that SA has been shown to act as a mitochondrial uncoupler (56), we hypothesized that PBA may also be acting as a mitochondrial depolarization agent.
3.2. Results
33
the levels of protein succination (30). In Figure 3.2B, CCCP reduced the ΔΨm (***P<0.001) as expected, however, PBA treatment also reduced ΔΨm ~60% (***P<0.001) compared to untreated 30 mM glucose adipocytes.
PBA has also been documented to inhibit adipogenesis in vitro (25). We also observed a significant reduction in PPARγ, the master regulator of adipogenesis, after treatment with 1 mM PBA (Figure 3.3A). Adipocyte triglyceride content was decreased in a dose dependent manner after 2 and 8 days of PBA treatment versus 30 mM glucose alone (*P<0.05, Figure 3.3B&C). We next quantified the extracellular glucose concentrations in order to determine if PBA altered glucose uptake into the adipocyte. There was a significant amount of glucose remaining in the medium after 2 days of treatment with 1 mM PBA (***P<0.001, Figure 3.3D) versus untreated cells.
34
concentrations of 1 mM, 5 mM and 10 mM PBA (Figure 3.4A, black circles, arrows denote addition of PBA) did not appear to increase the OCR above the basal rate (Figure 3.4A), although the marginal increase was statistically significant with 10 mM PBA (***P<0.001, Figure 3.4B). As the affects after acute PBA treatment were minimal, we next examined the OCR after treatment with 1 mM or 5 mM PBA for 2 days. Interestingly, the basal OCR was significantly reduced in adipocytes matured in 30 mM glucose treated with 1 mM and 5 mM PBA (red circles vs. black triangles, red circles vs. green triangles Figure 3.4C, striped and checked bars vs. gray bars, basal respiration, ***
35
viability (data not shown). Although PBA treatment did not reduce the mitochondrial DNA copy number (Figure 3.5B), there was a reduction in the protein levels of several mitochondrial proteins including succinate dehydrogenase (SDHA) and NADH dehydrogenase [ubiquinone] iron-sulfur protein 4 (NDUFS4, a component of mitochondrial complex I), versus the 30 mM glucose controls (Figure 3.5A), suggesting that PBA may selectively lower the levels of some mitochondrial proteins.
3.3. Discussion
36
for 2 days we noted a decrease in the basal OCR and ATP production coupled to oxygen consumption (Figure 3.4C&D), which is consistent with the decrease in the ΔΨm. After further investigation we observed a reduction in the mitochondrial protein content, as noted by a decrease in SDHA and NDUFS4, but there was no change in the mitochondrial copy number (Figure 3.5A&B). Despite the reduction in the mitochondrial protein content with 1 mM PBA, the mitochondria still had the ability to increase the SRC when challenged with an uncoupler (Figure 3.4D, SRC). Additionally, basal respiration was decreased with 1 mM PBA treatment but ATP synthesis coupled to oxygen consumption remained unchanged, which may be attributed to decreased proton leak and enhanced membrane integrity (49). We also observed that PBA reduced glucose uptake by the adipocyte (Figure 3.3D), suggesting that the OCR may be reduced in part due to reduced metabolic flux (Figure 3.4D), providing further explanation for the decrease in mitochondrial protein content without a decrease in the SRC when 30 mM glucose is present. This is in contrast to in vivo studies using ob/ob mice where PBA was shown to reduce blood glucose levels after just 4 days of treatment, suggesting that it facilitates glucose uptake in an animal model of obesity (57). However, another report indicated that PBA had no effect on blood glucose in other models of diabetes such as the alloxan-induced diabetic mice or the Goto-Kakizaki rat (58). Therefore, it will be necessary to determine if PBA alters hyperglycemia in diabetic humans as cellular and animal models do not appear to show consistent effects.
37
57). Basseri et al. further characterized PBA as an agent that can inhibit adipogenesis in vitro (25). In keeping with these results, we observed a decrease in PPARγ and
adiponectin when adipocytes were treated with PBA (Figure 3.3A and 3.5A). Consistent with inhibition of adipogenesis, there is a dose dependent reduction in TG levels when adipocytes are treated with PBA during days 0-2 of maturation (Figure 3.3B&C). The UPR was also reduced by PBA as noted by the decrease in calreticulin and p-eIF2α (Figure 3.5A) but interestingly CHOP levels increased with PBA treatment.
38
39
40
41
42
43
44 Chapter IV
Sodium Phenylbutyrate Treatment in db/db Mice
4.1. Introduction
The db/db mouse is a widely used model to study obesity and T2DM. There is a
point mutation in the gene encoding the leptin receptor, rendering the receptor ineffective at binding its substrate hormone, leptin. Db/db mice have increased body weight at birth compared to heterozygotes, display hyperinsulinemia starting at 10-14 days after birth and hyperglycemia by 4-8 weeks (59). We have previously used this mouse model to examine protein succination in diabetes and have demonstrated that db/db mice have increased levels of 2SC in the adipose tissue compared to control
animals (29, 32).
45
molecular weight species that can be secreted from the cell (29). Therefore, we hypothesized that if PBA could reduce mitochondrial stress and succination in db/db mice, this may ultimately lower ER stress by preventing the succination of chaperone and/or ER processed proteins. Considering that insulin resistant and obese humans are known to have increased adipose tissue ER stress (48), we anticipated that our studies might demonstrate the therapeutic effects of PBA as a potential T2DM treatment. 4.2. Results
We administered PBA to 7 week old db/db mice for 8 weeks to assess whether or not the drug could limit adipose tissue dysfunction and reduce 2SC accumulation. The drug was administered in the drinking water of at a dosage of 1 mg/g body weight (BW)/day for the first 4 weeks and reduced to 0.5 mg/g BW/day for the remaining 4 weeks.
46
A regular chow diet was given ad libido. The amount of food consumed by the db/db mice was greater than the amount consumed by control mice, Figure 4.2A;
although statistical analyses are not available as we housed 3 mice per cage. The db/db mice receiving PBA treatment tended to consume less food during the early weeks 1-5, ~7 g/day when compared to the untreated db/db mice who consumed ~9 g/day (Figure 4.2A). Food consumption was not different for any of the control mice throughout the study, with both groups consuming ~4-5 g/day. Water consumption was similar between control mice, ~0.2-0.3 mL/day/BW. The db/db (-)PBA mice consumed ~0.4-0.6 mL/day/BW (Figure 4.2B) whereas the db/db (+)PBA mice consumed ~0.2-0.3 mL/day/BW , similar to control mice (Figure 4.2B). The dosage of PBA in the water was reduced by 50% after 4 weeks treatment to ensure that the db/db (+)PBA mice were not drinking less water due to a dislike or ill effect of the drug.
47
mice (###p<0.001, Figure 4.3B), but no change was observed between db/db (-)PBA and db/db (+)PBA mice (Figure 4.3B).
To assess insulin sensitivity, we performed an insulin tolerance test after 7 weeks of PBA treatment. Insulin was injected intraperitoneally and blood glucose was measured over the course of 120 minutes. There was no difference in the response to insulin observed in the control mice with or without PBA treatment (Figure 4.4). There was a slight but significant reduction in the blood glucose levels of the db/db (+)PBA after 120 minutes compared to db/db (-)PBA (*p<0.05, Figure 4.4).
As PBA has been shown to reduce TG levels in ob/ob mice (57) we measured TG content in the serum of overnight fasted mice. TG levels ranged from 50-90 mg/dL in control mice and were elevated in db/db (-)PBA mice to ~150 mg/dL beginning at 9 weeks of age (Figure 4.5A). Db/db (+)PBA mice had significantly reduced TG levels, ~50-75 mg/dL, compared to db/db (-)PBA mice (*P<0.05, **P<0.01 and ***P<0.001, db/db (+)PBA vs. db/db (-)PBA, Figure 4.5A) throughout the course of PBA treatment. We then examined the TG content in the liver and observed ~5-fold increase in db/db (-)PBA versus control mice (###P<0.001 db/db, Figure 4.5B). Surprisingly, there was ~1.6-fold increase in TG levels in db/db (+)PBA compared to db/db (-)PBA mice (*P<0.05, Figure 4.5B).
48
succinated proteins in the db/db (+)PBA compared to the db/db (-)PBA mice (Figure 4.6). The adipogenic marker PPARγ was increased in db/db (-)PBA and db/db/+)PBA mice versus control and was unaltered by PBA treatment. PDI is moderately increased and there is a pronounced increase in CHOP protein levels in db/db mice versus control. This was unchanged by PBA treatment (Figure 4.6). Grp78 was decreased in db/db (-)PBA mice compared to control, and was increased db/db (+)PBA mice. Overall, PBA did not appear to have any significant effects on protein succination or the UPR/ER stress proteins in the epididymal adipose tissue of db/db mice.
Previous studies have shown that the liver has reduced TG levels, improved insulin signaling and decreased ER stress in ob/ob mice upon PBA treatment (57). In the liver tissue of the db/db (-)PBA and db/db (+)PBA mouse we detected increased PDI and CHOP levels but decreased Grp78 compared to control mice (Figure 4.7). Considering the significant increase in liver TG levels in db/db (+)PBA mice, we examined several proteins involved in fatty acid synthesis. The levels of phospho-acetyl-CoA carboxylase (p-ACC) were unchanged between control and db/db (-)PBA mice but the db/db (+)PBA mice had increased levels of p-ACC compared to both groups. Fatty acid synthase (FAS) was increased in db/db mice versus control (Figure 4.7) but no difference was observed in the protein levels with PBA treatment.
4.3. Discussion
49
increased levels of protein succination in the suprarenal, subcutaneous and epididymal adipose tissue of these mice at 15 weeks age (32). In addition, activation of the UPR and ER stress have been documented in the liver and adipose tissue of db/db mice (60, 61). As we have shown that adiponectin (29) and PDI (unpublished results) are succinated in the adipose tissue of db/db mice, we hypothesized that PBA might reduce protein succination, thereby reducing ER stress and improving adipose homeostasis in db/db mice.
50
4.2B), therefore, we reduced the dosage of the drug appropriately to eliminate the possibility that any differences we observed were due to the effects of dehydration. Surprisingly, db/db (+)PBA mice consumed ~50% less water than db/db (-)PBA mice while control mice consumed the same amount of water throughout the 8 week treatment whether not PBA was present in their drinking water. As the drug concentration was adjusted weekly based on the body weight of the mice, by week 8 of treatment, the control (+)PBA mice were receiving a more concentrated solution of PBA water than the db/db (+)PBA mice. This suggests the reduced water consumption by the db/db (+)PBA mice was not related to taste, although PBA is known to have a bitter
taste.
We assessed whole body composition at 14 weeks of age (7 weeks treatment) and did not observe any changes in lean mass, fat mass or % fat in db/db mice with or without PBA treatment. Surprisingly, control (+)PBA mice had significantly higher % fat and decreased lean mass compared to control (-)PBA (Figure 4.5A). As we did not observe any differences in FBG, serum TG levels or food/water consumption between control mice with or without PBA treatment, we did not initially examine the epididymal or liver tissue in the treated controls. However, we are planning to analyze these tissues in the future as PBA may be having select effects on control mice.
51
(Figure 4.5A), there was an unexpected increase in TG levels in the liver tissue (Figure 4.5B). We next examined the lipogenic protein levels to determine if lipogenesis was more active after PBA treatment, explaining the increase in TGs. It was found that regulation of the first step of fatty acid synthesis by p-ACC was unchanged between control and db/db (-)PBA mice but FAS was increased in db/db (-)PBA mice (Figure 4.7), suggesting that the fatty liver in db/db mice at 15 weeks is associated with up-regulation of FAS (64). We also found that p-ACC levels were increased in db/db (+)PBA mice compared to db/db (-)PBA mice, which suggests that there would have been less TG deposition as ACC catalyzes the first step in fatty acid biosynthesis (Figure 4.7). Further examination of other components of the lipogenic pathway may be necessary to determine what is contributing to increased triglycerides in liver. Additionally the 15 week time point at which we looked at these enzymes may be too late and only offers limited insight into the regulation of TG accumulation which may have occurred at an earlier time point. (50).
52
unchanged by PBA treatment (Figure 4.6). This is a surprising result as db/db mice have increased ER stress in the adipose tissue and that PBA was able to lower ER stress in and high fat diet fed mouse and ob/ob mouse (25, 57).
53
54
55
56
57
58
59
60 Chapter V
The Turnover of Succinated Proteins
5.1. Introduction
In the cell there are two protein degradation pathways for the removal of
damaged or unwanted proteins, the ubiquitin proteasome system (UPS) and the lysosomal degradation system (also referred to as autophagy) (Figures 5.1 & 5.2) (65, 66). Protein degradation is a regulated process that responds to remove damaged proteins and organelles or to provide amino acids in response to changes in the cellular nutrient status (67).
61
regulatory particle (RP). The CP is a barrel-shaped structure in which the proteolytic activity is sequestered and has limited access to proteins destined to be degraded as a result of gating by other residues. The proteolytic core contains three proteases with different specificities; acidic residues (caspase-like), basic residues (trypsin-like) and hydrophobic residues (chymotrypsin-like) (Figure 5.1) (68).
Autophagic degradation has a much broader proteolytic role than proteasomal degradation in that whole organelles such as mitochondria (mitophagy) or peroxisomes (pexophagy) can be degraded in addition to individual proteins (67). In the first step of autophagy a double-membraned structure known as a phagophore surrounds items to be degraded. As the phagophore is forming, more ‘cargo’ can be added and the membrane can continue to grow until it becomes an enclosed double-membrane structure known as an autophagosome, a process that is mediated by several autophagy-related proteins (Atgs) (Figure 5.2) (69). In the committed step of autophagy, microtubule-associated protein light chain 3 (LC3-I) is converted to LC3-II via lipidation with phosphatidylethanolamine and is attached to the autophagosome. The cargo-loaded vesicle can then fuse with the lysosome, which contains hydrolases capable of protein degradation (67). The primary hydrolases present in the lysosomes of adipocytes are cathepsin B (cysteine protease) and cathepsin D (aspartic protease) (70).
62
the stability of the thioether bond and that there are no known enzymes that can cleave the thioether bond, we hypothesized that succinated cytosolic proteins were predominantly being degraded in the adipocyte by the proteasome. We therefore investigated the turnover of succinated proteins in the 3T3-L1 adipocyte cultured in high glucose conditions versus normal glucose to determine if (1) succinated proteins were being turned over and (2) the mechanism of degradation of succinated proteins.
5.2. Results
63
5.3B). If the 30 mM glucose is replaced with 5 mM glucose for longer time periods, from 1 day up until 4 days, the extent of protein succination is further reduced (Figure 5.3B).
To determine the intracellular mechanism by which the succinated proteins were being degraded, we next inhibited either the proteasome or the lysosome. MG132 (a proteasome inhibitor) or chloroquine (a lysosomal inhibitor) were used to attenuate protein degradation. The adipocytes were matured for 4 days in 30 mM glucose and then switched to 5 mM glucose -/+ MG132 or chloroquine for the remaining 4 days of maturation. Figure 5.4A&B confirms that 2SC is increased in adipocytes matured for 8 days in 30 mM and that this is decreased when the high glucose stimulus is removed after 4 days and replaced with 5 mM glucose for the remaining 4 days (lanes 4-6 vs. 7-9). For the adipocytes that were switched from 30 mM to 5 mM glucose and simultaneously treated with 17.5 µM MG132 (lanes 10-12, Figure 5.4A), there was no accumulation of succinated proteins (Figure 5.4A), suggesting the proteasomal inhibition does not prevent the degradation of succinated proteins. However, in a parallel experiment where the adipocytes were switched from 30 mM to 5 mM glucose and treated with 25 µM chloroquine, succinated proteins did accumulate (lanes 10-12, Figure 5.4B). This indicated that the lysosome appears to be primarily responsible for the degradation of succinated proteins. Inhibition of the lysosome was confirmed by the pronounced increase in LC3-I and LC3-II in chloroquine treated adipocytes compared to the untreated adipocytes (Figure 5.4B).
64
gas chromatography-mass spectrometry (GC/MS). We measured the basal levels of 2SC in the Dulbecco’s Modified Eagles Medium (DMEM) and 10% fetal bovine serum (FBS) to ensure that the 2SC we detected was produced by the adipocyte (rather than measure any endogenous 2SC in the cell culture reagents). In DMEM, we detected ~0.03 mmol 2SC/mol lysine and in DMEM supplemented with 10% FBS we detected ~0.05 mmol 2SC/mol lysine (data not shown). It has previously been shown that the levels of fumarate in the cell culture medium increase throughout adipocyte maturation in 25 mM glucose (71). We determined the amount of 2SC present on FBS proteins (predominantly albumin) when adipocytes were matured in 5 mM or 30 mM glucose in order to ensure that any free 2SC detected in the maturation medium was being released from the cells and was not derived from the released fumarate modifying FBS proteins (Figure 5.5). In order to do this we separated the serum protein from the free amino acids/peptides released from the cell by trichloroacetic acid precipitation of the protein in the medium. When the serum protein was analyzed (after it was hydrolyzed to release free 2SC) there was no difference in the levels of 2SC in the maturation medium of adipocytes matured in 5 mM or 30 mM glucose on days 4-6, (Figure 5.5). This indicated that any changes in 2SC could not be attributed to fumarate reacting with serum proteins in the medium.
65
66
days 6-8 (Figure 5.6D). Unexpectedly, the adipocytes that had been treated with chloroquine had a ~1.6-fold increase in 2SC in the culture medium on days 6-8 vs. adipocytes matured in normal glucose for 8 days (***p<0.001, Figure 5.6D).
The above measurements demonstrated that free 2SC was detectable in the culture medium. However, the hydrolysis step in preparation for GC/MS analysis did not allow us to differentiate whether the 2SC was released as a free modified cysteine or as part of a small peptide incorporating the 2SC. We examined the culture medium of adipocytes matured in normal or high glucose on days 4-6. The samples were divided into two equal parts after removal of the serum proteins, one part being subjected to hydrolysis to determine the total amount of 2SC, and the other not hydrolyzed representing the amount of free 2SC released from the adipocyte. As observed in Figure 5.7, there was ~0.039 mmol 2SC/mol lysine total in the culture medium while there was 0.008 mmol 2SC/mol lysine detected as free 2SC in the culture medium in adipocytes matured in 5 mM glucose. In adipocytes matured in 30 mM glucose there was 0.09 mmol 2SC/mol lysine total in the culture medium while 0.04 mmol 2SC/mol lysine is liberated as free 2SC. The difference in the total 2SC and that detected as free 2SC (detected in the absence of peptide hydrolysis) represents the fraction that is peptide bound, demonstrating that 2SC is released both as a free amino acid and as part of a peptide.
5.3. Discussion
67
68
The analysis of the 2SC content in the cell lysates and culture medium by GC/MS (Figure 5.6A-D) indicated that levels of succinated proteins in adipocytes matured in 30 mM glucose were always significantly increased compared to 5 mM glucose. We were able to detect 2SC in the culture medium at all time points from days 2-8 indicating the turnover of some fraction of succinated proteins appears to be a continuous process in adipocytes matured in both 30 mM and 5 mM glucose. We also demonstrated that 2SC is released from the adipocyte both as a free amino acid and as part of a peptide, as indicated by the differences in the levels of 2SC that were detected when the samples were prepared -/+ hydrolysis to release the 2SC (Figure 5.7).
When adipocytes are matured in high glucose and then switched to normal glucose, the levels of succinated proteins are significantly reduced compared to adipocytes that matured in high glucose for 8 days (Figure 5.6A). Analysis of the 2SC content in the culture medium of these adipocytes from days 4-6 and days 6-8 did not show an increase in the levels of 2SC released from the cell, which was unexpected as the intracellular levels of 2SC had been reduced close to normal levels. During the workup process of the cell lysate, the proteins are precipitated with 10% TCA and free amino acids and peptides remain the supernatant and this was not analyzed for the cell lysates. It is possible that the ‘missing’ 2SC had been degraded into peptides and amino acids, but had not yet been released into the medium by the cell and therefore was not detected.
69
stimulus is removed (Figure 5.4B & 5.6A). The analysis of the culture medium on days 4-6 did not show a significant increase in the amount of 2SC compared to 5 mM glucose, indicating that the degradation of 2SC modified proteins had been prevented. However, the culture medium from days 6-8 indicated a significant increase in the levels of 2SC (Figure 5.6D) which was not expected when the lysosome is inhibited. We suspect that prolonged inhibition of the lysosome may alternatively up-regulate proteasomal activity, thereby degrading proteins that may not normally be degraded by that pathway and contributing to the detected increase in 2SC (72).
70
cytokines (Figure 2.4), suggesting that impaired autophagy is associated with adipocyte dysfunction.
71
72
73
74
75
76
77
78 Chapter VI
Future Directions
We are interested in continuing our investigation into the role of ER stress in the development of T2DM and plan to examine human adipose tissue and determine if
protein succination is increased in T2DM subjects. We are also interested in alternative chemical agents/uncouplers that may reduce protein succination as they may be therapeutically beneficial in treating T2DM.
79
80 Chapter VII
Methods
Materials. Unless otherwise noted, all chemicals were purchased from Sigma Aldrich (St.
Louis, MO). Preparation of 2SC antibody was prepared by Eurogentec (Fremont, CA)
Sodium phenylbutyrate (PBA) was from Enzo Life Sciences (Farmingdale, NY) for in vitro studies and Scandinavian Formulas Inc. (Sellersville, PA) for in vivo studies. Polyvinylidene fluoride (PVDF) was purchased from GE Healthcare (Farifield, CT). L-glycine, sodium dodecyl sulfate (SDS), sodium salicylate (SA), and Tween-20 were purchased from Fisher Scientific (Waltham, MA). For in vitro studies insulin was purchased from Bio Ab Chem (Ladson, SC). For in vivo studies insulin was purchased from Sigma Aldrich (St. Louis, MO). For in vitro studies glucose oxidase was from Invitrogen (Grand Island, NY) and for in vivo studies glucose oxidase was from Raichem (San Marcos, CA). Criterion™TGX™ Precast Gels were from Bio-Rad (Hercules, CA). The CyQuant® assay was from Invitrogen (Grand Island, NY). All materials for the Seahorse XF24 were purchased from Seahorse Bioscience (North Billerica, MA) except pyruvate, glucose, insulin, and mitochondrial inhibitors.
81
PBA was administered in the drinking water at a dosage of 1 mg/g BW/day for the first 3 weeks and was reduced to 0.5 mg/g BW/day for the remaining 4 weeks of the study. Animals were sacrificed at 15 weeks of age. Blood glucose measurements were performed weekly after an overnight fast by collecting tail vain blood using a Bayer (Whippanny, NJ) Countour® blood glucose meter for control animals and the glucose oxidase assay for db/db mice.
Water and food consumption was measured biweekly. All animal handling and experiments were conducted according to the guidelines of the University of South Carolina Institutional Animal Care and Use Committee. Animals were sacrificed using CO2 asphyxiation and epididymal adipose tissue was removed and rinsed in PBS with protease inhibitors and frozen on dry ice. Livers were removed and immediately frozen on dry ice.
Body Composition. Body composition was measured at 14 weeks using a Dual Energy
X-ray Absorptiometry scan under isoflurane anesthesia, measuring fat and lean content. Insulin Tolerance Test. Insulin tolerance tests were performed at 14 weeks of age on all
mice. The mice were fasted starting the morning of the test for 4.5 hours. Insulin was injected intraperitoneally, 2 U. Blood was collected by tail vein at time 0, 15, 30, 60, 90, and 120 minutes after injection of insulin. Blood glucose was measured in control animals using a Bayer (Whippanny, NJ) Countour® blood glucose meter. In db/db mice, the glucose oxidase assay was used to measure serum blood glucose levels.
82
seconds each. The tissue sat on ice for 30 minutes and was then centrifuged at 2800 g for 10 minutes at 4 oC. A pellet, infranatant and supernatant were then visible. The infranatant, up to 1.5 mL was then collected using a needle and syringe. Acetone, 9X volume, was then added to the samples, vortexed, then let sit on ice for 10 min. The samples were then centrifuged at 2800 g for 10 minutes at 4oC. The acetone was decanted and the samples let air dry for 10 min on ice. The samples were then resuspended in 0.5 – 1 mL of radio RIPA buffer and sonicated 3 times for 10 seconds each. The samples were then centrifuged at 15000 rpm for 10 min at 4 oC yielding an infranatant and a fat layer. The infranatant was collected and the protein concentration was determined using the Lowry assay.
Protein Extraction from Liver Tissue. Liver tissue was added to 2 mL ice-cold RIPA buffer
and sonicated 2 times for 10-15 seconds each and was then centrifuged at 2800 g for 10 minutes at 4 oC. A pellet, infranatant and supernatant were then visible. The infranatant, up to 1.5 mL was then collected using a needle and syringe. Acetone, 9X volume, was then added to the samples, vortexed then let sit on ice for 10 min. The samples were then centrifuged at 2800 g for 10 minutes at 4oC. The acetone was decanted and the samples let air dry for 10 min on ice. The samples were then resuspended in 1 mL of RIPA buffer and sonicated 3 times for 10 seconds each. The samples were then centrifuged at 15000 rpm for 10 min at 4 oC yielding an infranatant and a fat layer. The infranatant was collected and the protein concentration was determined using the Lowry assay.
83
protease inhibitors and sonicated 3 times for 10 seconds each. 300 μL of sample was then extracted using 8:4 chloroform:methanol. The samples were vortexed, then let sit on ice for 10 min followed by centrifugation at 2000 g for 10 min at 4 oC. Three layers formed with the protein interface dividing the infranatant and supernatant. The infranatant was collected and was dried under air. The samples were resuspended in 5% BSA and triglyceride concentration was determined using InfinityTM Triglycerides assay kit (Thermo Fisher Scientific, Waltham, MA), according to the manufacturer’s instructions.
Cell Culture. 3T3-L1 murine fibroblast were purchased from American Type Culture Collection (Manassas, VA) and maintained up to 8 passages in DMEM containing 5 mM glucose, 10% Bovine Calf Serum (Thermo Scientific), 1% penicillin/streptomycin (CellGro) at 37oC with 5% CO2 and 95% humidity. Medium was changed every 2 days. At 70-80% confluence cells were trypsinized (Thermo Scientific), neutralized with excess medium and collected by centrifugation at 1000 g for 5 min at 25oC. The cells were then resuspended in medium for a new passage.
84
5 mM/0.3 nM or 30 mM/3 nM glucose/insulin was applied. The medium was changed every 2 days and the adipocytes were matured for up to 8 days. Cells cultured in 5 mM glucose were supplemented with 5mM glucose daily and several hours prior to protein harvest to maintain glucose levels.
Measurement of triglycerides, glucose, and inflammatory markers in 3T3-L1
adipocytes. Triglyceride content was measured in 10 µl aliquots of cell lysates using the
InfinityTM Triglycerides assay kit (Thermo Fisher Scientific, Waltham, MA), according to the manufacturer’s instructions. Glucose concentration was measured in phenol red free medium using the Amplex® Red Glucose/Glucose Oxidase Assay kit (Invitrogen, Grand Island, NY). The media on 3T3-L1 adipocytes was replaced with serum-free DMEM for 18 hrs. Pro-inflammatory cytokines in the conditioned media were analyzed by ELISA according to the manufacturer’s instructions (mouse Obesity ELISA, Signosis, Santa Clara, CA).
DNA isolation and mitochondrial content analysis. Cell lysates were collected in 500 µL
85
350 µL 100% ethanol and 35 µL of 3 M sodium acetate, pH 5.2, and collected by centrifugation at 15000 rpm for 2 min. The DNA pellet was washed with 70% ethanol, dried, then resuspended in 100 µL water. The samples were stored at -20°C until PCR.
Quantitative real-time PCR analysis was carried out in 25 μl reactions consisting of 2x SYBR green PCR buffer (AmpliTaq Gold DNA Polymerase, Buffer, dNTP mix, MgCl2) (Applied Biosystems, Foster City, CA, USA), 0.150 μg DNA, DI water, and 60 nM of each primer. PCR was run with the DNA sample with Cytochrome B Forward, 5′ - ATT CCT TCA TGT CGG ACG AG −3′; Cytochrome B Reverse, 5′ - ACT GAG AAG CCC CCT CAA AT - 3′, GAPDH Forward, 5′ - TTG GGT TGT ACA TCC AAG CA - 3′; GAPDH Reverse, 5′ - CAA GAA ACA GGG GAG CTG AG - 3′. Samples were analyzed on an ABI 7300 Sequence Detection System. Reactions were incubated for 2 minutes at 50°C and 10 minutes at 95°C, followed by 40 cycles consisting of a 15 sec denaturing step at 95°C and 1 min annealing/extending step at 60°C. Data were analyzed by ABI software (Applied Biosystems, Foster City, CA, USA) using the cycle threshold (CT), which is the cycle number at which the fluorescence emission is midway between detection and saturation of the reaction. The 2-Δ CT method was used to determine changes in gene expression between Cytochrome B with GAPDH CT as the correction factor.
86
for 10 minutes at 4oC yielding a white to pale yellow protein pellet. The supernatant was decanted and the pellet let air dry for 10 minutes on ice. The protein was resuspended in RIPA buffer and pulse sonicated for 3 intervals of 3 seconds. The samples were stored at -70oC until further analysis.
Western Immunoblotting. Samples were prepared using 25-40 µg for cell lysates and
40-100 μg for mice tissue with the addition of 5-7 μL 4X Laemmli loading buffer. The samples were then boiled at 95oC, flash centrifuged then loaded on 7.5%, 12% or 18% gels and electrophoresed at 200 V for 60 min. The protein was transferred to a PVDF membrane in transfer buffer at 250 mA for 100 min or 40 mA at 4 oC. The membrane was ponceau stained then blocked in 5% non-fat milk or 5% bovine serum albumin (BSA) according to the manufacturer’s instructions. Membranes were probed using primary polyclonal anti-2SC. Antibodies for ACC, ACC, calreticulin, cleaved caspase-3, eIF2α, p-eIF2α, Ero1-Lα, FAS, fumarase, LC3, and succinate dehydrogenase were from Cell Signaling. Adiponectin was from R&D Systems. CHOP was from Thermo Scientific. NDUSF4 was from AbCam. β-tubulin, Grp78 and PDI were from Santa Cruz. Pierce® ECL 2 Western Blotting Substrate or Amersham™ ECL™ Prime Western Blotting Detection Reagent (GE Healthcare) was used and followed by detection of chemiluminescence using photographic film (Denville Scientific, Metuchen, NJ). Image J software (NIH) was used to quantify band intensity by densitometry.
GC/MS Analysis of 2SC. 3T3-L1 adipocytes were matured as described in cell culture.